T-cell prolymphocytic leukemia
T-cell large granular lymphocytic leukemia
Chronic lymphoproliferative disorders of NK cells
Aggressive NK-cell leukemia
Epstein-Barr virus (EBV) positive T-cell lymphoproliferative disorders of childhood
Systemic EBV-positive T-cell lymphoproliferative disease of childhood
Hydroa vacciniforme-like lymphoma
Adult T-cell leukemia/lymphoma
Extranodal NK/T-cell lymphoma, nasal type
Enteropathy-associated T-cell lymphoma
Hepatosplenic T-cell lymphoma
Subcutaneous panniculitis-like T-cell lymphoma
Mycosis fungoides
Sézary syndrome
Primary cutaneous CD30-positive T-cell lymphoproliferative disorders
Primary cutaneous peripheral T-cell lymphomas, rare subtypes
Primary cutaneous gamma-delta T-cell lymphoma
Primary cutaneous CD8-positive aggressive epidermotropic cytotoxic T-cell lymphoma
Primary cutaneous CD4-positive small/medium T-cell lymphoma
Peripheral T-cell lymphoma, NOS
Angioimmunoblastic T-cell lymphoma
Anaplastic large cell lymphoma, ALK-positive
Anaplastic large cell lymphoma, ALK-negative
TR Gene Rearrangements
Pluripotent bone marrow (BM) stem cells give rise to progenitor T cells, which migrate to the thymus for primary ontogeny. There, early in T lymphocyte development TR genes undergo somatic rearrangement of germline gene sequences, similar to the process that occurs with immunoglobulin heavy chain (IGH) and kappa and lambda light chain (IGK and IGL) genes. The four TR genes are: TR delta (TRD) at chromosome 14q11, TR gamma (TRG) at 7p14, TR beta (TRB) at 7q34, and TR alpha (TRA) at 14q11. In the germline configuration, TRD and TRB contain multiple variable (V), diversity (D), and joining (J) region segments. The TRG and TRA loci do not contain D segments. Depending on the locus, the number of segments is 8–67 V segments, 2–3 D segments, and 4–61 J segments [3]. For TRD and TRB, the somatic rearrangement initially involves the joining of one D to one J segment, followed by the joining of one V segment to the DJ segment (Fig. 43.1). For TRG and TRA, the V segment is joined to the J segment. The rearrangement process results in the deletion of the intervening coding and noncoding DNA sequences between the linked V, D, and J segments. Thus, the TRD and TRB gene rearrangements result in V-D-J juxtaposition similar to IGH, and TRG and TRA rearrangements result in V-J rearrangements similar to IGK and IGL. In all cases, the V-(D)-J segment is joined to the downstream constant (C) region by mRNA splicing. The TR genes are ultimately translated into two types of receptors, which exist as heterodimers (αβ or γδ). Of note, the TR genes do not undergo somatic hypermutation as occurs with antigen stimulation for the immunoglobulin (Ig) genes.
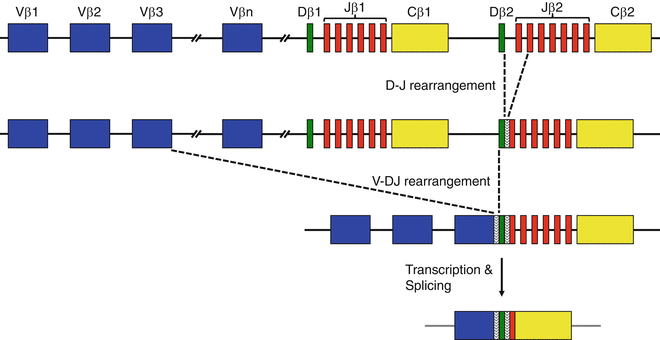
Figure 43.1
The TRB locus is used as an example to demonstrate the rearrangement of the variable (V), diversity (D), joining (J), and constant (C) region gene segments. The hashed white boxes between the rearranged V-D and D-J gene segments represent variable regions of nucleotide deletion and addition that occur during TR gene rearrangement
The TR genes generally rearrange in the following order: TRD, TRG, TRB, and finally TRA [4]. The TRD genes are located within the TRA locus, so rearrangement of TRA will result in TRD deletion on that allele. Also of note for clonality assessment, this hierarchical order of rearrangements results in both αβ- and γδ-T cells containing TRG rearrangements. For this and other reasons, TRG is commonly used for PCR-based clonality assessment.
The numerous different V, (D), and J segments present within each TR locus enable a large number of different V-(D)-J segments to be generated. The TR repertoire is further expanded by deletion and addition of nucleotides between the D-J and V-D junctions by terminal deoxynucleotidyl transferase (TdT), and by the combinations of different α–β or γ–δ chains. Collectively, these mechanisms generate extensive diversity of TRs with varying antigen specificity.
More than 95 % of mature, circulating T cells express the αβ receptor. In contrast, γδ T cells are mainly found in the skin, spleen, gastrointestinal tract, and other extranodal sites, which are often sites of origin for γδ T-cell lymphomas. T-cell neoplasms ensue after maturation arrest at one of the stages of T-cell development, such as from immature T cells in T lymphoblastic leukemia/lymphoma, or from more mature T cells in peripheral TCL and mycosis fungoides. Due to a common progenitor as well as some shared functional and immunophenotypic features, NK-cell neoplasms often are classified with mature T-cell neoplasms. Since NK cells do not rearrange the TR genes, neoplasms derived from these cells do not demonstrate TR gene rearrangements. The mature T- and NK-cell neoplasms of the WHO classification are listed in Table 43.1 [2].
Somatic Chromosomal Abnormalities
A variety of somatic structural and numeric chromosomal abnormalities have been observed in mature TCL, and a subset of these is listed in Table 43.2. ALK-positive anaplastic large cell lymphoma (ALCL), is associated with translocations involving the anaplastic lymphoma receptor tyrosine kinase (ALK) gene on chromosome 2. The most common ALK translocation is t(2;5)(p23;q35), which occurs in approximately 75 % of ALK-positive ALCL cases and results in the fusion of nucleophosmin (NPM1) on chromosome 5 with ALK [5, 6]. The t(1;2)(q21;p23) occurs in approximately 15 % of ALK-positive ALCL cases and results in the fusion of the tropomyosin 3 (TPM3) gene on chromosome 1 with ALK [5, 7]. The numerous other less common ALK fusion partners include ATIC at 2q35, TFG at 3q12, CLTC at 17q23, MSN at Xq12, TPM4 at 19p13, MYH9 at 22q12, and RNF213 (ALO17) at 17q25 [5, 8]. The various translocations result in the activation of ALK, which is not normally expressed in lymphocytes, with subsequent oncogenic actions [5, 6].
Table 43.2
Select somatic chromosomal abnormalities associated with mature T-cell neoplasms
WHO classification | Chromosomal abnormality |
|---|---|
T-cell prolymphocytic leukemia | inv(14)(q11q32); TRA–TCL1 |
Enteropathy-associated T-cell lymphoma | Chromosome 9q gains |
Hepatosplenic T-cell lymphoma | i(7)(q10) |
Primary cutaneous anaplastic large cell lymphoma | IRF4 (6p25) rearrangements |
Anaplastic large cell lymphoma, ALK-positive | t(2;5)(p23;q35); NPM1–ALK |
Other somatic structural chromosomal abnormalities commonly associated with mature TCL include an inversion of chromosome 14 [inv(14)(q11q32)] associated with T-cell prolymphocytic leukemia [9], and an isochromosome involving the long arm of chromosome 7 [i(7)(q10)] often present with trisomy 8 and associated with hepatosplenic TCL [10]. In addition, amplification of oncogenes and loss of tumor suppressor genes can contribute to the development of mature TCL. As an example, gains involving the long arm of chromosome 9 are observed in more than half of enteropathy-associated TCL [11]. Likewise, loss of function of the CDKN2B (P15) and CDKN2A (P16) genes on the short arm of chromosome 9 due to allelic loss and aberrant promoter methylation occurs in mycosis fungoides and Sézary syndrome [12].
Indications for Testing
The diagnosis of a mature T- or NK-cell neoplasm is primarily based on histology, immunophenotype, and clinical information. For a subset of cases, distinguishing between a reactive and neoplastic process is difficult. Furthermore, in contrast to restricted Ig light-chain expression in mature B-cell lymphomas, T cells do not have a definitive immunophenotypic marker of clonality. Therefore, detection of a clonal TR gene rearrangement can assist in classifying the suspected lymphoproliferation as reactive or neoplastic. Due to specimen and test availability, clonality assessment most commonly involves PCR-based analysis of the TRG locus, or less frequently the TRB locus. If sufficient fresh or frozen neoplastic specimen is available, Southern blot analysis of the TRB locus may be considered.
Another potential application of TR gene rearrangement assays includes determination of clonal relatedness of multiple lesions derived from the same patient. T-cell neoplasms that share the same clonal origin will generally demonstrate identical TR gene rearrangement; however, ongoing and secondary rearrangements of the TR loci may result in alteration or loss of this initial TR rearrangement. Evolution of the TR rearrangement has primarily been observed with precursor lymphoid neoplasms [13]. Other reported applications of TR gene rearrangement assays include staging, minimal residual disease (MRD) monitoring, and lineage assignment, but most clinical assays do not have sufficient sensitivity for the first two applications and cross-lineage rearrangements are observed at a high enough rate to limit the utility of use for lineage assignment.
Although it is less commonly applied in routine clinical practice, demonstration of somatic chromosomal structural or numeric abnormalities by molecular or cytogenetic methods can assist in classifying the suspected lymphoproliferation as reactive or neoplastic. Only a few T-cell neoplasms are associated with specific chromosomal structural abnormalities, but these may assist with subclassification. As an example, the t(2;5)(p23;q35) involving NPM1 and ALK, as well as other ALK rearrangements, are found in ALK-positive ALCL. More recently, data from multiple groups collectively indicate that IRF4 rearrangements (Fig. 43.2) are found in 25–30 % of primary cutaneous anaplastic large cell lymphomas, but are uncommon in T-cell neoplasms considered in the differential diagnosis, including cutaneous involvement by systemic ALK-negative ALCL, lymphomatoid papulosis, and transformed mycosis fungoides [14–16]. Consequently, testing for IRF4 rearrangements by fluorescence in situ hybridization (FISH) may assist with the classification of cutaneous CD30-positive T-cell lymphoproliferative disorders in the context of histology, immunophenotype, and clinical information.
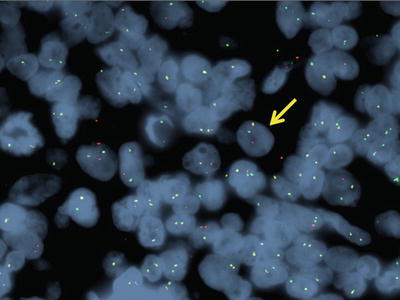
Figure 43.2
Interphase fluorescence in situ hybridization (FISH) image demonstrating rearrangement of the IRF4 locus with an IRF4 break-apart probe. The yellow arrow points to a cell with an IRF4 rearrangement with one overlapping green and red fusion signal (indicating a normal unrearranged IRF4 locus) and separate red and green signals (indicating an abnormal rearranged IRF4 locus) (Image provided by Andrew Feldman, Mayo Clinic.)
Detection of certain viruses can assist with the subclassification of mature T- and NK-cell neoplasms. Epstein-Barr virus (EBV) is strongly associated with aggressive NK-cell leukemia, EBV-positive T-cell lymphoproliferative disorders of childhood, nasal-type extranodal NK/TCL, and angioimmunoblastic TCL [2]. In situ hybridization (ISH) for EBV-encoded RNA (EBER) is the preferred method of testing paraffin-embedded tissue sections. In addition, the retrovirus human T-cell lymphotropic virus type 1 (HTLV-1) is involved in the pathogenesis of adult T-cell leukemia/lymphoma (ATLL) [17], and demonstration of HTLV-1 infection in ATLL cases is performed by HTLV-1 serology and PCR [18].
Available Assays
Clonality assessment is broadly available to assist in the classification of suspected lymphoproliferative disorders. Likewise, other molecular methods are available for the detection of chromosomal abnormalities and viral sequences associated with mature TCL and NK-cell lymphomas.
PCR-Based Clonality Assessment
Clonality assessment is much more frequently performed by PCR methods in clinical practice than by Southern blot analysis. Advantages of PCR-based assays include good sensitivity, short turnaround time, minimal quantity of required DNA, and the ability to utilize partially degraded DNA such as that derived from formalin-fixed, paraffin-embedded (FFPE) tissues. In addition, genomic DNA from fresh or frozen tissues, blood, BM, or body fluids can be used for assessment of T-cell clonality.
PCR-Based Clonality Assessment Using TRG
The majority of laboratories that perform PCR-based assessment of T-cell clonality examine the TRG locus. The TRG contains nine commonly rearranged V segments, which are further grouped into four V gene families based on sequence homology, and 5 J segments [19, 20]. The TRG locus is less complex than the TRB locus, making primer design to detect all rearrangements simpler. Because the TRG locus is rearranged prior to TRB, clonal rearrangements involving TRG can be detected in both αβ and γδ T cells.
Multiple approaches are used for PCR primer design for the detection of TRG rearrangements. Consensus V and J segment primers can amplify the majority of TRG rearrangements observed in lymphoid cells [21, 22]. Alternatively, primers directed against the four Vγ families coupled with a group of J-region primers can be multiplexed [3, 23, 24], which is currently the most common primer design for PCR-based detection of TRG rearrangements. Even with this common approach, significant differences in the assays used by different laboratories affect assay interpretation and performance. After PCR amplification, the products can be visualized by methods including capillary electrophoresis, heteroduplex analysis, or denaturing gradient gel electrophoresis. Examples of two different PCR-based TRG assays using capillary electrophoresis are shown in Fig. 43.3.
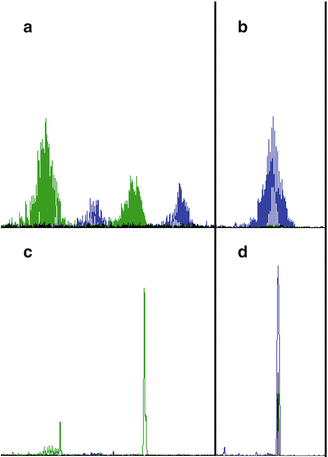
Figure 43.3
Examples of capillary electropherograms for PCR-based analysis of the TRG locus with two different primer sets. The assays show polyclonal results for a normal lymph node specimen (a, b) and clonal results for a T-cell neoplasm (c, d), using two different methods. The assay depicted in panels (a) and (c) is based on the BIOMED-2 Concerted Action, and the resulting PCR products are distributed among multiple size ranges. This assay uses two multiplex reactions, and the results from one multiplex reaction are shown. In contrast, the assay depicted in (b) and (d) uses a single multiplex reaction and results in PCR products distributed within a single size range. The T-cell neoplasm specimen was derived from a patient with mycosis fungoides, and multiple lesions from this patient demonstrated a dominant peak at the size shown. Note that for illustrative purposes, the vertical axes have been rescaled; the dominant clonal peaks in (c) and (d) are actually tenfold higher than the peak of the corresponding Gaussian distribution in (a) and (b), respectively
PCR-Based Clonality Assessment Using TRB
Although it is less commonly examined for PCR-based assessment of T-cell clonality than TRG, the TRB locus may be assessed as an adjunct or alternative to TRG. The TRB locus is significantly more complex than the TRG locus, containing approximately 65 V segments, two D segments, and 13 J segments [25]. The most common primer set used for analysis of TRB was developed by the BIOMED-2 study [3] and contains 23 Vβ, two Dβ, and 13 Jβ primers divided among three reaction tubes. The resulting PCR products are examined by capillary electrophoresis or heteroduplex analysis to detect the majority of TRB rearrangements.
Southern Blot Analysis Clonality Assessment
Although it is much less frequently performed than the PCR-based assays described above, Southern blot analysis can be a valuable tool for diagnostically challenging lymphoproliferative cases when sufficient fresh or frozen tissue is available. In general, Southern blot analysis of TR loci has better inter-observer agreement and fewer issues with false-positive results than PCR-based analysis. However, most biopsies for suspected lymphoproliferative disorders are small and preserved as FFPE blocks, and thus yield neither sufficient quantity nor quality of DNA for Southern blot analysis. In addition, Southern blot analysis is both time consuming and technically demanding.
Southern blot analysis for T-cell clonality most commonly examines the TRB locus. Although Southern blot analysis detects a clonal rearrangement in > 90 % of T-cell neoplasms, it is generally unable to detect a clonal rearrangement in NK-cell or γδ T-cell neoplasms. Southern blot analysis of the TRB locus uses a probe directed against the TRB constant regions (Cβ) or probes directed against one or both of the TRB J segments (Jβ1 and Jβ2) [26]. An example of a TRB Southern blot is shown in Fig. 43.4. Even though numerous rearrangements derived from T lymphocytes are present in a lane, only the clonal rearrangement reaches the detection level.
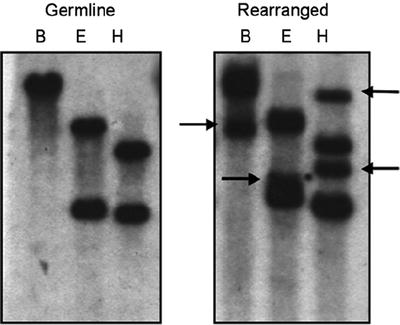
Figure 43.4
Example of a TRB Southern blot. Three restriction enzymes (B, BamHI; E, EcoRII; H, HindIII) were used to digest genomic DNA from germline (left panel) and TCL (right panel) specimens. The lymphoma specimen demonstrates one or two additional rearrangements (arrows) compared to the germline specimen with all three restriction enzymes
Guidelines suggest using at least three different restriction enzymes for digestion of the genomic DNA [27]. The presence of up to two non-germline bands in at least two of the three digests is considered definitive evidence of a clonal rearrangement. One or two non-germline bands in only one of the three digests may represent a clonally rearranged allele or a benign germline polymorphism, and performing digestion with an additional restriction endonuclease may assist in distinguishing between these possibilities. Only two of the three digests are required to demonstrate non-germline bands because one of the digests may have a rearrangement that is a similar size to and obscured by the germline band. The allowance for up to two rearranged bands per digest accounts for rearrangement of both TRB alleles or for the creation of a new restriction site in the rearranged allele within the probe region. The presence of more than two non-germline bands may indicate oligoclonality or a chromosomal abnormality, but incomplete digestion of genomic DNA or germline polymorphisms also may lead to multiple rearranged bands and must be excluded.
Detection of Chromosomal Abnormalities
Reverse transcription PCR (RT-PCR) and real-time quantitative PCR (RT-qPCR) can be used for the detection or detection and quantitation, respectively, of fusion transcripts such as NPM1–ALK found in the majority of cases of ALK-positive ALCL. NPM1–ALK and other fusion transcripts involving ALK result in the expression of the ALK protein, which is not normally expressed in lymphocytes. ALK expression is a favorable prognostic marker, and patients with ALK-positive ALCL have improved overall survival compared to patients with ALK-negative ALCL [28, 29]. This association appears to be independent of the translocation partner [30]. Furthermore, up to 25 % of ALK-positive ALCL cases involve translocation partners other than NPM1, and some NPM1–ALK translocations will not be detected by RT-PCR. For these and other reasons, ALK immunohistochemistry is the most widely used test for examining ALK expression in ALCL (Fig. 43.5). RT-PCR and RT-qPCR for NPM1–ALK may provide prognostic information or allow MRD monitoring in select patients with ALK-positive ALCL and the NPM1–ALK fusion [31]. These sensitive methods should be used with caution in diagnostic situations because low levels of NPM1–ALK fusion transcripts have been reported in ALK-negative ALCL, Hodgkin lymphoma, reactive tissue, and even peripheral blood from healthy individuals [32, 33].
Figure 43.5
Immunohistochemistry demonstrating nuclear and cytoplasmic ALK staining in an ALK-positive anaplastic large cell lymphoma secondarily involving the skin
FISH on fresh or FFPE tissues also can be used to detect NPM1–ALK fusions and other ALK rearrangements, and FISH for ALK rearrangements correlates well with ALK immunohistochemistry [34]. Likewise, FISH can be performed for other structural and numeric chromosomal abnormalities, but FISH testing for mature T- and NK-cell lymphomas is offered in only a few clinical laboratories.
Detection of Viral Sequences Associated with T-Cell Lymphomas
ISH is commonly used for the detection and localization of EBV in tumor cells of the various EBV-positive mature T- and NK-cell neoplasms, especially nasal-type extranodal NK/T-cell lymphoma. ISH can be performed on FFPE tissue sections and identifies EBV RNA within the nuclei of virtually all tumor cells. EBER RNA is most commonly targeted due to the very high copy number in EBV-infected tumor cells. PCR detection of EBV in lymphoid tissue specimens is less useful because the vast majority of adults have been infected with EBV and the assay may detect latently infected background B cells that are not associated with the tumor.
The diagnosis of ATLL involves the demonstration of HTLV-1 infection. This may be performed by HTLV-1 serology or PCR.
Interpretation of PCR-Based T-Cell Clonality Assays
Interpretation of PCR-based T-cell clonality assays is a challenging and commonly debated area of molecular pathology. Interpretation is dependent on assay design and the method used to evaluate the PCR products. Different interpretive criteria are required depending on assay design [35]. Key features of assay design that influence choice of interpretive criteria include primer selection, multiplexing strategy, use of one or multiple different fluorescently labeled primers, and whether the resulting PCR products result in a single or multiple Gaussian regions. In gel-based assays, interpretation as a clonal rearrangement is based on the finding of a discrete band of an appropriate size in contrast to a smear or ladder of bands derived from polyclonal T cells. With capillary electrophoresis-based assays, a wide variety of interpretive criteria is used, and each laboratory must establish and validate its own criteria for a positive result while considering the many issues described in this section. Commonly applied interpretive criteria for the detection of a clonal T-cell rearrangement include observing a reproducible peak above baseline or establishing a cutoff ratio based on the height of the peak in question relative to that of the polyclonal background [3, 36–38]. Computer-aided algorithms also are used to identify peaks that deviate from the normal distribution curve [39]. Less-stringent criteria can be applied with capillary electrophoresis in follow-up specimens when the size of the expected clonal PCR product is known from prior testing.
Oligoclonal proliferations should be differentiated from monoclonal proliferations. The number of bands on a gel or prominent peaks on a capillary electrophoresis tracing necessary to define an oligoclonal vs monoclonal proliferation depends on the assay design and locus examined. In general, the presence of more than two bands or prominent peaks is considered compatible with an oligoclonal proliferation when examining the TRG locus.
Stay updated, free articles. Join our Telegram channel

Full access? Get Clinical Tree


