Figure 59.1
Roche 454 GS FLX sequencing. Template DNA is fragmented, end repaired, ligated to adapters, and clonally amplified by emulsion PCR. After amplification, the beads are deposited into picotiter-plate wells with sequencing enzymes. The picotiter plate functions as a flow cell where iterative pyrosequencing is performed. A nucleotide-incorporation event results in pyrophosphate (PPi) release and luminescence localized to the plate wells. APS adenosine 5′-phosphosulfate. From Karl V. Voelkerding, Shale A. Dames, and Jacob D. Durtschi. Next-Generation Sequencing: From Basic Research to Diagnostics. Clinical Chemistry 2009; v. 55, p. 641–658. Reproduced with permission from the American Association for Clinical Chemistry
Once generated, the overlapping fragment library is subjected to a clonal amplification step using emulsion PCR (ePCR). Under limiting dilution concentrations, the library is denatured and hybridized to individual beads whose surfaces contain capture oligonucleotides with sequences complementary to the adapter oligonucleotides. The beads are then mixed with PCR buffer components and biotinylated primers in conjunction with oil and surfactant under limiting dilution conditions to create individual water-in-oil microvesicles containing single beads with hybridized library fragments. The emulsion is subjected to PCR during which clonal expansion of single DNA molecules bound to individual beads occurs. After amplification, the emulsion is disrupted, and beads containing clonally amplified template DNA are enriched by a streptavidin hybridization step, removing the majority of beads without clonal amplicons.
The 454 technology introduced the concept of sequencing clonal amplicons in a flow cell. Specifically, the 454 flow cell is referred to as a “picotiter” plate and is made from a fused fiber-optic bundle into which millions of individual wells are etched into the surface. Beads containing clonal amplicons are deposited into individual picotiter wells that contain enzymatic components for pyrosequencing with luminescence signal generation. When loaded into the GS FLX instrument, the picotiter plate functions as a flow cell wherein iterative pyrosequencing is performed by successive microfluidic addition of polymerase and dNTPS (i.e., A followed by C, then G, then T, etc.). A nucleotide-incorporation event in a well containing a clonally amplified template results in pyrophosphate release, and the luminescence generated in the well is transmitted through the fiber-optic picotiter plate and recorded by a charge-coupled device (CCD) camera. With each dNTP reagent flow, wells are imaged and analyzed for signal-to-noise parameters. The collected data is algorithmically translated into a linear sequence output. One of the recognized strengths of the 454 technology is the progressive increase in sequencing read lengths that have been achieved, beginning with 100 base length reads on the GS-20 that have now been extended up to 1,000 bases.
In 2006, the second NGS technology, termed Solexa, was introduced onto the market. Review of this technology is essential as it is now the dominant NGS method [2]. In 1997, Shankar Balasubramanian and David Klenerman conceived of an approach to sequence single DNA molecules attached to microspheres, and in 1998 they founded Solexa. The goal of sequencing single DNA molecules was not achieved, and Solexa elected to pursue sequencing of clonally amplified templates. By 2006, the Solexa Genome Analyzer was commercialized and Illumina acquired Solexa.
The Genome Analyzer utilized a flow cell comprised of an optically transparent slide with eight individual microfluidic lanes on which oligonucleotide anchors are bound to the slide surface. As with the 454 method, genomic template DNA first is converted into a randomly overlapping fragment library using either Covaris fragmentation followed by enzymatic end repair and Illumina adapter ligation, or via Nextera transposition (described below). As shown in Fig. 59.2, the fragment library is denatured and, under limiting dilution conditions, is added to the flow cell and immobilized by hybridization to the oligonucleotide anchors. In contrast to ePCR, DNA templates are amplified by an isothermal “bridge” amplification method mediated by formamide denaturation that relies upon captured DNA strands “arching” over and hybridizing to an adjacent anchor oligonucleotide. Multiple amplification cycles result in conversion of single-molecule DNA templates to clonally amplified arching clusters with each cluster containing approximately 1,000 clonal DNA molecules. For sequencing, clusters are denatured, and then a chemical cleavage reaction and wash are conducted, leaving only forward strands for single end sequencing. Sequencing of the forward strands is initiated by hybridizing a primer complementary to adapter sequences followed by addition of polymerase and a mixture of four uniquely labeled, fluorescent “reversible” chain terminating nucleotides. The dye-labeled nucleotides are incorporated according to sequence complementarity in each strand in a clonal cluster. After incorporation, excess reagents are washed away, the clusters are optically interrogated, and fluorescence is recorded. With subsequent chemical steps, the chain termination moiety and fluorescent labels are removed and washed away, allowing for a next sequencing cycle to be performed. Initial read lengths with Solexa/Illumina were 36 bases but are currently 300 bases. In addition, Illumina developed a “turnaround chemistry” that allows sequencing of clonal clusters in the opposite strand direction, resulting in bi-directional sequencing of templates.
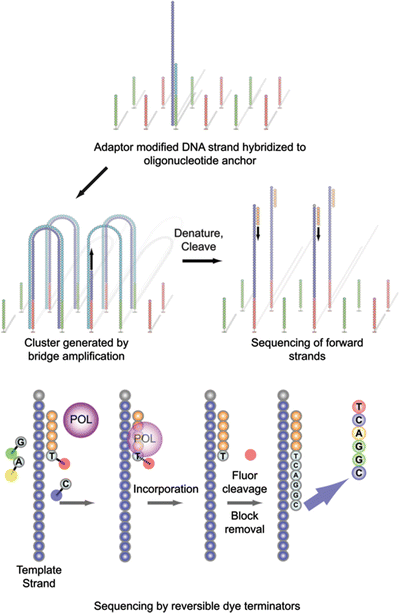
Figure 59.2
Cluster generation and sequencing on the Illumina platform. Denatured, adapter-modified DNA library fragments are hybridized, under limiting dilution concentrations, to complementary oligonucleotide anchors immobilized on the flow cell surface. Bridge amplification generates clonal clusters, which are subsequently cleaved to form single strands. Sequencing primer is annealed, and four uniquely fluorophore-labeled reversible dye terminators and polymerase (POL) are added during each sequencing cycle. Prior to initiation of the next sequencing cycle, the fluorescence signal of the incorporated base is optically recorded, and the fluorophore and termination block is cleaved and washed away. Sequencing is progressive and cyclical, and the read length is dependent on the number of sequencing cycles. From Karl V. Voelkerding, Shale A. Dames, and Jacob D. Durtschi. Next-Generation Sequencing: From Basic Research to Diagnostics. Clinical Chemistry 2009; v. 55, p. 641–658. Reproduced with permission from the American Association for Clinical Chemistry
Recently, Illumina acquired an alternative library preparation method termed Nextera (developed by Epicentre, Madison, Wisconsin) [3]. This approach fragments DNA and introduces adapter sequences in a process termed “tagmentation.” A transposase enzyme is complexed with a transposon, which is modified to contain Illumina-specific adapter sequences. DNA is fragmented to a desired size distribution by optimization of the enzyme concentration and incubation time, and then adapter sequences are inserted at the cut site. The Illumina adapter-tagged fragments are then PCR amplified with tailed primers containing sequences for annealing on the Illumina flow cell, sequencing, and optional indexing (or barcoding) to uniquely label all fragments of each library. Indexing multiple libraries allows for pooling to leverage instrument capacity and reduce per sample costs. Most library preparation methods currently require an input of one to several micrograms of genomic DNA, whereas the Nextera technology requires only 50 nanograms of input genomic DNA, which is a sufficient quantity to assure adequate library complexity.
The introduction of the 454/Roche and Solexa/Illumina technologies began a paradigm shift in the biomedical research community. Many complex genomic studies that were previously either cost prohibitive or not technically feasible by the Sanger sequencing were now possible using NGS. Additional NGS technologies were subsequently commercialized including clonal amplicon-based sequencing by ligation (SOLiD/Life Technologies) and fluorescence-based single-molecule sequencing methods introduced by Helicos and Pacific Biosciences. As of this writing, several NGS technologies that were commercialized are either being phased out (454/Roche) or have been abandoned (SOLiD and Helicos), primarily due to insufficient market share. The research community has continued to use the Pacific Biosciences platform due to its ability to generate several thousand base length reads, a feature that has gained traction in the microbial genome sequencing community. However, a relatively high sequence read error rate (~10 %) and an approximate $750,000 platform cost have thus far precluded its entry into clinical use. In 2014, the first single-molecule sequencing technology utilizing engineered protein nanopores was introduced by Oxford Nanopore Technologies. The nanopores are embedded in a membrane in a buffer with an applied electrical field. As strands of DNA pass through the nanopore, they cause a nucleotide base-dependent change in current which is registered and algorithmically converted to sequence. In its first commercial iteration, the Oxford Nanopore platform is handheld in size (MinION), and its first applications have been focused on microbial genome sequencing. The sequence read lengths are on the order of several thousand bases; however, they display substantial error rates (>5 %). At present, considerable effort is ongoing to develop bioinformatic algorithms capable of processing and analyzing sequencing reads generated by the MinION. For more detail on Pacific Biosciences and Oxford Nanopore, the reader is referred to other reviews describing these methods [4–6].
The most recently commercialized and clinically adopted NGS technology, termed Ion Torrent Thermo Fisher Scientific (Waltham, MA) (launched in 2011), also was developed by Jonathan Rothberg (founder of 454) [7]. The sample preparative workflow is quite similar to the 454 technology in that template DNA is converted to an overlapping fragment library and clonally amplified on beads. The flow cell is a chip manufactured from semiconductor material with a high-density micron-scale well pattern etched into its surface. Underlying the well layer is a proprietary ion-sensing technology comprised of a sensing layer and a pattern of photolithographic generated transistors and circuits that can monitor ionic changes in individual wells. Sequencing of clonally amplified library fragments is conducted by an iterative, sequential flow introduction of the four natural nucleotides and polymerase. In contrast to measuring pyrophosphate release, hydrogen ion liberated during nucleotide incorporation and phosphodiester bond formation is registered by the ion sensing mechanism. If three identical adjacent bases on a template are being sequenced (e.g., a TTT homopolymer), the approximate tripling of hydrogen ion liberated generates an approximately tripled ion signal and is interpreted as a three-identical-base incorporation. Currently, the Ion Torrent technology is capable of generating 400 base length reads. In comparison to 454 and Illumina, sequencing speeds are significantly faster with Ion Torrent because there is no requirement for generating luminescence or monitoring fluorescence with subsequent chemical reversal of chain termination. Table 59.1 shows a comparison of 454, Illumina, and Ion Torrent platforms including chemistry, current read lengths, error propensity, and error rates. For additional comparative details, the reader is referred to recent reviews [5, 8–10]. Next discussed are fundamentals of NGS bioinformatics.
Table 59.1
NGS platforms and specifications
Platform | Template preparation | Chemistry | Read length a | Run time b | Throughput c | Primary errors | Error rates d |
|---|---|---|---|---|---|---|---|
Roche 454 | |||||||
GS Junior | ePCR | Pyrosequencing | 400 | 10 h | 35 Mb | Indel | ~1 |
GS FLX+ | ePCR | Pyrosequencing | 700–1,000 | 23 h | 700 Mb | Indel | ~1 |
Illumina | |||||||
MiSeq | Bridge amplification | Reversible dye terminators | 36–250 | 4–40 h | 600 Mb–8 Gb | Substitution | ~0.5–1 |
HiSeq 2000 | Bridge amplification | Reversible dye terminators | 100 | 11 days | 600 Gb | Substitution | ~0.5–1 |
HiSeq2500 Rapid Run Mode | Bridge amplification | Reversible dye terminators | 150 | 27 h | 120 Gb | Substitution | ~0.5–1 |
Ion Torrent | |||||||
PGM | ePCR | Hydrogen ion sensing | 100–200 | 2.5–4.5 h | 500 Mb–1 Gb | Indel | ~0.5–2 |
Proton | ePCR | Hydrogen ion sensing | 200 | ~4+ h | Up to 10 Gb | Indel | ~0.5–2 |
Bioinformatics and Data Analysis
Sequence Reads and Base Quality Scores
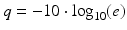
For the 454 and Illumina methods, NGS raw data is comprised of luminescent or fluorescent images, respectively, recorded after each iterative sequencing step. Each platform has its own algorithm for image processing, image compilation, signal-to-noise ratio assessment, and conversion into linear sequence. Nucleotide bases are assigned individual “quality” scores which share a conceptual analogy to Phred scores introduced in 1998 for estimating accuracy and quality of the Sanger sequence data [11, 12]. A Phred score provides quality values, q, using a mathematical scale converting the estimated probability of an incorrect call, e, to a log scale:
Miscall probabilities of 0.1 (10 %), 0.01 (1 %), and 0.001 (0.1 %) yield increasing confidence Phred scores of 10, 20, and 30, respectively. Factors that contribute to lower quality bases in NGS include nonoptimal signal-to-background noise levels, cross talk between signals from adjacent beads or clusters, and a phenomenon termed dephasing due to unequal extension of individual reads in a clonal cluster or on a bead surface [13]. The signal output from Ion Torrent is a change in pH, and obtaining optimal signal-to-background pH ratios requires careful control of reagent pH. As with the 454 and Illumina methods, Ion Torrent signals are converted to linear sequence with quality scores assigned to individual bases. While each platform has a unique signal-to-sequence processing algorithm, instrument-specific sequence files are convertible to a common text-based file format termed FASTQ that contains sequence reads and individual base quality scores.
Sequence Mapping, Alignment, and Variant Calling
FASTQ-formatted sequence reads are used for two major computational purposes: assembly and alignment. Assemblies are performed when no reference genome exists for the sequenced DNA, an example being a previously uncharacterized pathogen. Assembly algorithms search for overlapping sections of sequence reads and join them together to generate longer length “contigs” that serve as a scaffold for genome assembly and subsequent alignments. To achieve more complete assemblies, longer sequence read lengths and sequencing from both ends of library fragments (termed paired-end read sequencing) are desirable. For most clinical applications, however, reference genomes exist (e.g., the human genome reference or a previously sequenced pathogen), and the primary computation is alignment of reads to the reference sequence. The unique features of NGS, notably shorter read lengths and massive read numbers, have spurred the development of many new alignment, variant calling, and annotation algorithms. While the reader is referred to a recent review on the topic of NGS bioinformatics [14] for greater details, major process steps are described next (shown in Fig. 59.3).
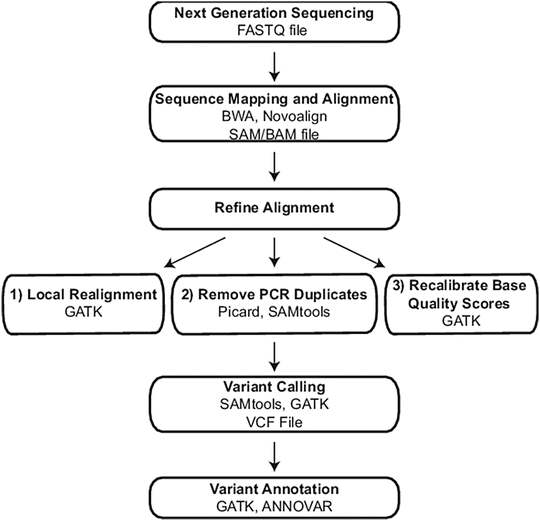
Figure 59.3
Exome and genome bioinformatic processing steps. Sequential steps required to generate an annotated variant list from exome and genome raw sequencing data are indicated in bold. For each step, programs used in the authors’ laboratory are listed along with the file type that is generated, where applicable. BWA Burrows-Wheeler Aligner, GATK Genome Analysis Toolkit, VCF Variant Call Format. Reprinted from Coonrod EM et al. (2013). Developing Genome and Exome Sequencing for Candidate Gene Identification in Inherited Disorders. Arch Pathol Lab Med. Volume 137(3): 415–433 with permission from Archives of Pathology & Laboratory Medicine. Copyright 2013. College of American Pathologists
Alignment is the process of determining the best match between the sequencing reads and the reference sequence. Due to the large number of sequence reads that must be processed, NGS alignment algorithms typically employ one of two approaches to decrease computational time, and these include a data compression method referred to as a Burrows-Wheeler Transform (BWT) and a method based on the concept of a hash table. The BWT approach is integral to the popular open-source Burrows-Wheeler Aligner (BWA) algorithm that has become a standard for sequence alignment [15–17]. For hash table-based alignment, a first step is conversion of the reference sequence or the sequence reads into a population of shorter length sequences (termed an index), in which each sequence is given a read identifier that can be computationally tracked. By using indexes of shorter length (referred to as “seeds”), alignments proceed more rapidly [14]. An example of a popular aligner that utilizes a hash table function to create an index from the reference genome is NovoAlign (Novacraft, Selangor, Malaysia) [18]. For both BWT and hash table-based aligners, key criteria for initial mapping and alignment are established, including the number of nucleotide mismatches permitted across a given read or seed length and whether gaps in alignment are allowed to accommodate insertions and deletions (indels). With initial criteria applied, a first mapped and aligned read data set is generated. This data set is known to contain inaccuracies, and therefore additional algorithms are used to yield a more refined and accurate final set of alignments as described below.
Most alignment algorithms can provide results in a sequence alignment/map (SAM) file format, which contains information about read position and orientation in relationship to the reference sequence and confidence in the alignment. A binary version of SAM is the BAM format, and the SAM/BAM formats are the most commonly used file formats for storing and secondary manipulation of read alignments. After initial alignment, SAM/BAM files are used as inputs into secondary algorithms that refine and increase alignment accuracy prior to identifying differences between the sequencing reads and the reference sequence, a process referred to as variant calling. Popular open-source software for refining alignments and calling variants are the Genome Analysis Toolkit (GATK) [19] and SAMtools [20]. Algorithms within the GATK program are the most widely used for refining Illumina reads. Three major refinement steps are (1) marking and removal of reads with the same start and end points, referred to as PCR duplicates; (2) local realignment to improve accuracy in identifying indels; and (3) recalibration of base quality scores. PCR duplicates arise from sequencing identical fragments generated by PCR during library preparation. PCR nucleotide errors can be introduced and propagated through unequal amplification of fragment library templates, and these errors can manifest as false-positive variants. During removal of PCR duplicates, only a single read with overall highest base qualities is retained for analysis. The purpose of recalibrating base quality scores is to compensate for the fact that the Phred-like quality scores generated by the Illumina platform have been demonstrated to deviate from the true error rate. Figure 59.4 shows an example of how local realignment improved the accuracy of detecting a 3 bp deletion in the FOXP3 gene. The mapped and aligned reads are visualized in the open-source Integrative Genomics Viewer (IGV) [21, 22]. Subsequent to initial and refined alignment steps, variants are called and tabulated in the Variant Call Format (VCF) File that contains variant chromosomal position, reference base, and the alternate base(s) (e.g., single-nucleotide variant (SNV), indel).
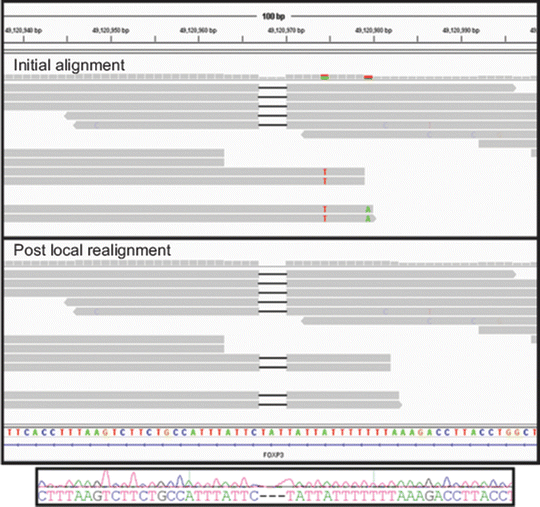
Figure 59.4
Generating refined alignments. Local realignment of an indel from a genome sequenced on the Illumina HiSeq 2000 and visualized in the Integrative Genomics Viewer is shown. The upper panel shows results from initial mapping and alignment of reads with an apparent 3 base pairs (bp) deletion in the FOXP3 gene on the X chromosome of a male. In the upper panel, four reads contain the deletion (depicted by black bars within the read) and four reads do not contain the deletion. In the four reads that do not contain the deletion, six flanking single-nucleotide variants (SNVs) are present (T variant in red and A variant in green). The initial alignment suggests heterozygosity for the deletion on the X chromosome, but this is unlikely given that the sequence reads are derived from a male. The lower panel shows results after local realignment in which all reads contain the 3 bp deletion. In addition, flanking, false-positive SNVs are no longer present. The Sanger sequencing trace shown below confirms the deletion and zygosity of the g.49120967_49120971delTAT deletion. Reprinted from Coonrod EM et al. (2013). Developing Genome and Exome Sequencing for Candidate Gene Identification in Inherited Disorders. Arch Pathol Lab Med. Volume 137(3): 415–433 with permission from Archives of Pathology & Laboratory Medicine. Copyright 2013. College of American Pathologists
Coverage and Variant Calling
By virtue of NGS libraries being comprised of randomly overlapping fragments, multiple reads align to the reference in a staggered fashion. This multiplicity provides quantitative information reflected in the number of reads aligned to the reference sequence at a given location and is designated as read coverage depth. Another feature of randomly fragmented libraries is that fragments are sequenced in both directions to yield forward and reverse strand sequences, and ideally their percentages should be approximately equal. If a variant is present, then the percentage of reads that contain the variant can be expressed as an “allelic read percentage,” and the number of forward and reverse sequence strands containing the variant can be enumerated. Figure 59.5 shows a representative example of a heterozygous SNV and illustrates the concepts of coverage and allelic read percentage. Several points and caveats are important when considering coverage and variant calling. First, greater variant calling accuracy is achieved when there is a consensus among aligned reads that agrees with predictions for the variant. For example, a sample with a heterozygous SNV would ideally display a 50/50 ratio of reads containing variant and reference nucleotides, and forward and reverse strand reads would be equivalently represented in both variant- and reference-containing reads. By extension, a homozygous variant would be expected to be present in 100 % of aligned sequences with equal representation of forward and reverse strands. In practice, a wider range of allelic read percentages for true heterozygous and homozygous variants is observed. Further, forward and reverse strand read percentages divergent from expected are commonly seen (referred to as “read strand bias”). These read strand biases arise from technical and bioinformatic sources including differential PCR amplification of library fragments, sequencing errors in difficult-to-sequence regions, and misalignment of related sequences (e.g., pseudogenes or highly homologous genes).
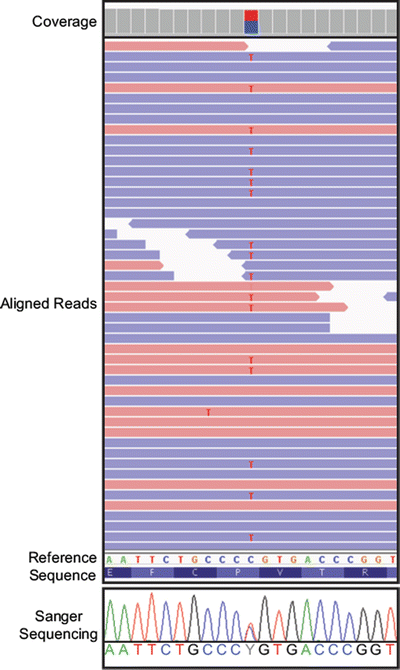
Figure 59.5
Example view of mapped and aligned Illumina reads in a genome browser. A screenshot of the ZRSR2 gene from the Integrative Genomics Viewer is shown. Relative height of the gray boxes at the top indicates read coverage depth (Coverage). Mapped and aligned reads in the forward direction are shaded red, while reads aligning in the reverse direction are shaded blue (Aligned Reads). Variants from the reference are highlighted by a unique color. Forty-nine of 245 reads from exome sequence generated using the NimbleGen SeqCap in-solution exome capture and run on the Illumina HiSeq 2000 are shown. A cytosine to thymine (C>T) variant change is present with the T variant highlighted in red in the aligned reads. The heterozygous change also is indicated in the coverage portion of the viewer, and in this case because the variant is a heterozygote, the box is split into two colors, red for the variant nucleotide (T) and blue for the reference nucleotide (C). This T variant is present in 46 % of reads, while the other 54 % of reads contain a C at this position. The T variant is present in both forward and reverse reads. The reference nucleotide sequence (Reference Sequence) is shown below the aligned reads along with the amino acid translation of the sequence. This region was sequenced by the Sanger sequencing to confirm the heterozygous (C>T) variant. The trace from this sequence is shown at the bottom (Sanger Sequencing)
Second, the minimum number of reads required to call a variant has not been standardized and varies depending on application needs and sequencing platform accuracy (i.e., lower sequencing error rates require fewer reads to accurately establish a variant call). In the 1000 Genomes Project [23], coverage as low as four- to six-fold has been used in a large-scale screening mode, whereas in other research studies 20- to 30-fold coverage has been empirically found to offer a balance between sensitivity, specificity, and sequencing costs for detection of constitutional variants [24–26]. By extension, clinical laboratories are typically requiring a minimum of 20- to 30-fold coverage for the detection of constitutional variants and are often designing diagnostic assays so that much higher coverages are routinely obtained in an effort to increase variant detection and improve variant call confidence.
Third, coverage depth across sequenced regions is variable, and factors that contribute to this are differential ligation of adapters to fragments during library preparation and differential amplification during clonal expansion [27]. NGS assays can be designed to achieve sufficient sequencing to meet clinically necessary minimum coverage for areas prone to lower coverage.
Fourth, whereas the above noted 50/50 and 100 % ratios are pertinent to identifying constitutional heterozygous and homozygous variants, respectively, they do not apply when identifying somatic variants in cancer samples comprised of a mixture of tumor and normal cell populations (where allelic read percentages for true somatic variants of interest can be quite low), as well as for tumor heterogeneity in which not all tumor cells have acquired the same variants. To identify low allelic read percentage somatic variants, increased read coverage in the several hundred- up to thousand-fold range are being applied empirically for clinical testing [28, 29]. In sum, multiple variables ultimately need to be considered in variant calling, and more sophisticated algorithms are beginning to emerge for the detection of variants in both constitutional and somatic testing applications. For example, the open-source GATK program factors in coverage depth, read bias, recalibrated base quality scores, and variant prior and posterior probabilities based on comparison to control samples. In combination, these factors are used by GATK to generate statistical measures that predict variant accuracy and generate a “refined” VCF file.
Annotation
A final step is to input the VCF file information into an “annotation” program that ascribes additional features to variants. Open-source software that contain annotation functions are ANNOVAR [30, 31], GATK, and snpEff [32], among others. Annotation outputs can include many features, but those that are common are chromosomal location of base change from reference, whether the variant is in a gene and its respective location (e.g., exon, intron, splice site), the consequence of the change to a codon (e.g., synonymous vs nonsynonymous, missense vs frameshift), and zygosity (e.g., homozygous or heterozygous). Often incorporated into annotation software programs are algorithms that predict the functional impact of variants on proteins such as Sorting Intolerant from Tolerant (SIFT) [33, 34], PolyPhen-2 [35], and MutationTaster [36, 37].
Clinical Applications
The impact of NGS on biomedical research has been transformative. Similarly, the ongoing translation of NGS into the clinical laboratory represents a significant shift. In this section, two major clinical applications of NGS are discussed: (1) disorder- or disease-based multigene panel sequencing, and (2) exome and genome sequencing for candidate and causal gene identification.
Multigene Panel Sequencing via Targeted Enrichment
Investigations into the genetic basis of a growing number of inherited disorders have revealed that a clinical phenotype can be due to multiple causative genes with a broad mutational spectrum. Examples include X-linked mental retardation, mitochondrial disorders (secondary to mutations in both the mitochondrial genome and nuclear genes), congenital hearing loss, cardiomyopathies, and primary immune deficiencies [8, 10, 38–41]. A comprehensive diagnostic approach can require the analysis of a few dozen to over one hundred genes. Similarly, molecular analyses of hematopoietic and solid malignancies continue to identify a growing number of genes relevant to diagnostic stratification, prognosis, and therapeutic response [42–44]. The technical complexity of multiple gene analysis is very challenging with the Sanger sequencing, whereas it can be addressed by targeted enrichment of multiple genes followed by NGS.
In general, enrichment strategies can be categorized as either amplification-based or oligonucleotide-array-capture-based [45, 46]. For amplification-based enrichment, single locus or multiplex PCR remains a mainstay method. Resequencing of exons by targeted PCR enrichment has been demonstrated for a number of genes wherein amplicons are generated from a sample, pooled in equimolar ratios, then ligated to adapter oligonucleotides to generate an NGS library (without overlapping fragments). This approach integrates well with the longer read length technologies (e.g., Roche 454). Another strategy for target enrichment is to use overlapping long-range PCR with 5–10 kilobase amplicons, which are then pooled, fragmented, and converted into a library. Multiple samples can be sequenced together if index or barcode sequences are incorporated into adapter sequences. After sequencing, indexed reads are assigned to their respective sample of origin by bioinformatic algorithms, which is sometimes referred to as “deconvolution” [47–49]. To automate PCR amplification of many targets, a highly parallel PCR microdroplet technology has been commercialized by RainDance Technologies (Lexington, MA) [50, 51]. In this technology, individual primer pairs for targets are designed (for amplicon lengths of 200–600 bp), synthesized, and sequestered in individual, stable, emulsion microdroplets. Up to a few thousand primer pairs can constitute a microdroplet primer population. For targeted amplification, genomic DNA is first fragmented into a size range of 2,000–4,000 bp and then randomly distributed into a separate microdroplet population. On an automated microfluidic platform, individual primer pair and genomic DNA microdroplets are merged by exposure to a voltage potential so that one microdroplet containing fragmented genomic DNA is associated with one microdroplet containing an individual primer pair. The fused microdroplets are collected into a single microfuge tube and thermocycled to achieve highly parallel PCR amplification. After amplification, the droplets are disrupted and the pooled amplification products are converted into a library for NGS. An additional PCR-based enrichment approach, Fluidigm (South San Francisco, CA), commercialized their Access Array platform based on a microfluidic chip that contains nanoliter-scale reaction chambers separated by valves. Forty-eight samples can be loaded onto the chip, and each sample can be distributed into 48 chambers with unique or multiplex primer pairs for subsequent PCR. After amplification, valves are reversed and samples are returned to their original wells and processed for NGS.
Oligonucleotide array capture methods constitute the second major enrichment strategy [52–59]. With array methods, genomic DNA, or genomic DNA converted into an NGS library, is hybridized to oligonucleotides complementary to target regions of interest. After hybridization, the enriched material is eluted from the array and processed for NGS. Originally, capture oligonucleotides were formatted on solid surface arrays, but this approach has been supplanted by in-solution formats offered by Roche NimbleGen (Madison, WI), Agilent (Santa Clara, CA), Illumina, and most recently Integrated DNA Technologies (IDT, Coralville, IA). In-solution oligonucleotide array capture procedures require several hours to days of hybridization depending on methodology, and an important array design consideration is the specificity of capture probes and the potential for co-capture and enrichment of nontarget sequences, notably from closely related genes and pseudogene analogs which can lead to false-positive variants in alignments. The inherent coverage variability in NGS libraries can be compounded by uneven and inadequate capture using in-solution probes, sometimes necessitating oligonucleotide array redesign.
A novel hybrid between capture and amplification approaches termed HaloPlex (Halo Genomics, Uppsala, Sweden and acquired by Agilent Technologies) is being adopted for clinical use. In this method, genomic DNA is digested with different combinations of restriction endonucleases and then hybridized to biotinylated oligonucleotide probes whose right and left sides are complementary to the fragment ends. The probes also contain a sequencing motif and index. Probe hybridization yields a genomic DNA circular structure that is isolated by incubation with magnetic streptavidin beads and then closed by ligation. Ligated circles are amplified by PCR yielding a library ready for sequencing.
Each enrichment method has advantages and disadvantages. For clinical applications, the choice of enrichment technology will depend on target size, content, and laboratory workflow preferences. Array capture is better suited for enrichment of larger target regions up to the scale of the human exome but is prone to co-capture of highly homologous sequences. Although amplification-based strategies are not as scalable, their increased target enrichment specificity may be preferable or required depending on target content. As an example of in-solution array capture data, Fig. 59.6 shows two genes, FOXP3 and HLA–DOB, and their respective capture results. The left panel shows capture probes and coverage of seven exons from the FOXP3 gene located on the X chromosome. The right panel shows capture probes and coverage of two of four exons from the HLA–DOB gene located on chromosome 6. HLA–DOB belongs to a large gene family with highly homologous sequences, making the design of unique capture probes difficult for all exons.
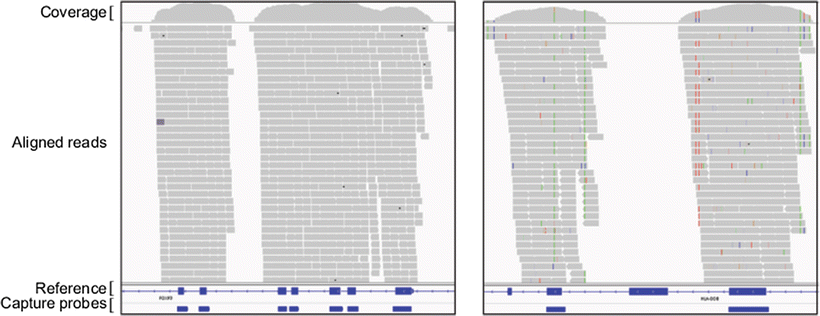
Figure 59.6
Exome read coverage and targeted regions. Paired-end exome sequencing reads are shown for two example genomic loci in the Integrated Genomics Viewer. Boxes along the bottom show the positions of the capture probes for the NimbleGen SeqCap in-solution capture design (Capture Probes). The reference sequence is shown above the capture probes, and exons are represented by blue boxes (Reference). Changes to the reference sequence are shown by vertical multicolored hatch marks throughout the coverage and aligned read regions (Aligned Reads). Left panel shows capture probes and coverage of seven exons from the FOXP3 gene located on the X chromosome. Right panel shows capture probes and coverage of two of four exons from the HLA–DOB gene located on chromosome 6. HLA–DOB belongs to a larger gene family with highly homologous sequences, making the design of unique capture probes difficult. As a result, only two exons shown here contain unique probes, are captured efficiently, and can be aligned to the reference sequence, thus highlighting that problematic genomic regions are not included in capture probe design. Reprinted from Coonrod EM et al. (2013). Developing Genome and Exome Sequencing for Candidate Gene Identification in Inherited Disorders. Arch Pathol Lab Med. Volume 137(3): 415–433 with permission from Archives of Pathology & Laboratory Medicine. Copyright 2013. College of American Pathologists
Currently, the majority of clinical NGS testing is comprised of multigene panels for inherited disorders and oncology applications (discussed further in the Considerations for Clinical Implementation of NGS). The adoption of multigene panels has been greatly facilitated by lower cost platforms, notably the Illumina MiSeq and the Ion Torrent PGM. In parallel, exome sequencing (and to a lesser degree genome sequencing) is being increasingly applied to identify causal and candidate genes in patients with disorders suggestive of a genetic etiology. We next discuss exome and genome sequencing, and the Illumina technology is highlighted as it has been used in the majority of clinical exome and genome publications.
Exome and Genome Sequencing for Candidate and Causal Gene Identification
In the scenario of a suspected inherited disorder, the overarching goal of exome or genome sequencing is to generate a list of variants from which a presumptively rare and pathogenic variant (or variants depending on mode of inheritance) can be identified. The complexity of this goal is reduced if a family with more than one affected member or even a trio of both parents and the affected child can be tested, as this allows segregation analyses of putative pathologic variants to be performed. While complex, the reported success of exome and genome sequencing for identifying candidate and causal genes in patients and families whose disorders strongly suggest a genetic etiology is 25–40 % [60–63]. Technical and bioinformatic considerations are presented before describing how to “search” for candidate genes.
As shown in Fig. 59.7, initial preparatory steps are the same for exome and genome libraries and include genomic DNA fragmentation and conversion of fragments into an oligonucleotide adapter-tagged library. For exome sequencing, in-solution capture with probes complementary to coding regions is performed as described above to yield an exome-enriched library. Several commercial vendors offer in-solution exome capture probe reagents including Agilent which uses RNA probes and Roche NimbleGen and Illumina which use single-stranded DNA oligonucleotide probes. While there is considerable overlap in the performance characteristics of these three approaches, each differs in targeted capture areas and capture probe sequence composition [64–66].
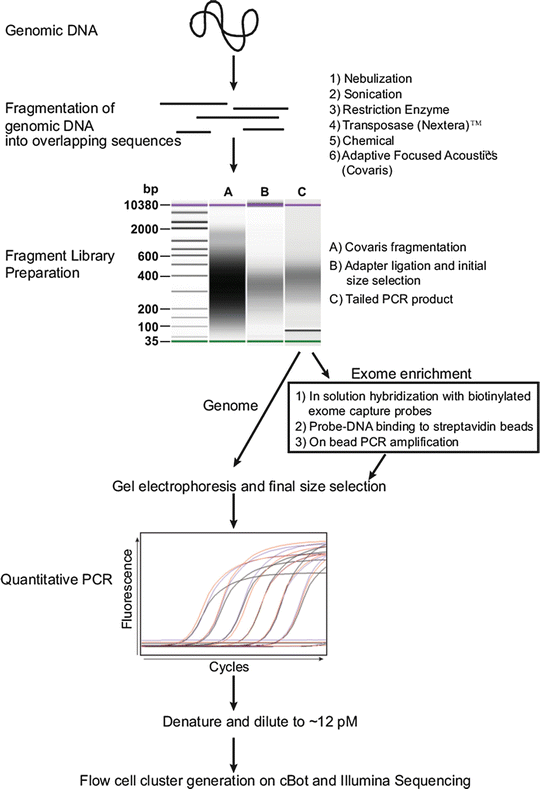
Figure 59.7
Sample preparation for genome and exome sequencing. Workflow diagram for converting genomic DNA into a genome or exome library for sequencing using the Illumina platform is shown. Options (1–6) for fragmenting DNA are shown at top right. Library preparative steps (A–C) as assessed on the Agilent BioAnalyzer are indicated. Steps for exome enrichment after polymerase chain reaction (PCR) amplification of adapter ligated library fragments are boxed. Example quantitative PCR traces are shown. Reprinted from Coonrod EM et al. (2013). Developing Genome and Exome Sequencing for Candidate Gene Identification in Inherited Disorders. Arch Pathol Lab Med. Volume 137(3): 415–433 with permission from Archives of Pathology & Laboratory Medicine. Copyright 2013. College of American Pathologists
Prior to Illumina sequencing, the genome or exome library concentration needs to be determined to guide the preparation of an appropriate dilution for loading onto the flow cell. Quantitative PCR (qPCR) is performed on the library using amplification primers complementary to the adapter oligonucleotide sequences that bind to the flow cell surface capture oligonucleotides. A qPCR standard curve is generated using artificial templates of known concentrations that also contain the same primer target sequences complementary to the flow cell surface capture oligonucleotides. The library concentration is determined by comparing the PCR crossing threshold of the library to those of the standard curve templates. The use of PCR primers complementary to adapter sequences that bind to flow cell surface oligonucleotides specifically assesses the number of library molecules that should form clusters. Based on the library concentration determined by qPCR, a dilution is prepared with the goal of achieving optimal cluster density formation.
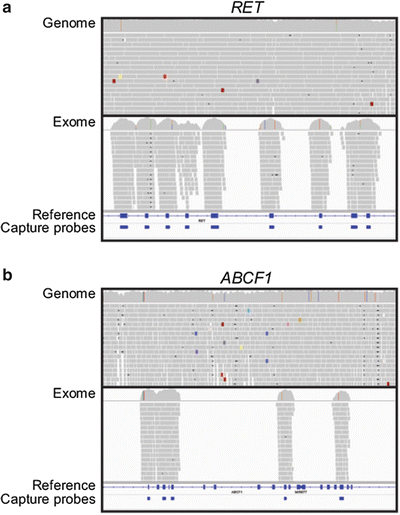
The bioinformatic steps for generating annotated variants from Illumina exome or genome sequencing data are similar to those described above. After sequencing, FASTQ read files are aligned to the human genome reference sequence using BWA followed by refined alignment and variant calling with GATK. Annotation is performed with either GATK or ANNOVAR. The process of alignment and variant calling generates, for a genome, approximately 3–3.5 million positions that differ from the human reference sequence. In comparison, approximately 15,000–30,000 differences from the reference will be observed in the coding regions in a genome or exome data set depending on bioinformatic filtering parameters. Within these ranges, the greatest number of variants from the human genome reference is observed in individuals of African and African-American descent, an intermediate number are observed in individuals of Asian descent, and the fewest variants are observed in Caucasians of European descent. At this time, genome sequencing costs approximately three times more than exome sequencing. Operationally, analyses of either genome or exome data typically focus on coding region variants and variants in close proximity to coding regions because this currently is the most “interpretable” portion of the genome. In considering the use of exome vs genome sequencing, exome sequencing does not provide as comprehensive an analysis of coding regions as genome sequencing. This reflects the difficulty of designing specific capture probes for all coding regions due to the variability of capture efficiency and the presence of cross homologous sequences. Figure 59.8a shows a comparative example of these differences for the RET gene in exome and genome data sets. The genome data shows comprehensive coverage across the gene region, whereas the exome data has sequencing reads only in locations enriched by capture probes. Figure 59.8b illustrates in exome sequencing of the ABCF1 gene that some exon regions do not have probes and therefore are not covered (Fig. 59.8b), while the genome sequencing data is complete across this region. Another technical consideration of exome sequencing that impacts data analysis is that coding regions with high or low GC content are captured less efficiently under single temperature hybridization conditions. This variability of capture was described by Clark et al. [65] and is inherent to all three commercially available exome capture reagents. The effect of GC content is particularly pronounced for the first exon of human genes, which on average have higher GC content. This can lead to reduced coverage of first exons in exome data sets as illustrated for the MAZ gene in Fig. 59.9 where read coverage for exon 1 is greatly reduced compared to other exons although a capture probe is included for this exon. While these limitations exist, exome sequencing is routinely performed at higher coverage depths compared to genome sequencing (due to cost considerations). The increased coverage depth can allow for identification of coding region variants missed in lower coverage genome sequencing data [26, 65].