Change
Gene
Encodes
Location
Function
Tumor Suppressor Genes
NKX3.1
Prostate restricted homeobox protein
8p21.2
Suppresses cell proliferation
PTEN
Phosphatase and tensin homolog
10q23.31
Suppresses cell proliferation and increases apoptosis
CDKN1B
Cyclin-dependent kinase inhibitor p27
12p13.1-p12
Cell cycle inhibitor
TP53
TP53
17p13.1
Many tumor suppressor functions:
• Cell cycle arrest in response to DNA damage
• Senescence in response to telomere dysfunction
• Induction of apoptosis
Oncogenes
MYC
Transcription factor
8p24
Regulates cell proliferation, senescence, apoptosis and cell metabolism
ERG
Proposed new oncogene in prostate cancer
21q22.3
Fusion transcript with androgen-regulated TMPRSS gene found in all stages of prostate cancer
ETV1-ETV4
Proposed new oncogenes in prostate cancer
7p21.3; 19q13.12; 1q21-q23; 17q21.31
Fusion transcripts with androgen-regulated TMPRSS gene found in all stages of prostate cancer
AR
Androgen receptor
Xq11-12
Protein over expressed in most prostate cancers
Other Changes
GSTP1
Glutathione S-transferase pi 1
11q13
Detoxifies carcinogens; inactivated in 90 % of cancers by hypermethylation
Activation of telomerase
Activated via MYC leading to telomere shortening
Telomere dysfunction
Shortening of telomere and chromosomal instability
Multiple genes with hypermethylation of CpG islands
A significant percentage of PCa harbor gene-fusions involving androgen-regulated 5′ gene partners (TMPRSS2, SLC45A3, and NDRG1) and ETS transcription factors (e.g., ETV1 and ERG) [5, 12].
While the implications of the ETS transcription factors as partners in gene fusion events in PCa are not currently understood, the fact that these gene partners are androgen-responsive may play a role in PCa development and progression. Numerous other genetic alterations, somatic mutations, and epigenetic changes occur during carcinogenesis and progression of PCa (see Table 35.1).
Blood-Based Molecular Tests
Total PSA and PSA Isoforms
Total PSA
While Total PSA (t-PSA) has been used as a marker for PCa, the expression levels of t-PSA are highly variable across individuals and also in the same individual at different times. A single t-PSA result therefore has little clinical value [20]. Multiple factors account for the variations in t-PSA, including preanalytical specimen handling, different detection methods, biologic variations such as prostate size, and nonneoplastic processes such as hypertrophy and inflammation. In addition, no single t-PSA cutoff separates men at high risk for PCa from men at low risk.
The Prostate Cancer Prevention Trial demonstrated that as many as 15 % of men with a normal digital rectal examination (DRE) and a serum t-PSA of less than 4.0 ng/ml have PCa [21], and of these men, as many as 15 % may harbor a high Gleason grade disease. However, lowering the t-PSA threshold below 4 ng/ml did not improve early detection and long-term survival. Studies suggest that a rise in t-PSA level begins years or even decades before the diagnosis of PCa. Slowly rising t-PSA levels may reflect the long duration of PCa carcinogenesis.
Many efforts have focused on improving the performance of the t-PSA test over the years, including normalizing PSA to the size of the prostate gland, monitoring change in velocity (tPSAV) and PSA doubling time (tPSADT), and measurement of PSA isoforms (Pro-PSA) and alternate PSA forms. Given the limitations of t-PSA, targeting of the various molecular forms of PSA is being used to improve the predictive value of PSA testing and are discussed below.
Complex PSA vs Free PSA
Serum PSA exists in two forms, the bound form also known as complex PSA (c-PSA) and the unbound, enzymatically inactive form called free PSA (f-PSA). Serum c-PSA concentration correlates with the presence of PCa. Serum f-PSA levels are elevated in patients with benign prostatic hyperplasia (BPH) [22–25].
Large prospective studies have demonstrated that use of the percentage of f-PSA (%f-PSA) of total PSA improves the specificity of PSA screening for PCa in men with a normal DRE with serum PSA concentration in the “grey zone” of PSA (between 4 and 10 ng/ml) [26]. Based on these findings, the US Food and Drug Administration (FDA) approved the use of %f-PSA for PCa screening. In a recent meta-analysis of 66 studies, %f-PSA outperformed t-PSA and c-PSA as a predictor of biopsy outcomes [27]. This was more true in older men (≥50 years of age) than in younger men (44–50 years of age). Vickers et al. [28] found that the combined performance of %f-PSA, hK2 (human kallikrein-2), and t-PSA improved predictive ability when t-PSA was in the range of 1.2–2.0 ng/ml.
Subsequent studies noted a decrease in performance of %f-PSA. Explanation for these inconsistencies may lie in the limited stability of f-PSA in blood, particularly in stored sera [29, 30]. In addition performance of %f-PSA decreases with increased prostate size. In men with large prostates, %f-PSA increases even in the presence of cancer, thereby lowering the sensitivity of the test for PCa detection [31].
ProPSA and Prostate Health Index
ProPSA is a precursor form of PSA that contains a seven amino acid pro leader peptide that is cleaved by hk2 and trypsin to form active PSA. ProPSA is a component of free PSA (fPSA) and levels of proPSA are more closely associated with PCa. Truncated forms of proPSA in serum contain five, four, or two amino acids more than the total number of amino acids in PSA; the form with two additional amino acids is noted as proPSA (-2), [-2]proPSA, or p2PSA. FDA approved the Prostate Health Index (phi) developed by Beckman Coulter (Indianapolis, IN) in partnership with the NCI’s Early Detection Research Network in 2012. Phi, a mathematical formula using three biomarkers ([p2PSA/f-PSA] × √PSA), has been found to be useful in distinguishing men with PCa from those with benign prostatic conditions, when tPSA is in the grey zone (between 4 and 10 ng/ml) and the DRE is negative. Additionally, p2PSA levels and phi improve the detection of PCa with a Gleason score of 7 or higher; and in men with family history of PCa, phi score significantly outperforms tPSA and %fPSA for detection of aggressive PCa [32].
C-PSA remains to be evaluated as an alternative test. Currently the only c-PSA assay approved by the FDA is based on antibody-mediated elimination of all f-PSA followed by measurement of the remaining PSA (Bayer Immuno1 c-PSA Assay, Bayer Diagnostics, Tarrytown, NY).
Human Kallikrein-2
The human tissue kallikrein family of serine proteases consists of 15 members, known as kallikrein-related peptidases 1–15 (KLK 1–15) located together in a gene cluster at chromosomal region 19q13.3-13.4 [33–40]. The first identified kallikreins, the so-called classical kallikreins (KLK1, hK2, and PSA), contain a unique 11-amino acid-long kallikrein loop. Human Kallikrein-2 (hK2) shares 78 % homology with the amino acid sequence of PSA and has overlapping biological functions. Similar to PSA, hK2 occurs in two forms; one complexes with various plasma protease inhibitors, and the other occurs free in circulation. Unlike PSA, the majority of hK2 in serum is found in the free, unbound form. Total hK2 mRNA amounts to 10–50 % of t-PSA mRNA in the prostate tissue but in serum and seminal plasma, hK2 concentration is only 1–3 % of t-PSA. The highest concentrations of hK2 and PSA are found in seminal and prostatic fluid, but they are also present at lower concentrations in breast milk, breast cyst fluid, saliva, urine, and plasma [41–43]. Within the prostate, the expression of hK2 and PSA is regulated by androgens through the androgen receptor (AR) [44, 45]. Androgen response elements are located in the PSA promoter region [46–48].
Serum levels of hK2 and its ratio to f-PSA and %f-PSA have been reported to outperform t-PSA for PCa detection [49, 50] and could improve the discrimination of men with PCa from men without PCa [49, 51]. Two large studies tested the ability of serum hK2 to improve PCa screening in men with PSA levels below 10 ng/ml [52, 53]. Although the ratio of hK2 to f-PSA did not outperform %f-PSA, these studies showed that the hK2: f-PSA ratio is an independent predictive factor compared to %f-PSA.
Additionally, preoperative serum levels of hK2 appear to better predict biochemical failure (BCF), which is defined as post-treatment elevation of PSA level predictive of PCa recurrence. The predictive value of preoperative serum hK2 in patients undergoing prostatectomy for clinically localized disease was estimated at 0.721 (concordance index) vs 0.691 for tPSA. This difference in predictive accuracy was more pronounced in men with a tPSA <10 ng/ml (0.739 for hK2 vs 0.599 for tPSA, p < 0.0005), a category of men where a more accurate predictor is clinically useful.
Histological studies suggest that unlike t-PSA, hK2 expression increases with higher-stage and-grade tumors. It has also been suggested that hK2 could predict poor differentiation, extra-prostatic extension (EPE), and biochemical recurrence (BCR) in patients treated with radical prostatectomy [51, 54]. While intriguing, these findings need further validation [55].
In the grey zone of t-PSA levels, hK2 may add statistically and clinically important information for PCa detection and more importantly for prognostication. This is especially true in the USA where, due to aggressive PSA screening, most men diagnosed with PCa have a t-PSA less than 10 ng/ml, at which level the risk stratification using only t-PSA is not accurate.
Because of the extensive overlap in their amino acid sequence, clinical assays specific for hK2 without cross reactivity to PSA, yet sensitive enough to detect picogram/ml concentrations of hK2, have been difficult to develop. Currently these assays are only available in research laboratories.
A panel of four kallikreins, total PSA, f-PSA, intact PSA, and hK2, were combined to generate the 4K score [26, 28, 56, 57]. Studies suggest that the 4K score could be used to distinguish between pathologically insignificant and aggressive disease and reduce unnecessary biopsies [26]. The 4K score test is anticipated to be available through OURLab Urologic Reference Laboratory (OPKO Health, Inc., Miami, FL) in the future.
Other Blood-Based Molecular Markers
Between 15–40 % of patients treated for localized PCa will experience BCR as evidenced by rising PSA levels [58]. Androgen deprivation therapy is an accepted standard of care for patients who develop metastasis after definitive treatment [59, 60]. Despite adjuvant therapy, the mortality rate in these patients is high (also known as castrate resistant prostate cancer). Currently available tools for predicting disease-free survival are statistical models such as the Kattan nomogram that use PSA, Gleason Score, Clinical and Pathologic stage, and other clinical parameters to predict the probability of BCR-free survival at 5 years after radical prostatectomy [61]. Integration of blood-based predictive biomarkers to the currently available nomograms will increase their predictive power.
The uroKinase plasminagen activator (uPA) pathway or axis includes potential markers for PCa by being involved in various phases of tumor development and progression through degradation of extracellular matrix. Elevated levels of circulating uPA [62] and its receptor (uPAR) are linked to PCa stage and bone metastasis. Large multi-institutional studies are ongoing to further validate these findings [63–65].
TGF-β1 is a growth factor which regulates several cellular mechanisms such as proliferation, immune response, differentiation, and angiogenesis [66]. Increased levels of TGF-beta1 have been associated with cancer progression, occult and documented metastasis, and BCR [67–69]. Serum levels of IL6, a cytokine, and its receptor (IL6R) are elevated in patients with metastatic and treatment refractory disease. Elevated levels of IL6 may thus predict progression PCa [70, 71].
Endoglin is a transmembrane glycoprotein that is associated with angiogenesis. Elevation of preoperative plasma Endoglin may be associated with metastasis to regional lymph nodes [72]. Taking these into account, preoperative plasma levels of a combination of TGF-beta1, soluble IL6R, IL6, Endoglin, vascular endothelial growth factor, and vascular cell adhesion molecule were found to improve the predictive accuracy of the Kattan preoperative nomogram [73] by approximately 15 % (71.6–86.6 %) [2, 74, 75]. Additionally the inclusion of preoperative serum levels of these biomarkers to the traditional base model (tPSA, surgical margin status, extracapsular extension, seminal vesicles invasion, lymph node involvement, and pathologic Gleason sum) statistically significantly improved prediction of BCR.
Urine-Based Molecular Markers
PCA3/DD3: A Cancer-Specific Marker
PCA3, also known as DD3, is a noncoding RNA that was initially identified by Bussemakers et al. [76], and is currently the most specific clinically available marker for PCa. PCA3 RNA is highly overexpressed in PCa compared to normal or benign prostate tissue. Hessels et al. [77] reported a median of 66-fold upregulation of PCA3 in PCa tissue compared with normal prostate tissue. No other normal tissue or cancer expresses PCA3. In addition, PCA3 is upregulated in prostate tissues with a low volume cancer load (less than 10 % PCa cells). Since PCa cells are shed into the urine, PCA3 RNA can be measured not only in prostate tissue specimens but also in urine and in urine sediments after DRE. Given the specificity for PCa and the ease of analysis in urine sediments, PCA3 is currently the most specific PCa marker. Several versions of PCA3 urine tests are available [78].
In phase two of biomarker development for PCA3, a second generation reverse transcription-polymerase chain reaction (RT-PCR) assay was developed to detect PCA3 transcripts in urinary sediments obtained after DRE from a cohort of men who were recommended for prostate needle biopsy based on a total serum PSA value above 3 ng/ml [77]. This study, and three subsequent independent studies [78–82], showed that PCA3 had a high sensitivity and specificity using prostatic biopsies as the gold standard for the presence of a tumor (Table 35.2). DiagnoCure (Quebec, Canada) developed the first generation version of the PCA3 RT-PCR test. Gen-Probe (San Diego, CA) acquired the exclusive worldwide diagnostic rights for the PCA3 test from DiagnoCure and developed a PCA3 test using their APTIMA platform Progensa™ PCA3 test (Hologic, Inc., San Diego, CA).
Progensa™ PCA3 test (Hologic, Inc.) measures the concentration of PCA3 RNA and PSA RNA molecules in serum and calculates the ratio of the two. The Progensa™ test was FDA-approved for use in men who have a suspicion of PCa based on elevated PSA level and/or an abnormal DRE and/or one or more negative biopsy results in the context of a clinical suspicion of PCa. A Progensa™ PCA3 score below 25 is interpreted as negative and is associated with a low likelihood of PCa [83–85]. Based on 11 clinical studies (including 6 multicenter studies and 5 from individual centers) that encompassed a total of 2,737 men, the Progensa™ PCA3 score had an area under the curve (AUC) ranging from 0.66 to 0.75. The average sensitivity and specificity for the Progensa™ PCA3 score quoted by various studies are 66 % and 76 %, respectively, compared to the sensitivity of 47 % for serum PSA alone [84, 86].
To increase the predictive accuracy of biopsy outcome and identify men at risk for PCa, novel biopsy nomograms that include PCA3 levels have been created. Incorporation of PCA3 test results improved the diagnostic accuracy of the Prostate Cancer Prevention Trial Risk Calculator [87, 88]. It is expected that inclusion of PCA3 test results in future nomograms will be clinically useful for deciding whether to biopsy the prostate. Multiple studies [85, 89, 90] have suggested that PCA3 scores fulfill the criterion of being a valuable predictor of low-volume, insignificant cancer and could be of great help in selecting patients with PCa who are candidates for active surveillance.
PCA3 score predicts PCa risk independent from prostate volume, age, and the principal known non-neoplastic causes of increase in PSA, such as BPH and prostatitis. More than 90 % of high-grade prostate intraepithelial neoplasia (PIN) tissues express PCA3 [91]. The PCA3 test score may therefore help monitor patients with high-grade PIN (HGPIN), such that increasing PCA3 scores may trigger a decision to biopsy the prostate.
TMPRSS-ERG Translocation: A Cancer-Specific Translocation
The combined use of a DNA microarray expression data and a novel bioinformatics algorithm called Cancer Outlier Profile Analysis (COPA) identified gene over-expression of two ETS family transcription factors, ERG and ETV1 in PCa [14, 15]. Further characterization of cases with ERG or ETV1 outlier expression subsequently lead to the identification of fusion of the 5′ untranslated region of the prostate specific androgen-induced trans-membrane protease serine 2 gene (TMPRSS2), to the 3′ end of an ETS family transcription factor gene [16]. TMPRSS2 fusion with the ETS family member ERG is the predominant variant and is seen in 40–70 % (average 50 %) of patients with PCa, making the TMPRSS2–ERG gene fusion the most common genetic aberration described to date in human solid tumors [2]. ERG is regarded as a key PCa oncogene. Numerous other ETS member genes also can fuse to TMPRSS2, but are found at a much lower frequency in PCa. Similarly, variability in the 5′ gene fusion partner has been identified. Five major partners are known, and divided into classes based on their tissue-specificity and the sensitivity to androgens (Table 35.3) [9–12, 92, 93]. Class I is reserved for TMPRSS2; Class II includes other genes with prostate-specific, androgen-inducible 5′ UTR elements or endogenous retroviral elements; Class III includes the prostate-specific but androgen-repressed gene partners; Class IV includes the non-tissue-specific promoters that are ubiquitously expressed (housekeeping genes); and Class V consists of ETV1-specific rearrangements, including the localization of the entire ETV1 locus to the prostate specific locus, 14q13.2-14q21.1. ETS fusion seems to be an early event in the development of PCa [4, 17]. To date none of the published literature has found this translocation to be present in benign prostate tissue, making it specific for PCa.
Table 35.3
Classification of 5′ partner of ETV associated translocations
5′ Partner | Class | 3′ Partner | Initial reference |
|---|---|---|---|
TMPRSS2 | I | ERG, ETV1, ETV4 | |
TMPRSS2 | I | ETV5 | [144] |
HERV-K_22q11.23 | ETV1 | [10] | |
SLC45A3 | II | ||
KLK2 and CANT1 | II | ETV4 | [93] |
ACSL3 | II | ETV1 | |
SLC45A3 | II | ERG | [145] |
FLJ35294 | II | ETV1 | [145] |
SLC45A3 | II | ETV5 | [144] |
EST14, HERVK17, FOXP1 | II | ETV1 | [94] |
SLC45A3 | II | ELK4 | [146] |
NDRG1 | II | ERG | [147] |
C15orf21 | III | ETV1 | [10] |
DDX5 | IV | ETV1 | [145] |
HNRPA2B1 | IV | ETV1 | [10] |
SLC45A3 and ESRP1 | ETS neg | BRAF a | [148] |
Use of ETS Fusion in the Diagnosis and Treatment of Prostate Cancer
The presence of the TMPRSS2–ERG translocation can be assessed by immunohistochemistry (IHC) and fluorescent in-situ hybridization (FISH). Mosquera et al. [94], using a FISH assay for ERG gene rearrangements in PIN, found a strong correlation with the presence of cancer. Based on these findings TMPRSS2–ERG FISH study on isolated PIN may identify men with a high likelihood of having un-sampled PCa. In addition, TMPRSS2–ERG FISH may help identify patients undergoing transition to invasive carcinoma and for the work-up of atypical small acinar proliferations which are suspicious for, but quantitatively insufficient for, a definitive diagnosis of PCa on needle biopsy. Assessment for the presence of the TMPRSS2–ERG gene fusion therefore may not only be useful for early diagnosis [17, 18] but also may help stratify diagnostically difficult cases.
Knockdown of TMPRSS–ERG in fusion-positive cells inhibits tumor growth in xenograft assays [95, 96]. ETS fusions are therefore attractive therapeutic targets. Evaluation for targeting ETS fusion and its downstream targets is ongoing. Most 5′ ETS fusion partners including TMPRSS2 are androgen-responsive and it is likely that current and future therapeutic strategies that target androgen signaling may function at least in part through inhibition of ETS fusions [97, 98]. Phase 1 and Phase 2 trials analyzing the response to abiraterone, a small molecule inhibitor of cytochrome P, found evidence of ERG translocation in circulating tumor cells of 41 % men with castrate-resistant PCa prior to treatment [99]. After treatment with abiraterone, 80 % of the patients with ERG rearrangements had more than 90 % decline of PSA levels. In patients showing less than 90 % decline in PSA, only 30 % had a translocation [99, 100]. In this cohort of patients, a decline in PSA was associated with a decline in circulating tumor cells and an increased survival rate. Phase 3 trials incorporating fusion status are ongoing. The usefulness of ETS gene fusion status as a prospective marker of androgen-dependence in castrate-resistant PCa remains to be seen. In addition to the therapeutic implications, these studies provide evidence that castrate-resistant PCa may remain dependent on androgen signaling [101]. TMPRSS2–ERG translocation may predict tumor sensitivity to poly (adenosine diphosphate-ribose) polymerase 1 (PARP1) inhibition and in conjunction with PTEN deletion may add prognostic information [91, 102, 103].
While TMPRSS2–ERG translocation is very specific for prostate cancer, it is only present in approximately 50 % of cancer, and hence has limited use as a diagnostic tool on its own. Its use as a diagnostic test therefore lies in multiplexed assays with other biomarkers such as PCA3 [104, 105]. A study of more than 1,300 men demonstrated that combined measurement of PCA3 mRNA levels and TMPRSS2–ERG gene-fusion in urine outperformed serum PSA for PCa diagnosis [105].
Immunohistochemical Assays of TMRPSS2-ETS Fusion Protein
Multiple anti-ERG monoclonal antibodies standardized for IHC on formalin-fixed paraffin-embedded (FFPE) tissue are commercially available. Expression of ERG on IHC (Fig. 35.1) is considered a marker for the translocation with a sensitivity and specificity of approximately 86 % [106–109]. IHC expression of ERG can therefore be utilized as a surrogate marker for the translocation.
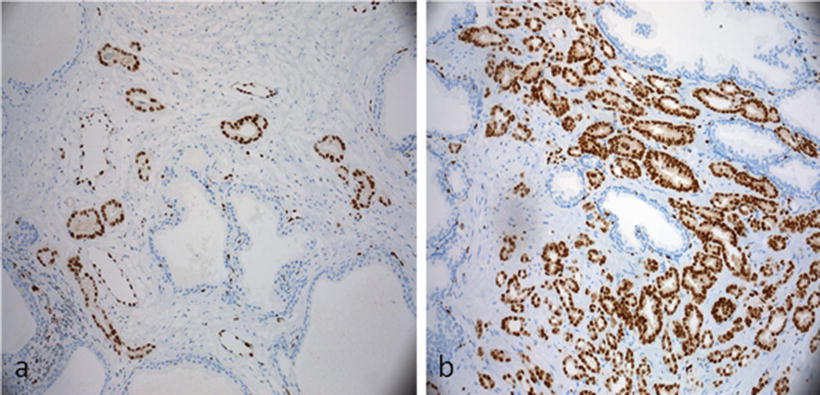
Figure 35.1
Immunohistochemical stain for ERG demonstrates negative staining of the stroma and normal glands. Normal endothelial cells are positive and act as internal controls. (a) Strong diffuse nuclear staining of a small cluster of atypical glands supports the diagnosis of prostatic adenocarcinoma. (b) Strong diffuse nuclear staining of ERG in prostatic adenocarcinoma. (Slides provided by Drs. Kyung Park and Mark A. Rubin, Department of Pathology and Laboratory Medicine, Weill Cornell Medical College, New York, NY)
FISH Assays for Detection of TMPRSS2–ETS Gene Fusion
Traditionally, two strategies for FISH detection of TMPRSS2–ERG fusion included the two and three color break-apart assays. The two-color break-apart FISH assays (Fig. 35.2) are designed to identify rearrangements in specific ETS family gene partners [110, 111]. Probes were designed to label regions telomeric (green) and centromeric (red) of ERG locus on 21q22.3. This set of probes appears yellow due to the overlap of the red centromeric and green telomeric probe in the nontranslocated allele. If a break occurs between the two probes, each color can be separately detected indirectly supporting the TMPRSS2–ERG gene fusion [2]. By this method, confirmation of fusion between two genes and identification of the specific 5′ partner is not possible because the probes are not specific for any single gene.
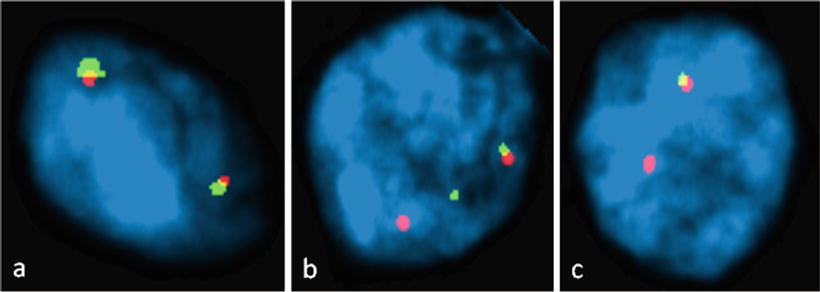
Figure 35.2
Dual Color TMPRSS-ERG FISH pattern in formalin-fixed, paraffin-embedded prostatic adenocarcinoma. A probe telomeric to the ERG gene is labeled green and a probe centromeric to ERG is labeled red. Overlapping green and red signals in normal cells produce a yellow color signal. (a) Normal cells without TMPRSS-ERG translocation with two overlapping red and green signals. (b) A cell positive for TMPRSS-ERG translocation with separation of one red and green signal. (c) Cell with ERG deletion resulting in loss of one green signal. (Slides provided by Drs. Kyung Park and Mark A. Rubin, Department of Pathology and Laboratory Medicine, Weill Cornell Medical College, New York, NY)
The three-color break-apart assay developed by Yoshimoto et al. [112] utilizes three probes. Two probes flank the ERG gene at the 3′ (BAC clone RP11-476D17 RED) and 5′ (BAC clone RP11-95121 GREEN) regions, and the third probe is specific for the 5′ region of TMPRSS2 (RP11-535H11 BLUE) or for the transcriptional regulatory sequences (telomeric) of TMPRSS2 (RP11-35C4; RP11-891L10; RP11-260O11). The use of this probe configuration not only enables detection of ERG rearrangement but also allows the detection of the mechanism of the rearrangement as explained below. With three color FISH, rearrangement as a result of deletion (Edel) results in co-localization of the 3′ ERG and TMPRSS2 signals and an absence of the 5′ ERG signal. Less frequently a genomic rearrangement leading to insertion of those sequences elsewhere in the genome to an unknown chromosome location can occur resulting in the separation of the 5′ ERG signals from the co-localization of the 3′ ERG and TMPRSS2 signals, thus described as ERG split or Class Esplit. In either scenario the unaffected chromosome 21 will display a class N (or normal) signal configuration. The presence of more than one copy of the TMPRSS2–ERG gene fusion is identified as Class 2+Edel. In summary, in Class N, where no ERG rearrangement has occurred, the two ERG signals (3′ BAC clone RP11-476D17 in RED and 5′ BAC clone RP11-95121 GREEN) co-localize and are visualized as a yellow signal and the 5′ TMPRSS2 signal is a separate blue probe signal. In Class Edel, the 3′ ERG probe (RED) co-localizes with the TMPRSS2 probe signals (BLUE) with absence of the 5′ ERG signal, representing rearrangement with the loss of the intervening sequence; the unaffected chromosome 21 will display a Class N configuration. In Class Esplit, the 3′ ERG signal (RED) co-localizes with the TMPRSS2 signal (BLUE) with retention of 5′ ERG signal (GREEN) elsewhere in the nucleus; the unaffected chromosome 21 displays Class N configuration.
RT-PCR for Determining Gene Fusion Status
The RT-PCR technique is dependent on detection of hybrid transcripts; however RT-PCR assays do not differentiate between the different genomic mechanisms such as Edel vs Esplit. To date, up to 17 different fusion transcripts and splice variations have been characterized. The most commonly found fusion transcript is composed of exon 1 of TMPRSS2 fused to exon 4 of ERG [109, 113]. Of the transcripts described, one produces a genuine TMPRSS2-ERG fusion protein and eight contain premature stop codons and are unlikely to result in ERG over-expression [12, 113–116].
Wang et al. [113] characterized in detail the expression of TMPRSS2–ERG fusion mRNAs and correlated the isoforms and their respective expression levels with clinical outcome in cancers from men undergoing radical prostatectomy. Significant variation was identified in the alternatively spliced isoforms expressed in different cancers. Expression of an isoform, in which the native ATG in exon 2 of the TMPRSS2 gene is in frame with exon 4 of the ERG gene, was associated with clinical and pathologic variables of aggressive disease. Expression of other isoforms, in which the native ERG ATG in exon 3 was the first in-frame ATG, was associated with seminal vesicle invasion, which is correlated with poor outcome following radical prostatectomy.
Stay updated, free articles. Join our Telegram channel

Full access? Get Clinical Tree


