Name
Molecular characteristics
HLA-F
Class I-like molecule
HLA-G
Class I-like molecule
HLA-H
Class I pseudogene
HLA-A
Class I α chain
HLA-J
Class I pseudogene
HLA-E
Class I-like molecule
HLA-C
Class I α chain
HLA-B
Class I α chain
MICA
MHC class I-like molecule
MICB
MHC class I-like molecule
HLA-DRA
DR α chain
HLA-DRB9
DRB pseudogene, isolated fragment
HLA-DRB3
DR β3 chain determining DR52 and Dw24, Dw25, Dw26 specificities
HLA-DRB2
Pseudogene with DR β-like sequences
HLA-DRB1
DR β 1 chain determining specificities DR1, DR2, DR3, DR4, DR5, etc.
HLA-DQA1
DQ α chain as expressed
HLA-DQB1
DQ β chain as expressed
HLA-DQB3
DQ β-chain-related sequence, not known to be expressed
HLA-DQA2
DQ α-chain-related sequence, not known to be expressed
HLA-DQB2
DQ β-chain-related sequence, not known to be expressed
HLA-DOB
DO β chain
TAP2
ABC (ATP-binding cassette) transporter (associated with antigen presentation)
LMP7
Proteosome-related sequence (role in loading class I molecules with peptides)
TAP1
ABC transporter (associated with antigen presentation)
LMP2
Proteosome-related sequence (role in loading class I molecules with peptides)
HLA-DMB
DM β chain (control peptide loading by class II molecules)
HLA-DMA
DM α chain (control peptide loading by class II molecules)
HLA-DPA1
DP α chain as expressed
HLA-DPB1
DP β chain as expressed
HLA-DPA2
DP α-chain-related pseudogene
HLA-DPB2
DP β-chain-related pseudogene
HLA Polymorphism
HLA genes are codominantly expressed, and most individuals are heterozygous at the classical (i.e., presenting peptides for inspection by T cells) HLA class I and class II loci. The nomenclature for the alleles of the HLA system is decided by an international nomenclature committee. Antigen names are composed of a letter designating the HLA protein encoded by a locus or loci and a number, for example, A2, B7, Cw4, DR17, and DQ3. Allele names are based on nucleotide sequence variation among alleles identified using DNA-based techniques (discussed below). The number of alleles at the HLA class I and class II loci and a listing of their serologically defined specificities and allele equivalents are available online at several Web sites (for instance, the Anthony Nolan Trust Web site at http://www.anthonynolan.org/clinicians-and-researchers/anthony-nolan-research-institute/hla-informatics-group and also at http://hla.alleles.org or the ImMunoGeneTics (IMGT)/HLA Database Web site at http://www.ebi.ac.uk/imgt/hla/).
Pattern of HLA Polymorphism
Most of the sequence diversity for the HLA class I loci is localized to the second and third exons and, for the class II loci, to the second exon of each gene. HLA diversity is generated through the selection of alleles with nonsynonymous substitutions encoding amino acid differences within the peptide-binding site. This contrasts with the bias against substitutions within the introns and other binding domains. Linear sequences identifying residues critical to the expression of allospecificities are found in the helices of the α1 and α2 domains as well as external portions of the β-pleated sheet. Other polymorphic amino acid residues that are important for peptide binding but not defined by alloantibodies are identified by DNA-based techniques [5–7].
The pattern of allelic sequence diversity for both the class I and class II loci is unusual; most alleles differ from their closest neighbor by multiple substitutions, with some alleles differing in the second and third exons by as much as 15 %. This pattern is suggestive of segmental exchange of nucleotide motifs between alleles of the same locus. There are also a few examples of interlocus gene conversion, and most are the result of HLA-B and HLA-C recombination. Thus, different HLA alleles of a locus are patchwork (i.e., mosaic) combinations of polymorphisms. The extensive allelic diversity at HLA loci is thought to have been generated by polymorphic sequence motifs generated by gene duplication and recombinational mechanisms such as gene conversion-like events, which have shuffled these polymorphic sequence motifs. Point mutations also contribute to this allelic diversity [6, 7]. One consequence of this pattern of patchwork polymorphism is that the sharing of specific epitopes on the HLA molecules leads to antigenic cross-reactivity. Due to epitope sharing, HLA antigens may be arranged in cross-reactive groups or CREGs [2, 3]. CREGs are important in that they allow for greater latitude in donor–recipient HLA matching and at the same time may be used to predict potential problems with graft outcome. A problematic consequence of the combinatorial nature of HLA alleles is that a given pattern of sequence motifs may be consistent with more than a single genotype. This problem of ambiguity in DNA-based typing is discussed below.
HLA Haplotypes
The term “haplotype” applies to any set of genetic polymorphisms at contiguous loci. These neighboring polymorphisms are co-transmitted on a single parental chromosome in the absence of recombination. A haplotype can be defined at any level of polymorphism. Alleles at different HLA loci are often described as being transmitted as a multi-locus haplotype (e.g., the A1-B8-DR3 haplotype), but the sequence variants associated with specific HLA allele names are in fact haplotypes of individual polymorphisms at a given locus. An individual inherits one haplotype from each parent. In any family having more than one sibling, there is a 1 in 4 chance that the two siblings will be HLA identical and a 1 in 2 chance that they will share one haplotype. Given the number of existing alleles, the number of possible haplotypes is astronomical. However, due to linkage disequilibrium (LD), the number of haplotypes found in a population is more restricted [7, 8].
The organization of HLA-DQ and HLA-DP loci is conserved within humans and other primates, whereas the number of HLA-DR genes varies in different haplotypes. Within the HLA-DR region, the DRB1 gene encodes the DRβ1 chain, which determines the DR private specificities DR1, DR2, DR3,DR4, DR5, and so on. The DRB3, DRB4, and DRB5 genes encode the DRβ3, DRβ4, and DRβ5 chains, which determine the DR52, DR53, and DR51 specificities, respectively (Fig. 58.1).
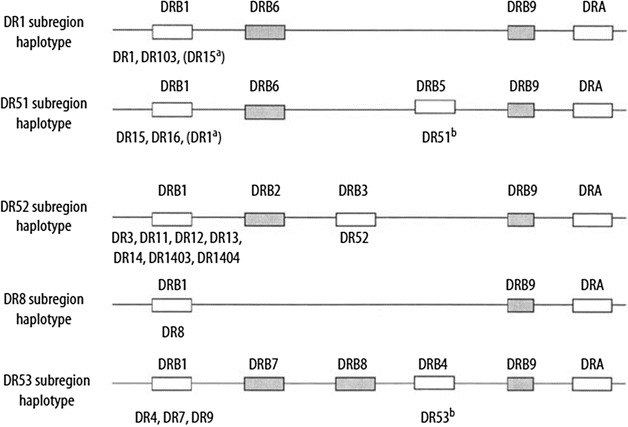
Figure 58.1
HLA-DR region and encoded allotypes. Pseudogenes are indicated by shaded boxes. Expressed genes are indicated by open boxes. The serologic specificity encoded by a gene is given underneath each expressed gene box. a Rarely observed haplotypes. b The DR51 and DR53 specificities may not be expressed on certain haplotypes (Adapted from Little AM, Parham P. Polymorphism and evolution of HLA class I and II genes and molecules. Rev Immunogenet. 1999;1:105–123)
Genetic recombination or crossing over in the HLA region is a relatively rare event, occurring for the most part no more than 1 % per meiosis between HLA-A and HLA-B and between HLA-B and HLA-DR. Recombination also can occur between HLA-A and HLA-C and between HLA-B and HLA-C (0.6 % and 0.2 %, respectively). Such recombination can have important clinical implications for transplantation.
Linkage Disequilibrium or Gametic Association
LD is an important feature of the HLA system. Gametic associations are regularly found between certain alleles of HLA-A and HLA-B, HLA-C and HLA-B, HLA-B and HLA-DR, and HLA-DR and HLA-DQ. In some so-called extended haplotypes, significant LD extends over 3 Mb from HLA-A at the telomeric end of the HLA region to HLA-DP at the centromeric end, including HLA class III genes ([8] and references therein). It is this LD that allows the identification of bone marrow or stem cell donors in population registries who are matched with a given patient at multiple loci (see “Histocompatibility Assessment in Unrelated Donors”).
HLA Gene Frequencies in Human Populations
Although a very large number of alleles (e.g., >1,600 for HLA-B) can be found in the global population, a much smaller number (e.g., 30–50 for HLA-DRB1) is present in most individual populations. Importantly, different populations tend to have different frequency distributions of alleles and exhibit different patterns of LD. This variability exists among both racial and ethnic groups.
Clinical Utility of HLA Typing
Solid Organ Transplantation
Kidney and Pancreas
Over 570,000 patients had end-stage renal disease (ESRD) at the end of 2010. Treatment modalities include hemodialysis, peritoneal dialysis, and kidney transplantation. Kidney transplant is the most effective treatment for patients with ESRD. However, despite a waiting list of over 90,000 patients, only 10,622 deceased donor kidneys were transplanted in 2010. The median time a patient with blood type “O” listed in 2003 waited for a deceased donor graft was > 5 years. Longer time on dialysis is one of the strongest risk factors for inferior transplant outcomes. The pursuit of kidney donation from living donors is essential to addressing the long and ever-growing waiting list (Scientific Registry of Transplant Recipients, 2011; http://www.srtr.org/).
Many transplant candidates have potential living donors, but approximately one-third of these potential donations do not lead to a transplant because of blood group type or crossmatch incompatibility. Kidney paired donation (KPD), also referred to as kidney exchange or live-donor paired exchange, provides an opportunity for donors to indirectly donate to their intended recipient, thereby ensuring living donor kidney transplantation without the barrier of incompatibility. Congress defined and supported KPD by passing the Charlie Norwood Living Organ Donation Act, signed in 2007. Support and interest in KPD has markedly grown in the last decade. However, KPD remains grossly underutilized. Nearly all the initial donor exchange transplants in the USA have been performed through independent, regional KPD registries. The logistics of maintaining a multicenter database, crossmatching potential pairs, and timing the transplants have become increasingly complex, raising concerns regarding programmatic efficiency and efficacy (reviewed in Ref. 9).
HLA Matching of Living Related Donors
Transplants are performed using donor–recipient pairs sharing HLA-A, HLA-B, and HLA-DR antigens from one or two haplotypes. The analysis of HLA matching for kidney graft survival over the period of 1985–1999 is based primarily on serologic typing data. The half-life survival for a graft from an HLA-identical sibling is 23 years, compared to a one-haplotype-related donor, which has a half-life of 12.8 years [6, 10].
HLA Matching of Cadaveric Donors
Data excerpted from the United Network for Organ Sharing (UNOS) transplant registry [9] indicate that HLA serologic matching appears to have an effect on long-term graft survival of kidneys from cadaveric donors. Although the 1-year graft survival is not very different in cases involving a complete match from those who are completely mismatched, after 5 years the gap in percent survival widens significantly, suggesting that the immunosuppressive drugs are potent in avoiding early graft loss due to acute rejections. However, as the drug dosages are tapered over time, the HLA-matching effect becomes significant. Patients receiving organs with zero mismatches for HLA-A, HLA-B, or HLA-DR antigens achieve a graft survival half-life of 11.3 years compared to a half-life of 6.3 years for grafts that were completely mismatched for these antigens. HLA matching is especially beneficial in second transplants and in patients with preformed antibodies. The effect of HLA-A, HLA-B, and HLA-DR matching remains significant even with the most recent forms of immunosuppression [10].
UNOS HLA-Matching Algorithm for Allocation of Cadaveric Kidneys and Pancreases
The selection of a recipient for any given random cadaveric donor is based on an HLA-matching algorithm defined by UNOS (http://www.unos.org). The current allocation policy considers the degree of HLA matching at HLA-A, HLA-B, and HLA-DR. The organs are distributed locally first, and if no match is found, they are offered regionally, and then nationally, until a recipient is found. Nationwide organ sharing is mandatory for pediatric and sensitized candidates with zero HLA-A, HLA-B, and HLA-DR mismatches; local and regional organ sharing is based on one or two HLA-DR mismatches. All other match grades are allocated without regard to mismatching. The main purpose of this algorithm is to try to transplant more minority patients while at the same time not reducing overall graft outcome.
Transplantation of Other Solid Organs
HLA typing for heart and lung transplant patients and their potential donors is an important step for donor selection by virtual crossmatching. Virtual crossmatching is accomplished by avoiding HLA class I and class II antibody specificities identified by screening patients’ sera prior to transplant. HLA typing in these patients usually includes low-resolution HLA-A, HLA-B, HLA-C, HLA-DRB1, HLA-DRB3, HLA-DRB4, HLA-DRB5, and HLA-DQB for patients and their donors. In cases where anti-DQA, anti-DP, or allele-specific antibodies are present, HLA typing of donors and recipients also may include HLA-DQA, HLA-DP, or allele-level typing as needed.
The effect of HLA-A, HLA-B, and HLA-DR matching on the survival of heart and lung transplants is statistically significant. In addition, donor-specific antibodies to HLA antigens are associated with graft failure and poor survival. Antibody-mediated rejection appears in about 10–20 % of heart transplant patients, correlating with factors of poor outcome such as increased incidence for hemodynamic compromise rejection, greater development of cardiac allograft vasculopathy, and higher incidence of mortality. The effect of HLA matching for liver transplants is less clear.
Hematopoietic Cell Transplantation
HLA Typing Requirements
Typically, HLA typing for hematopoietic cell transplantation (HCT) initially would include low-resolution typing for HLA-A, HLA-B, HLA-C, HLA-DRB1, HLA-DRB3, HLA-DRB4, HLA-DRB5, and HLA-DQB1 loci. Allele-level typing is subsequently performed in the final identification of suitable donors for HCT. Three different categories of donors usually are considered in the following order of preference: HLA genotypically identical siblings, HLA-mismatched relatives, and matched or mismatched unrelated donors.
Histocompatibility Assessment in HLA-Matched Relatives
The goal when screening for an HLA-matched sibling donor is to identify which of any siblings have inherited the same HLA haplotype from their parents. This requires typing all siblings and, if possible, both parents for HLA-A, HLA-B, HLA-DRB1, and HLA-DQB1. Given the current average family size in the USA of 2.7 siblings, the approximate probability that a patient will have an HLA match within the family is 30–35 %. For those patients who do not have an HLA-matched sibling within the family, an HLA-mismatched relative who shares one haplotype can be considered. However, the clinical data clearly indicate that with increasing disparity for HLA-A, HLA-B, HLA-DRB1, or HLA-DQB1 loci, there is increased risk of graft-vs-host disease (GVHD) following HCT.
Histocompatibility Assessment in Unrelated Donors
When a matched sibling donor does not exist for a patient requiring allogeneic HCT (70 % of cases), searching for extended family members or donors from unrelated bone marrow registries would be the next option. Registries of volunteer bone marrow donors as well as cord blood exist in most developed countries. The largest of these is the National Marrow Donor Program (NMDP) in the USA (http://www.marrow.org).
The probability of finding a matched donor at HLA-A, HLA-B, HLA-DRB1, and HLA-DQB1 depends on the ethnic origin of the patient and the composition and size of the donor registry being searched. Identifying a patient’s haplotypes can help predict the probability of finding matched donors and assist in developing a search strategy, because some alleles and haplotypes are more common than others, and they are distributed at different frequencies in different racial and ethnic groups. When searching for a donor, for some alleles, an allele-level match is more likely to be found among persons of a particular ethnicity [11–14]. The NMDP matching algorithm HapLogicSM is based on this principle: identifying the donors or cord blood units (CBUs) with the highest potential to match the patient. This allows transplant physicians searching the Be The Match Registry® (operated by the NMDP) to identify more quickly and efficiently the best immunogenetically matched donor or CBU for their patients. The transplant center is responsible for selecting an unrelated donor or CBU for a patient. The NMDP recommends that, when possible, patients and adult donors (marrow or peripheral blood stem cells) should be fully matched (8 of 8 loci) at high resolution for HLA-A, HLA-B, HLA-C, and HLA-DRB1. Matching for CBUs is less stringent, and the NMDP recommends fully matched (6 of 6) CBUs at HLA-A, HLA-B (antigen level), and HLA-DRB1 (allele level). This does not imply that availability of a partially matched donor or CBU is a contraindication to transplant. Instead, a less-than-optimal match is another risk factor to be considered in developing the patient’s treatment plan.
Likelihood of Finding an Unrelated Donor or Cord Blood Unit
Today, patients are more likely to find an unrelated donor or CBU than previously possible. Through the NMDP, three potential hematopoietic cell options for patients in need of an unrelated donor can be available: marrow, peripheral blood stem cells (PBSC), or umbilical cord blood. A patient’s likelihood of finding a potential unrelated donor or CBU has increased with the continuing growth and increasing diversity of the Be The Match Registry. As of 2012, the registry includes nine million potential marrow or PBSC donors and nearly 145,000 CBUs. Through international connections, the NMDP searches more than 18.5 million potential donors as of 2012 and nearly 550,000 CBUs. Nearly all (>95 %) patients are able to find at least one potential 4 of 6 HLA-matched CBU on the Be The Match Registry, the largest in the USA, and the majority will find a potential 5 of 6 match. However, patients belonging to racial groups that are not well represented in the registries have a considerably decreased probability of matched donor identification [12].
Relative Impact of HLA Disparities
HLA compatibility affects not only the ability to achieve sustained engraftment following HCT but also the risk of developing acute and chronic GVHD [6, 13, 15]. Posttransplant risk of graft failure, GVHD, and mortality can be affected by quantitative and qualitative characteristics of donor and recipient HLA mismatching. Moreover, studies have reached different conclusions regarding the relative contributions of HLA class I and class II mismatching because of population-based differences in the specific HLA-mismatch combinations between patients and donors ([13] and references therein). In an analysis of HCT for chronic myelogenous leukemia (CML), the risk of graft failure is affected primarily by donor disparity for HLA class I including HLA-C. The incidence of rejection correlates with the number of donor-incompatible alleles. The incidence of graft rejection is 0.7 % for zero, 8 % for a single, and 19 % for multiple class I allele incompatibilities. Donor disparity for class II does not increase the risk of rejection [6, 13].
The level of matching is more critical for HCT than for solid organ transplantation because of the risk of GVHD. GVHD is a major cause of mortality in HCT and is more frequent than allograft rejection. Analysis of HLA and GVHD focuses on mismatches in the host recognized by donor T cells. Generally, host disparity for class II is thought to convey greater risk for GVHD than class I disparity. In an analysis of HCT for CML, patients with a single class II mismatch at HLA-DR or HLA-DQ have a hazard ratio of 1.8 compared to HLA matches. Single class I mismatches are well tolerated with respect to GVHD; however, combined mismatching at class I and class II confers a hazard ratio of 2.0. Allele mismatches for HLA-A, HLA-B, HLA-C, HLA-DRB1, and HLA-DQB1 also are a significant factor for survival. Patients mismatched for more than one class I allele and those mismatched at both class I and class II alleles have a significantly lower survival than patients and donors fully matched for HLA-A, HLA-B, HLA-C, HLA-DRB1, and HLA-DQB1. A single class I mismatch or single class II mismatch does not appear to affect survival [6, 13, 15]. It is likely that different modes of patients’ immunosuppression after transplant would have an impact on the relative risk associated with various HLA loci. Criteria for “permissible” mismatching in HCT are center dependent. However, very few centers would perform HCT across more than one HLA mismatch at HLA-A, HLA-B, HLA-DR, or HLA-DQ. Interestingly, recent studies have shown that GVHD rates and survival outcomes in pediatric and adult patients receiving cord blood transplants with up to two HLA antigen mismatches (i.e., a 4 of 6 match) are similar to those for 6 of 6 HLA-matched unrelated donor marrow transplants, as long as the recipient received an optimal CD34 cell dose adjusted for the recipient’s body weight [16–19].
HLA and Disease Association
Population Genetic Analyses
The extensive polymorphism observed for HLA loci requires a rigorous approach to data analysis [20]. The complex patterns of LD commonly observed for HLA data can make it difficult to identify specific causal genetic variants. Disease association studies of highly polymorphic HLA data may require the consideration of multiple units of analysis, including amino acid, allele, genotype, and haplotype levels, as well as consideration of gene–gene or gene–environment interactions. The selection of the appropriate statistical tests is critical and will be dependent on the nature of the data set as well as the specific research hypotheses being tested; there is no single analytical approach that can be applied to all data.
Population genetic analyses of gene (allele) frequencies, tests for fit Hardy–Weinberg equilibrium (HWE) expectations, and estimations of haplotype frequencies are the primary steps in analyzing immunogenetic data and provide additional means to assess underlying population substructure, as well as additional units of analysis on which association analyses will be performed. Basic methods for these analyses are described below.
Calculation of Gene (Allele) Frequencies
In the age of molecular typing techniques, HLA gene (allele) frequencies (GF) no longer need to be estimated from phenotype data. In most cases, GF for HLA data can be obtained via direct counting, where the number of observations for a given allele is divided by the number of chromosomes (2n, where n = sample size) under study.
Hardy–Weinberg Testing
The Hardy–Weinberg (HW) model is useful for primary quality control (QC) verification of the integrity of genotype data, as molecular genotyping errors can result in both individual genotype deviations and overall (locus-level) deviations from HWE. In addition, HW testing also is useful for detecting sampling errors (see below) in population samples. Confidence in the accuracy of HW testing therefore is crucial for confidence in subsequent analyses, as many analytical methods (e.g., LD and haplotype estimation) are predicated on an assumption of HWE in the data set.
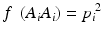
In a HW test, observed genotype counts are compared to those expected under HWE proportions (HWEP), as calculated from a table of all possible genotypes generated using an appropriate statistical method [21]. The relationship between the allele and genotype frequencies under HWEP is given as
 and
and
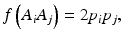 where p i is the allele frequency of allele A i and p j is the allele frequency of allele A j . Populations in HWE will not depart significantly from these allele and genotype frequencies.
Tests of overall locus-level HWEP compute a p-value to estimate the significance of observed deviations across all genotypes. Significant deviation of observed genotype counts from expected HWEP can result from factors that include sampling errors (the sampling of admixed, stratified, substructured, or some other form of blended populations), inbreeding or other nonrandom mating, natural selection, and genotyping errors. Tests for deviation from HWEP have low power, and significant deviation from HWEP is not common. Genotyping errors (e.g., failure to detect a specific allele, resulting in an excess of homozygotes) are the first consideration when significant deviations from HWEP are detected (especially when such deviations are detected only at a single locus in a multi-locus analysis), rather than the operation of selection, admixture, or nonrandom mating, unless the data are suspected to be from an unusual population.
Haplotype Estimation
Haplotype-level analyses are important to studies of the etiology of human disease, selective forces acting on populations, and optimal bone marrow donor registry (BMDR) size. Multi-locus analyses can be used to identify associations between markers and disease loci that are not evident with single-locus analyses. Haplotypes are used for disease association mapping, quantitative trait locus (QTL) mapping, and imputing underlying genetic markers.
Study design and subject recruitment depend on which of the alternative approaches of identifying haplotypes by segregation analysis in families or estimating haplotypes from population samples of phase-unknown unrelated individuals will be applied. Estimated haplotypes and haplotype frequencies (HFs) play a central role in most genetic studies [21].
It is important to understand that haplotype estimation always results in population-level frequency estimates, rather than haplotype assignments for individuals. Due to the limitations of current haplotype estimation methods, estimated haplotypes observed fewer than three times in a population should be considered unreliable.
Analysis in Disease Association Studies
The case–control study is the most common study design in HLA disease association studies. Case–control studies can be very sensitive to population stratification within sample cohorts. This issue is particularly important for HLA data, as HLA allele frequency distributions can vary considerably between human populations. If study subjects are not chosen with scrupulous attention to homogeneity of ancestral background, population-based genetic differences between cases and controls may be misinterpreted as disease associations.
The results of the basic population-level analyses outlined above can be used in case–control association analyses. Depending on the study hypothesis, the units of analysis may include gene, carrier, genotype, and/or haplotype frequencies in cases and controls. Assurance that the control population genotypic distributions conform to expected HWEP is critical.
Contingency Tables
A contingency table is used to test the independence of frequency distributions for categorical variables. Tests for heterogeneity between specific groups (e.g., cases and controls) for HLA data can be performed using contingency table testing and a standard Chi-square (χ 2) measure.
A contingency table always is constructed utilizing raw counts, rather than frequency data. The preferred approach in this type of analysis for highly polymorphic HLA data is to first examine heterogeneity in overall allele frequency distributions in cases vs controls for a particular locus, using a 2 × k row by column (r × c) contingency table. If overall heterogeneity is detected at the locus level, the contributions of individual alleles to the overall deviation can be examined in a series of 2 × 2 tests.
When significance of the association of all individual alleles is assessed with the a priori knowledge of overall heterogeneity at the locus, it is not necessary to correct for multiple comparisons in subsequent 2 × 2 tests; however, if no overall heterogeneity has been detected, analysis of 2 × 2 tests requires corrections for multiple comparisons (usually via the Bonferroni method), with a correction factor minimally equivalent to the number of alleles tested.
Low-frequency alleles pose a particular challenge in traditional χ 2 association tests in disease studies. The χ 2 test can lead to false acceptance or rejection of the null hypothesis when the expected genotype counts in a contingency table are small. It is not unusual for 30 or more HLA alleles to be observed at a locus, with a wide range of frequencies, and the preferred approach is to combine low-frequency alleles into a single “binned” category, by combining alleles with an expected value of less than five in cases or controls prior to calculation of the χ 2 statistic. The χ 2 statistic for a contingency table analysis of case–control data for a genetic association is calculated as
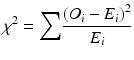 where
where
O i = the observed count of allele i
E i = the expected count of allele i
The expected count for each cell in the r × c table is calculated as
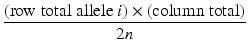 where
where
column total = sum of the counts in the column
row total = number of observations of allele i in all subjects
n = number of individuals (cases + controls)
2n = number of chromosomes (cases + controls)
The degrees of freedom (df) for the χ 2 analysis are the number of alleles with expected values in cases and controls of five or greater, plus the combined category, minus 1 (i.e., k − 1). A p-value is obtained by comparing the test statistic to the χ 2 distribution for the appropriate df.
Odds Ratio and Relative Risk
Odds ratios (ORs) are used in disease association studies to describe the strength of association between two variables and reflect the ratio of odds of an outcome (e.g., disease) in one group (e.g., individuals with a particular allele) to the odds of this outcome in another group (individuals without that allele). Relative risk (RR) is a different measure that describes the risk of having the outcome of interest relative to exposure (e.g., positive or negative for a particular allele). RR is more applicable to prospective studies, while OR is preferred for retrospective studies.
OR and RR values are only meaningful when presented with a corresponding confidence interval (CI). The standard probability level is generally 95 %, meaning that there is a 95 % chance that the OR or RR value of interest is in that range. Because the null hypothesis of both tests is that OR or RR = 1, a CI that includes 1 is not considered statistically significant.
Logistic Regression
Logistic regression (LR) analyses also can be used in case–control studies. LR is a form of generalized linear modeling for data with a binary outcome variable, such as case–control data. LR provides a means to develop association models that include the contribution of numerous covariables. LR is a critical tool in the analysis of complex multivariate data sets.
LR analysis always is performed using software, but extreme care must be taken in the coding of HLA data, as most LR software is not designed to handle high levels of polymorphism common in these data sets. A regression analysis produces a model that includes all of the variables that are useful in predicting the (binary) outcome variable. LR provides an OR for each variable involved in predicting outcome and can be particularly useful in HLA studies that must consider a large number of cofactors.
HLA Typing for Autoimmune Diseases and Other Disorders
Specific alleles of HLA molecules are associated with certain diseases. Associations have been shown to be of two types: those with disease association with class I antigens and those with strong associations with class II antigens (Table 58.2). Importantly, as shown in Table 58.2, the following HLA disease associations are of diagnostic importance. The best known is the association of HLA-B27 with ankylosing spondylitis (AS) and associated spondyloarthropathies (reviewed in Ref. 23). More than 90 % of AS patients are B*27, which is found in 5–10 % of the general population. An increased incidence of B*27 also is seen in patients with Rieter syndrome and anterior uveitis.
Table 58.2
Examples of HLA testing for autoimmune diseases
Disease
Stay updated, free articles. Join our Telegram channel
Full access? Get Clinical Tree
 Get Clinical Tree app for offline access

|
|---|