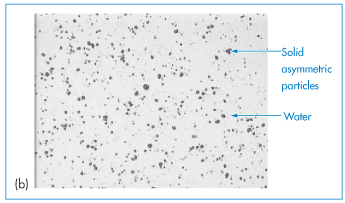
Figure 6.1 Photomicrographs of (a) an oil-in-water emulsion and (b) a suspension.
Table 6.1 Main types of colloidal systems
Type | Disperse phase | Continuous phase |
o/w emulsion | Oil | Water |
w/o emulsion | Water | Oil |
Suspension | Solid | Water or oil |
Aerosol | Solid or liquid | Air |
It is because of the subdivision of matter in colloidal systems that they have special properties. The large surface-to-volume ratio of the particles dispersed in a liquid medium results in a tendency for particles to associate to reduce their surface area, so reducing their contact with the medium. Emulsions and aerosols are thermodynamically unstable two-phase systems that reach equilibrium only when the globules have coalesced to form one phase, for which the surface area is at a minimum. Many pharmaceutical problems revolve around the stabilisation of colloidal systems.
Some biological phenomena can be understood in terms of the association of cells with other cells or with inanimate or other substrates. This chapter describes various colloidal systems, deals with the theoretical approaches to colloid stability and discusses the pharmaceutical problems encountered with colloidal dosage forms. At the close of the chapter some of the biological implications of the subject are indicated, which include the increasing use of particles in the nanometre (nm) size range (nanoparticles) and particles in the micrometre (μm) size range (microparticles) as carriers for drugs for targeting and for modifying the disposition of drug molecules contained within them. The dividing line between the colloidal and non-colloidal systems in terms of the nature of the dispersing medium and the dispersed material is not one that can be defined exactly.
6.2 Colloid stability
In dispersions of fine particles in a liquid or of particles in a gas, frequent encounters between the particles occur owing to:
- Brownian movement
- creaming or sedimentation
- convection.
Creaming of emulsions occurs when the oil droplets of an o/w emulsion migrate to the emulsion surface or the water droplets in a w/o emulsion move toward the bottom of the container. The rate of creaming depends on the difference in density between the dispersed particles and the dispersion medium, the particle radius, a, and the viscosity of the dispersion medium,  . According to Stokes’ law the rate of sedimentation (or creaming) of a spherical particle, ν, in a fluid medium, is given by
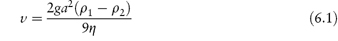
where ρ1 is the density of the particles, ρ2 is the density of the medium and g is the gravitational constant.
Creaming of an emulsion or sedimentation of a given suspension can be reduced in several ways:
- by forming smaller particles
- by increasing the viscosity of the continuous phase
- by decreasing the density difference between the two phases.
Particles will still collide, but the frequency or the impact of the collisions can be minimised. What is the fate of particles when they come into close contact? The encounters may lead to permanent contact of solid particles or to coalescence of liquid droplets. If they are allowed to continue unchecked, the colloidal system destroys itself through growth of the disperse phase and excessive creaming or sedimentation of the large particles; with emulsions this process is often referred to as the cracking of the emulsion. Whether these collisions result in permanent contact or whether the particles rebound and remain free depends on the balance of the attractive and repulsive forces of interaction between the particles and on the nature of the surface of the particles.
An additional cause of emulsion instability is the tendency for the growth of the larger droplets at the expense of smaller droplets in a process known as Ostwald ripening. Molecules diffuse from the smaller droplets to the larger ones through the continuous phase, with a resultant increase of the mean droplet size, driven by the fact that large particles are energetically more favoured than smaller ones (Fig. 6.2).
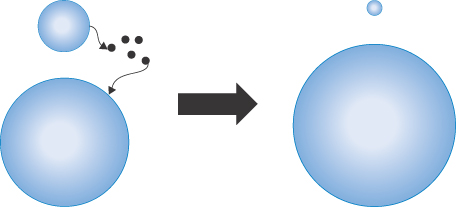
Figure 6.2. Representation of the process of Ostwald ripening: a small particle partially dissolves in the continuous phase and the molecules are taken up by the larger particle, until the smaller particle disappears completely.
6.2.1 Forces of interaction between colloidal particles
There are five possible forces between colloidal particles:
1. electrostatic forces of repulsion
2. van der Waals forces, or electromagnetic forces of attraction
3. Born forces – essentially short-range and repulsive
4. steric forces, which are dependent on the geometry and conformation of molecules (particularly macromolecules) at the particle interface
5. solvation forces due to changes in quantities of adsorbed solvent on the very close approach of neighbouring particles.
Independent consideration of the electrostatic repulsion and van der Waals forces of attraction by Derjaguin and Landau (in 1941) and by Verwey and Overbeek (in 1948) produced a quantitative approach to the stability of hydrophobic suspensions, known as the DLVO theory of colloid stability.
Van der Waals forces between particles of the same kind are always attractive. The multiplicity of interactions between pairs of atoms or molecules on neighbouring particles must be taken into account in the calculation of attractive forces. Hamaker (in 1937) first determined equations for these forces on the basis of the additivity of van der Waals energies between neighbouring molecules, assuming that the energies of attraction varied with the inverse sixth power of the distance between them. At greater separations of the particles, the power law changes to the inverse seventh power. The model considers two spherical particles of radius a at a distance H, R being 2a + H (Fig. 6.3).
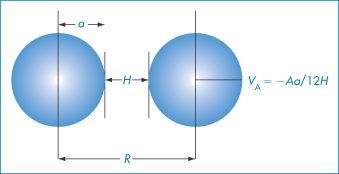
Figure 6.3 Diagram of the interaction between two spheres of radius a at a distance of separation H with a centre-to-centre distance of (R = H + 2a) used in calculating energies of interaction.
Hamaker calculated the energy of attraction, VA, to be
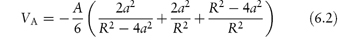
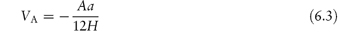
The Hamaker constant, A, depends on the properties of the particles and of the medium in which they are dispersed. When H/a is small, that is, when the particles are large relative to the distance of separation, equation (6.2) reduces to the simpler form:
The electrical charge on particles is due either to ionisation of surface groups or to adsorption of ions that confer their charge to the surface. A particle surface with a negative charge is shown in Fig. 6.4 along with the layer of positive ions that are attracted to the surface in the Stern layer, and the diffuse or electrical double layer that accumulates and contains both positive and negative ions.
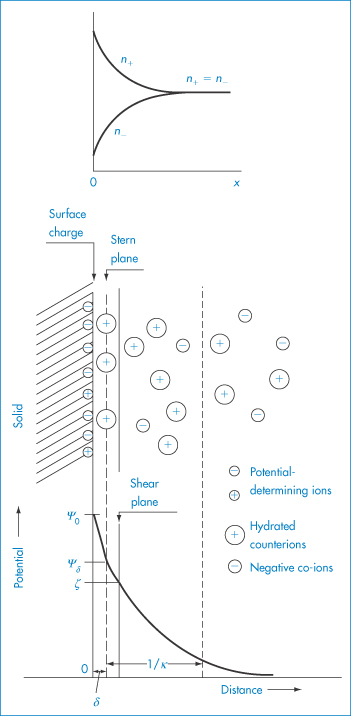
Figure 6.4 Representation of the conditions at a negative surface, with a layer of adsorbed positive ions in the Stern plane. The number of negative ions increases and the number of positive ions decreases (see upper diagram) as one moves away from the surface, the electrical potential becoming zero when the concentrations are equal. The surface potential, ψ0, and the potential at the Stern plane, ψδ, are shown. As the particle moves, the effective surface is defined as the surface of shear, which is a little further out from the Stern plane, and would be dependent on surface roughness and adsorbed macromolecules. It is at the surface of shear that the zeta potential, ζ, is located. The thickness of double layer is given by 1/κ.
Electrostatic forces arise from the interaction of the electrical double layers surrounding particles in suspension (Fig. 6.4). This interaction leads to repulsion if the particles have surface charges and surface potentials of the same sign and magnitude. When the surface charge is produced by the adsorption of potential-determining ions, the surface potential, ψ0, is determined by the activity of these ions and remains constant during interaction with other particles, if the extent of adsorption does not change. The interaction therefore takes place at constant surface potential. In emulsion systems where the adsorbed layers can desorb, or in conditions of low availability of potential-determining ions, the interaction takes place not at constant surface potential but at constant surface charge (or at some intermediate state). The electrostatic repulsive force decays as an exponential function of the distance and has a range of the order of the thickness of the electrical double layer, equal to the Debye–Hückel length, l/κ:
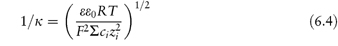
where ε0 is the permittivity of the vacuum, ε is the dielectric constant (or relative permittivity) of the dispersion medium, R is the gas constant, T is temperature, F is the Faraday constant and ci and zi are the concentration and the charge number of the ions of type i in the dispersion medium. For monovalent ions in water, c = 10−15κ2 (with c in mol dm−3 and κ in cm−1). No simple equations can be given for the repulsive interactions. However, for small surface potentials and low values of κ (that is, when the double layer extends beyond the particle radius) and at constant ψ0, the repulsive energy is
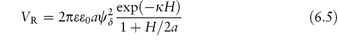
For small values of ψδ and exp (−κH) this simplifies to

The equations do not take into account the finite size of the ions; the potential to be used is ψδ, the potential at the Stern plane (the plane of closest approach of ions to the surface), which is difficult to measure. The nearest experimental approximation to ψδ is often the zeta potential (ζ) measured by electrophoresis.
In the DLVO theory the combination of the electrostatic repulsive energy VR with the attractive potential energy VA gives the total potential energy of interaction: Vtotal = VA + VR.
Vtotal plotted against the distance of separation H gives a potential energy curve showing certain characteristic features, illustrated in Fig. 6.5. The maximum and minimum energy states are shown. If the maximum is too small, two interacting particles may reach the primary minimum and in this state of close approach the depth of the energy minimum can mean that escape is improbable. Subsequent irreversible changes in the system may then occur, such as sintering and recrystallisation in suspensions or coalescence in emulsions forming irreversible structures. When the maximum in Vtotal is sufficiently high, the two particles do not reach the stage of being in close contact. The depth of the secondary minimum is important in determining events in a hydrophobic dispersion. If the secondary minimum is smaller than the thermal energy, kT (where k is the Boltzmann constant), the particles will always repel each other, but when the particles are large enough the secondary minimum can trap particles for some time as there is no energy barrier to overcome. At intermediate distances the energy of repulsion may be the larger of the two.
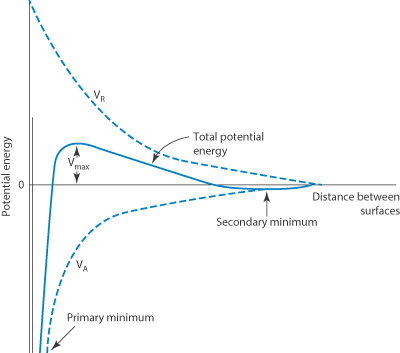
Figure 6.5 Schematic form of the curve of total potential energy (Vtotal) against distance of surface separation (H) for interaction between two particles, with Vtotal = VA + VR.
Effect of electrolytes on stability
Pharmaceutical colloids are rarely simple systems. Suspensions, except for some nanosuspensions, rarely comprise only particles of a single size; they usually also contain additives. The influence of these, including electrolytes, has to be considered. Electrolyte concentration and valence (z) are accounted for in the term (Σcizi2) in equation (6.4) and thus in equations (6.5) and (6.6). Figure 6.6 gives an example of the influence of electrolyte concentration on the electrostatic repulsive force. As the electrolyte concentration is increased, κ increases due to compression of the double layer with consequent decrease in l/κ.
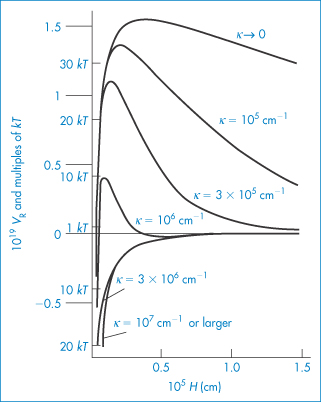
Figure 6.6 The energy of interaction of two spherical particles as a function of the distance, H, between the surfaces. For monovalent ions c (mol dm−3) = 10−15κ2 (cm−1). In this example, a = 10−5 cm, A = 10−19 J and ψ0 = RT/F = 26.5 mV.
Reproduced from Overbeek J Th. Recent developments in the understanding of colloid stability. J Colloid Interface Sci 1977;58:408. Copyright Elsevier 1977.
At low electrolyte concentrations (low κ) the double layer is diffuse and VR extends to large distances around the particles. Summation of VR and VA gives a total energy curve having a high primary maximum but no secondary minimum. The decrease of the double layer when more electrolyte is added produces a more rapid decay in VR and the resultant total-energy curve now has a small primary maximum but, more importantly, a secondary minimum. This concentration of electrolyte would produce a stable suspension, since flocculation could occur in the secondary minimum and the small primary maximum would be sufficient to prevent coagulation in the primary minimum. At high concentrations of added electrolyte, the range of VR would be so small that the van der Waals attractive forces would dictate the shape of the total energy curve. As a consequence, this curve has no primary maximum, so the dispersion would be unstable with no energy barrier to prevent coagulation of the particles in the primary minimum. The practical importance of this can be seen when nanoparticles are dispersed in cell culture media with high levels of electrolyte and flocculate as a result.
We can see from equation (6.4) that the magnitude of the effect of an electrolyte of a given concentration on VR also depends on the valence of the ion of opposite charge to that of the particles (the counterion): the greater the valence of the added counterion, the greater its effect on VR. These generalisations are known as the Schulze–Hardy rule. Note that it does not matter which particular counterion of a given valence is added.
Effect of surface potential on stability
A second parameter that influences the shape of the total energy curve is the surface potential of the particles. We can see from equation (6.5) that VR will increase with an increase in ψ0; the changes that occur in the total curve are seen in Fig. 6.7. There is a decrease in the primary maximum as the surface potential decreases and you should note the appearance of a secondary minimum at the intermediate value of ψ0 (see curve C).
Figure 6.7 The influence of the surface potential (ψ0) on the total potential energy of interaction of two spherical particles.
6.2.2 Repulsion between surfaces with macromolecular stabilisers
The increasing use of non-ionic macromolecules as stabilisers, which has occurred since the origins of the DLVO theory, has led to the awareness of other stabilising forces. The approach of particles with hydrated macromolecules adsorbed to their surfaces leads, on the interaction of these layers, to repulsion (Fig. 6.8), because of the consequent positive enthalpy change (+ΔH) that ensues. In more general terms, the approach of two particles with adsorbed stabilising chains leads to a steric interaction when the chains interact. The repulsive forces may not always be enthalpic in origin. Loss of conformational freedom leads to a negative entropy change (−ΔS). Each chain loses some of its conformational freedom and its contribution to the free energy of the system is increased, leading to repulsion. This volume restriction is compounded by an ‘osmotic effect’ that arises as the macromolecular chains on neighbouring particles crowd into each other’s space, increasing the concentration of chains in the overlap region. The repulsion that arises is due to the osmotic pressure of the solvent attempting to dilute out the concentrated region: this can only be achieved by the particles moving apart.
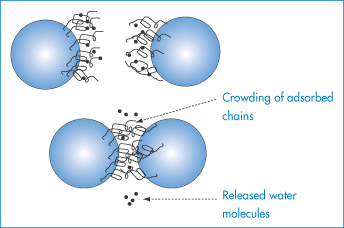
Figure 6.8 Enthalpic stabilisation: representation of enthalpic stabilisation of particles with adsorbed hydrophilic chains. The hydrated chains of the polyoxyethylene molecules —(OCH2CH2)nOH protrude into the aqueous dispersing medium. On close approach of the particles to within 2δ (twice the length of the stabilising chains), hydrating water is released, resulting in a positive enthalpy change which is energetically unfavourable.
Quantitative assessment of the steric effect depends on three parameters:
1. the hydrophilic polymer chain length, δ
2. the interaction of the solvent with the chains
3. the number of chains per unit area of interacting surface.
The steric effect does not come into play until H = 2δ, so the interaction increases suddenly with decreasing distance. There are many problems in applying such equations in practice, the main ones being the lack of an accurate knowledge of δ, and the difficulty in taking account of desorption and changes in chain conformation or solvation during interaction. When the steric contribution is combined with the electrostatic and van der Waals interactions, a minimum in the energy at large separations still obtains, but repulsion is generally evident at all shorter distances, provided that the adsorbed macromolecules or surfactants do not desorb into the continuous phase or otherwise move away from the points of interaction (Fig. 6.9).
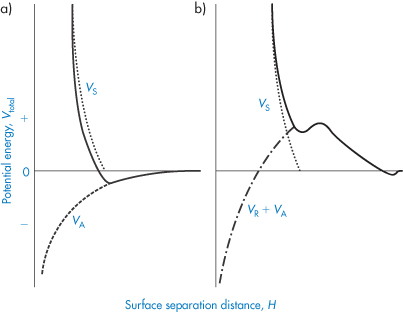
Figure 6.9. Entropic (steric) stabilisation: the potential energy–distance plots for (a) particles with no electrostatic repulsion, Vtotal = VS + VA and (b) with electrostatic repulsion, Vtotal = VS + VA + VR.
For particles with a hydrated stabilising layer of thickness δ, the volume of the overlapping region (Vov) is as derived as described in Fig. 6.10:
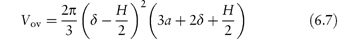
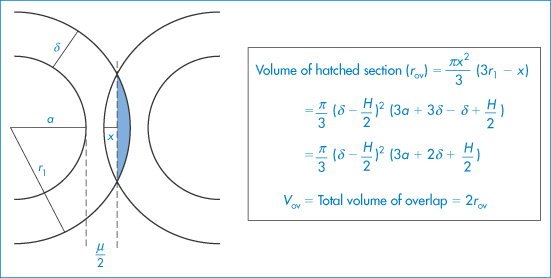
Figure 6.10 The model used in the derivation of equation (6.7): particles of radius a with adsorbed layer of thickness δ approach to a distance H between the particle surfaces; r1 = (a + δ) and x is the distance between the surface and the line bisecting the volume of overlap.
Copyright (© 1967). Reproduced from Ottewill RH. In: Schick MJ (ed.) Nonionic Surfactants. New York: Marcel Dekker; 1967. Reproduced by permission of Taylor and Francis Group LLC, a division of Informa plc.
The difference between chemical potential in the overlap volume and the potential when the particles are at an infinite distance apart is a measure of the repulsive force, an osmotic force, caused by the increased concentration of the polymer chains in the region of overlap. This can be written in terms of free energy as

Substituting for πE (where πE = RTBc2) and using R = kNA, where k is the Boltzmann constant and B the second virial coefficient, we obtain
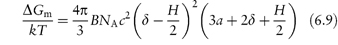
where c is the concentration of surfactant in the interfacial layer and NA is the Avogadro constant. This equation probably appears more complex than it is. Apart from telling us the effect of increasing or decreasing δ, for example, by using different polymers of different length (δ), we can find out the effect of temperature and additives, as B is proportional to (1 − θ/T), where θ is the temperature (the theta temperature) at which the polymer and solvent have no affinity for each other. Thus when T = θ, B tends to zero, and the stabilising influence of the hydrated layer disappears, as hydration is lost. Heating reduces ΔGm in this case. Additives that salt out the macromolecules from solution will have the same effect.
The requirement for the strict applicability of the equations is that the particles are monosized, which is rarely the case with pharmaceutical emulsions and suspensions. Where particles of two radii, a1 and a2, interact, equation (6.3) is modified to:
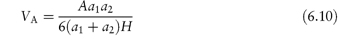
Similarly, VR is expressed by an analogue of equation (6.5), namely,
where ψ1 and ψ2 are the surface potentials of particles 1 and 2.
These equations have been applied not only to the study of suspensions but to the reversible interaction of microbial cells with a solid substrate such as glass before permanent adhesion occurs due to the formation of polymeric bridges between cell and glass.
|
lyophobic (solvent hating) (= hydrophobic in aqueous systems) or lyophilic (= hydrophilic in aqueous systems).
The disperse phase is the phase that is subdivided/dispersed. The continuous phase is the phase in which the disperse phase is distributed.
|

6.3 Disperse system flow
Colloidal systems, whether suspensions or emulsion, have flow and viscous properties which are important in a number of pharmaceutical processes. Figure 6.11 links some of these together: blood is a suspension and mixing nanoparticles with blood results in more complex flow patterns; aerosol formation and the related spray drying and spray coating of solid-dosage forms with solutions or suspensions, as well as the spreading of these systems on solid surfaces are topics which arise in many pharmaceutical domains (see e.g. Chapter 1). The movement of particles in vivo in tissues, and their escape from the circulation after intravenous (IV) injection, are important features in determining their ability to arrive at biological targets (see Chapter 14). Liquid droplets in emulsions which are spherical but also deformable can often negotiate capillaries and tracks which suspensions cannot. So the opportunity for emulsions to jam is reduced compared to suspensions, where particle asymmetry may also be a determinant in flow characteristics. Surface/interfacial tension has a key role in determining emulsion behaviour.
Figure 6.11 Varied aspects of the flow and viscosity of solutions and disperse systems (suspension or emulsion), which pervade many processes in vitro and in vivo, are listed here. Flow properties of suspensions are important factors in successful spray coating and spray drying, as well as the spreading of liquid dispersions on surfaces, as in the film coating of tablets (discussed in Chapter 1). Aerosol properties will also be determined by the behaviour of the primary suspension or solution. The high viscosity of concentrated drug suspensions (or solutions, for example of proteins) can lead to problems with injectability and the spread of any depot after intramuscular injection.
In this section we will examine the various types of flow, commencing with the simplest type of flow, Newtonian flow, which may be exhibited by dilute colloidal solutions and then considering the various types of non-Newtonian flow, which are exhibited by the more complex colloidal systems.
Newtonian flow
We can imagine the flow of a liquid as the movement of imaginary planes within the liquid, over each other. The internal resistance offered to the relative motion of these planes causes a retardation of flow. Figure 6.12 shows the flow of a liquid through a narrow tube as the movement of a series of concentric annuli. As you can see, the flow rate is highest in the centre of the tube and gradually decreases across the tube, reaching a minimum value at the tube walls. The gradient of velocity, u, in a direction, x, at right angles to the wall, i.e. du/dx, is the shear rate, D. The external force which is required to overcome the internal friction and to cause movement is called the shear force, F, or when it refers to unit surface area, A, is called the shear stress, τ.
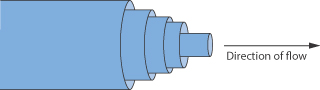
Figure 6.12 Diagrammatic representation of the flow of a liquid through a narrow tube as the movement of a series of concentric annuli.
In a Newtonian liquid, the velocity gradient or shear rate is directly proportional to the shear stress, and the proportionality constant is the coefficient of viscosity, or more simply the viscosity,  , i.e. τ = ηD. Viscosity has units of N m–2 s. This unit replaces the former unit, the poise P, and the two units can be interconverted using

The centipoise, cP, is still widely used and is a convenient measure of viscosity since water has a viscosity of 1 cP at 20°C.
The viscosity may be combined with the density, ρ, using the kinematic viscosity, υ = η/ρ. Kinematic viscosity has units of m2 s–1 which are related to the former unit, the stokes, St, by

Although not an SI unit, centistokes, cSt, retain their use in describing the viscosity grade of several polymers, for example the silicones (see section 7.5.3).
The flow behaviour of a colloidal solution may be represented by plots of shear stress, τ, against shear rate, D, as shown in Fig. 6.13. In Newtonian flow, the viscosity is independent of the shear rate and this is characterised by linear plots of τ against D. The gradient of these plots is  (Example 6.1).
|
The following data were obtained in a study of the shear stress, τ, of a dilute emulsion as a function of shear rate, D. D (s–1)1.02.43.64.66.07.1 τ (mN m–2)2.66.3 9.412.015.718.6 Show that the emulsion exhibits Newtonian flow properties and determine its viscosity. Answer The plot of τ (as ordinate) against D (as abscissa) is linear and hence the dilute emulsion exhibits Newtonian flow. The gradient, τ /D = 2.6 mN m–2 s, is equal to the viscosity, |


In deriving an equation for the viscosity of a colloidal dispersion of spherical particles, Einstein considered particles that were far enough apart to be treated independently. The particle volume fraction is defined by
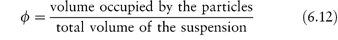
The dispersion is assigned an effective viscosity,  , given by

where  0 is the viscosity of the suspending fluid. Various terms may be used to describe the viscosity characteristics:
- the relative viscosity,
 rel, is the ratio
  */
*/ 0
0
- the specific viscosity,
 sp, is
  rel – 1
- the reduced viscosity is the ratio
 sp/ø
sp/ø
- the intrinsic viscosity, [
 ] is the value of
  sp/ø extrapolated to zero volume fraction.
Hence from equation (6.13), the intrinsic viscosity in an ideal dispersion should equal 2.5. As we have seen, the assumptions involved in the derivation of the Einstein equation do not hold for colloidal systems subject to Brownian forces, electrical interactions and van der Waals forces. Brownian forces result from ‘the random jostling of particles by the molecules of the suspending fluid due to thermal agitation and fluctuation on a very short time scale’. The coefficient 2.5 in Einstein’s equation (6.13) applies only to spheres; asymmetric particles will produce coefficients greater than 2.5, as shown in Example 6.2.
|
The viscosity of a colloidal dispersion was measured as a function of concentration, c, with the following results.
c (% w/v)0.51.101.652.152.753.50 If the viscosity of the continuous phase was 0.903 mN m–2 s, determine the intrinsic viscosity of the dispersed particles assuming Newtonian flow properties and assuming that the volume fraction can be equated to the concentration. Answer At each concentration, calculate values of
A plot of |


Other problems in deriving a priori equations result from the polydisperse nature of pharmaceutical dispersions. The particle size distribution will determine  . A polydisperse dispersion of spheres has a lower viscosity than its monodisperse equivalent. Structure formation during flow is an additional complication and results in non-Newtonian flow properties, as illustrated below. Examples of non-Newtonian flow in emulsions and suspensions will be considered in sections 6.4.12 and 6.7.3, respectively.
Non-Newtonian flow
When shear stress and shear rate are not linearly related the flow is described as non-Newtonian. There are several types of flow behaviour.
Shear thinning (pseudoplastic flow)
When the apparent viscosity decreases with increasing shear rate, we say that the fluid exhibits shear thinning or pseudoplastic flow. This type of flow is compared with Newtonian flow in Fig. 6.13a. Since the apparent viscosity is derived by drawing tangents to this plot, it will generate the type of rheogram shown in Fig. 6.13b. Shear thinning is particularly common to colloidal dispersions containing asymmetric particles such as methyl cellulose or tragacanth. These particles provide the greatest resistance to flow when they are randomly oriented at low-velocity gradients. As the shear rate is gradually increased, they begin to align themselves with the flow lines and their resistance to flow is greatly reduced. Eventually, at high rates of shear, alignment is complete and the viscosity becomes constant. This type of flow is also characteristic of systems in which particle aggregation occurs. Under shear, these aggregates break down, releasing some of the solvent which they have immobilised, thus lowering the viscosity of the system.
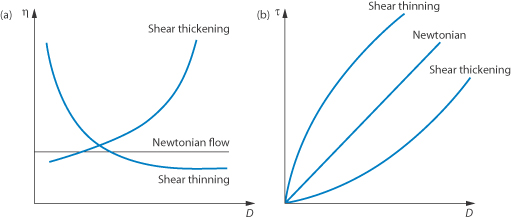
Figure 6.13 Plots of (a) apparent viscosity  against shear rate D and (b) shear stress τ against shear rate D, comparing Newtonian and non-Newtonian flow characteristics.
There are several mathematical relationships describing pseudoplastic flow; we will consider only the equation proposed by Ostwald:

where K is a constant, often called the consistency index, and n is a number less than 1, referred to as the flow behaviour index. When n = 1, equation (6.14) represents Newtonian flow and K is the viscosity.
We can show that a system exhibits pseudoplastic flow by plotting rheological data using equation (6.14) in its logarithmic form

Linearity of plots of log shear stress, τ, as a function of log shear rate D, demonstrates shear-thinning behaviour; values of flow behaviour index and consistency index may be obtained from the gradient and intercept of the plot, respectively, as shown in Example 6.3.
|
The following data were obtained in a study of the shear stress, τ, as a function of shear rate, D, for a colloidal dispersion. D (s–1)246810 τ (Pa)140181210234253 Show graphically that the dispersion exhibits shear-thinning behaviour and determine values for the consistency index and the flow behaviour index. Answer A plot of log τ (as ordinate) against log D (as abscissa) should be linear, showing that the dispersion exhibits shear-thinning behaviour. The flow behaviour index n determined from the gradient = 0.36. The intercept = 2.04 = log K, hence the consistency index = 109.6 |

Shear thickening (dilatancy)
In this type of flow the apparent viscosity increases with increasing shear rate (see Fig. 6.13a). Dilatant systems obey equation (6.14) with a value of n > 1.
A well-known example of the dilatant effect is the drying out of wet sand when it is walked upon. As the shear rate is increased when the sand is compressed, the dense packing is broken down to allow the particles to flow past each other. The resulting expansion leaves insufficient liquid to fill the voids and the system apparently ‘dries out’. The dry footprint soon becomes wet again as the pressure is released. Similarly, starch paste stirs easily if you stir it slowly but soon thickens up and resists stirring if you try to stir it quickly.
Plastic flow
This type of flow is similar to shear thinning except that the system does not flow noticeably until the shear stress exceeds a certain minimum value, called the critical shear stress, τ0. At high shear stresses the rheogram may become linear (Fig. 6.14), in which case we say that the system exhibits Bingham flow. Several characteristics describing the flow properties may be obtained from the rheogram – the shear stress at the point where the plot becomes linear is called the upper yield stress, extrapolation of the linear portion of the rheogram to zero shear rate gives the extrapolated yield stress and the shear stress at which flow is first observed (i.e. τ0) is the lower yield stress (Example 6.4) Some substances show a non-linear relationship between shear rate and shear stress after yielding and these are called Casson bodies.
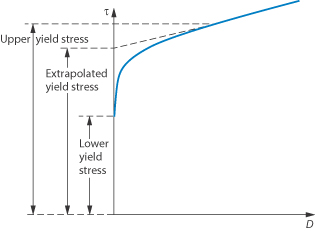
Figure 6.14 A plot of shear stress τ against shear rate D for a colloidal dispersion exhibiting plastic flow properties.
|
The shear stress τ of a concentrated emulsion was determined at a series of shear rates, D, with the following results. τ (N m–2)103112 120 127 136 146 157 166 176 D (s–1 )0.50 1.01.5 2.03.0 4.05.0 6.07.0 Describe the flow characteristics of this emulsion, giving values of rheological parameters which characterise the flow properties. Answer A plot of τ against D yields the following values: Lower yield stress = 80 N m–2 Extrapolated yield stress = 107 N m–2 Upper yield stress = 122 N m–2 |

Thixotropy and rheopexy
Both of these terms refer to time-dependent phenomena. In a thixotropic system the apparent viscosity decreases as a continuous shear stress is applied at a constant rate of shear. If this system is allowed to stand for a while it regains its structure and its shear stress returns to its original value when shearing is recommenced at the same shear rate. A consequence of this time-dependent effect is that the rheogram exhibits a hysteresis loop, as seen in Fig. 6.15a, when the shear rate is first increased and then decreased. Solutions of high-molecular-weight polymers are generally thixotropic because of chain entanglements, which are gradually reduced on shearing and then reform on standing due to Brownian motion.
The apparent viscosity of rheopectic substances increases as continuous shear stress is applied at a constant rate of shear and then returns to its initial value after a regeneration period. This type of flow results in a hysteresis loop of the type shown in Fig. 6.15b.
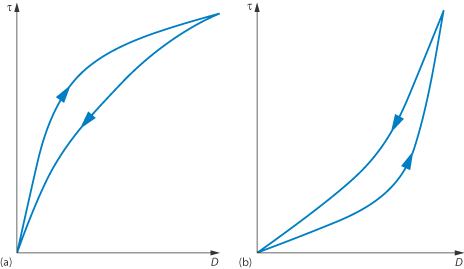
Figure 6.15 Plots of shear stress τ against shear rate D for colloidal dispersions exhibiting (a) thixotropic and (b) rheopectic flow properties showing hysteresis loops resulting from time-dependent flow.
Viscoelasticity
Many dispersed systems exhibit the properties of both solids and liquids when a constant small shear stress is applied, i.e. they flow but they also show elasticity. When such dispersions are stressed they deform and the increase in deformation (strain) as a function of time is called creep. Creep compliance is the ratio of the strain to the applied constant stress. In the creep testing of a colloidal dispersion, the stress is applied for a given time and then removed and the recovery with time is studied. Figure 6.16 shows a typical plot of creep compliance against time curve. As soon as a stress is applied there is an immediate strain, which is represented by AB. This is called the instantaneous elastic compliance, J0, and is the region in which the bonds between the primary structural units in the system stretch elastically. The curvature in the region BC gradually decreases and eventually the increase of creep compliance with time becomes linear over the region CD. The region BC represents the retarded elastic compliance, JR, and CD is the region of Newtonian compliance JN. When the stress at D is removed there is an instantaneous elastic recovery over the region DE, followed by a retarded elastic recovery over the region EF and then an eventual flattening of the curve beyond F. The vertical distance, FG, to the time abscissa represents the non-recoverable strain per unit stress and this is related to the degree of structural alteration which has occurred during the test.
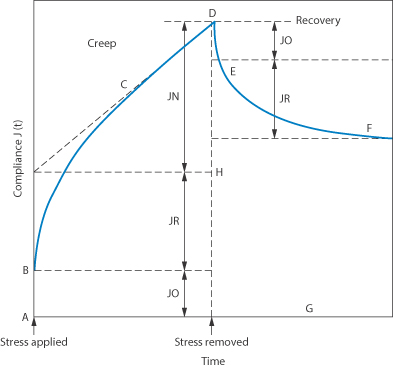
Figure 6.16 Model plot of creep compliance against time. A–B is the region of instantaneous elastic modulus (compliance) in which the bonds between the primary structure units in the system stretch elastically. B–C is a time-dependent region. C–D is a region of Newtonian compliance; here some bonds rupture but do not reform in the period of the test. On removal of the stress the recovery curve is given by DF. An instantaneous elastic recovery (D–E) of the same magnitude as (A–B) is followed by retarded elastic recovery to E–F. As bonds were irreversibly broken during the period of applied stress, this part of the structure is not recovered; hence F–G is equal to D–H.
6.4 Emulsions
Emulsions – liquid dispersions usually of an oil/lipid phase and an aqueous phase – are a traditional pharmaceutical dosage form. Oil-in-water (o/w) systems have enjoyed a renaissance as vehicles for the delivery of lipid-soluble drugs (as with the anaesthetic propofol). Their use as a delivery system necessitates an understanding of the factors governing the formulation and stability of o/w and w/o emulsions, multiple emulsions (w/o/w or o/w/o) and microemulsions, which occupy a position between swollen micelles and emulsions with very small globule sizes. Photomicrographs of o/w, w/o systems and multiple emulsions are shown in Fig. 6.17. It is also possible to formulate emulsions without water. Non-aqueous or anhydrous emulsions can also be formulated as o1/o2 systems or as oil in a polar solvent emulsions, as well as multiple oil-in-oil-in-oil systems or variants.
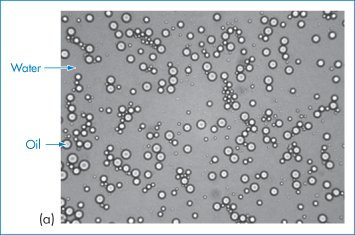
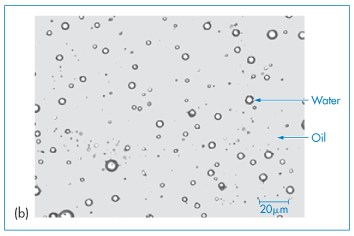
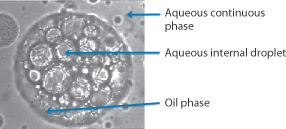
Figure 6.17 Photomicrograph of emulsions: (a) an oil-in-water (o/w) emulsion, (b) a water-in-oil (w/o) system, (c, bottom figure) a water-in-oil-in-water emulsion, in which the internal water droplets can be seen in the larger oil droplets.
6.4.1 Stability of o/w and w/o emulsions
Adsorption of a surfactant at the oil–water interface, by lowering interfacial tension during manufacture, aids the dispersal of the oil into droplets of a small size and maintains the particles in a dispersed state (Fig. 6.18). Unless the interfacial tension is zero, there is a natural tendency for the oil droplets to coalesce to reduce the area of oil–water contact, but the presence of the surfactant monolayer at the surface of the droplet reduces the possibility of collisions leading to coalescence. Charged surfactants will lead to an increase in negative or positive zeta potential and will thus help to maintain stability by increasing VR. Non-ionic surfactants such as the alkyl or aryl polyoxyethylene ethers, sorbitan polyoxyethylene derivatives, sorbitan esters and polyoxyethylene–polyoxypropylene–polyoxyethylene ABA block copolymers are widely used in pharmaceutical emulsions because of their lack of toxicity and their relatively low sensitivity to additives. These non-ionic stabilisers adsorb on to the emulsion droplets and, although they generally reduce zeta potentials, they maintain stability by creating a hydrated layer on the hydrophobic particle in o/w emulsions. They effectively convert a hydrophobic colloidal dispersion into a hydrophilic dispersion.
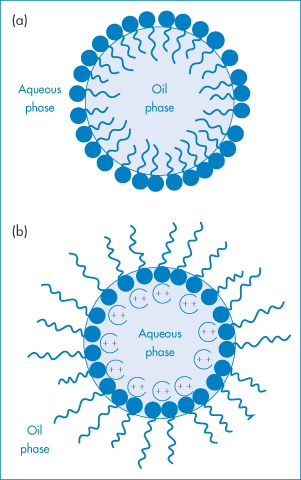
Figure 6.18 Surfactant films at the water–oil interface in o/w and w/o emulsions: (a) formation of a monomolecular film at the oil–water interface for the stabilisation of o/w emulsions; (b) stabilisation of w/o emulsions by the oriented adsorption of divalent soap salts (not to scale).
In w/o emulsions the hydrocarbon chains of the adsorbed molecules protrude into the oily continuous phase. Stabilisation arises from steric and enthalpic forces, as described in section 6.2.2; there is also a barrier to coalescence that is due to the presence of surfactant or polymer molecules and their effect on the elasticity of the interface. Emulsions are more complex than suspensions, because of the possibility (a) of movement of the surfactant into either the continuous or disperse phase; (b) of micelle formation in both phases; and (c) of formation of liquid crystalline phases between the disperse droplets.
It is usually observed that mixtures of surfactants form more stable emulsions than do single surfactants. This may be because complex formation at the interface results in a more ‘rigid’ stabilising film. Certainly where complex films can be formed, such as between sodium lauryl sulfate and cetyl alcohol, the stability of emulsions prepared with such mixtures is high. Theory has not developed to an extent that it can readily cope with mixtures of stabiliser molecules. Complex formation between surfactant and cosurfactants in the bulk phase of emulsion systems is dealt with in section 6.4.7, as this frequently leads to semisolid systems of high intrinsic stability.
6.4.2 HLB system
In spite of many advances in the theory of stability of lyophobic colloids, resort has still to be made to an empirical and practical approach to the choice of an optimal emulsifier, that was devised in 1949 by Griffin. In this system a hydrophile–lipophile balance (HLB) can be calculated for each surfactant. This number is a measure of the relative contributions of the hydrophilic and lipophilic regions of the molecule. The method allows the effective HLB of surfactant mixtures to be calculated.
The HLB number of a surfactant is calculated according to an empirical formula. For non-ionic surfactants the values range from 0 to 20 on an arbitrary scale (Fig. 6.19). At the higher end of the scale the surfactants are hydrophilic and act as solubilising agents, detergents and o/w emulsifiers. To maintain stability, an excess of surfactant is required in the continuous phase; hence, in general, water-soluble surfactants stabilise o/w emulsions and water-insoluble (oil-soluble) surfactants stabilise w/o emulsions. In the stabilisation of oil globules it is essential that there is a degree of surfactant hydrophilicity to confer an enthalpic stabilising force and a degree of hydrophobicity to secure adsorption at the o/w interface. The balance between the two will depend on the nature of the oil and the mixture of surfactants; hence the need to apply the HLB system.
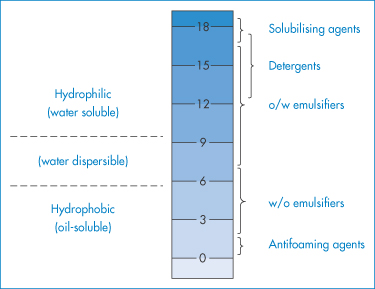
Figure 6.19 The HLB scale and the approximate ranges into which solubilising agents, detergents, emulsifiers and antifoaming agents fall, based on the method devised by Griffin (Griffin WC. Classification of surface active agents by HLB. J Soc Cosmet Chemists 1949; 1:311–326).
The HLB of polyhydric alcohol fatty acid esters such as glyceryl monostearate may be obtained from
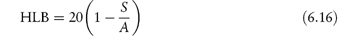
where S is the saponification number of the ester and A is the acid number of the fatty acid. The HLB of polysorbate 20 (Tween 20) calculated using this formula is 16.7, with S = 45.5 and A = 276.
Typically, the polysorbate (Tween) surfactants have HLB values in the range 9.6–16.7; the sorbitan ester (Span) surfactants have HLBs in the lower range of 1.8–8.6.
For those materials for which it is not possible to obtain saponification numbers, for example, beeswax and lanolin derivatives, the HLB is calculated from

where E is the percentage by weight of oxyethylene chains, and P is the percentage by weight of polyhydric alcohol groups (glycerol or sorbitol) in the molecule.
If the hydrophile consists only of oxyethylene groups ([‒CH2CH2O‒], mol wt = 44 Da), a simpler version of the equation is

giving the upper end of the scale (20) for the polyoxyethylene glycol molecule itself. Some HLB values of typical surfactants used in pharmacy are given in Table 6.2. A more detailed list is given in Tables 5.7 and 5.8 in Chapter 5. Example 6.5 shows the application of equations (6.17) and (6.18) in the calculation of the HLB of two typical non-ionic surfactants.
|
Calculate HLB values for (a) Polysorbate 20 and (b) C10H21(CH2 CH2O)8OH Answer a) Polysorbate 20 has a molecular weight of approximately 1300 Da and contains 20 oxyethylene groups and two sorbitan rings. Thus, from equation (6.17)
Hence,
b) The hydrophobic portion of C10H21(CH2 CH2O)8OH is C10H21OH with a molecular weight = 158 Da The polyoxyethylene hydrophilic portion is (CH2 CH2O)8 with a molecular weight = 352 Da Therefore, the weight fraction of polyoxyethylene = 352/(158 + 352) = 0.69 Applying equation (6.18), HLB of C10H21(CH2 CH2O)8OH = 0.69 × 100/5 = 13.8 |


Table 6.2 Typical HLB numbers of some surfactants
Compound | HLB |
Glyceryl monostearate | 3.8 |
Sorbitan monooleate (Span 80) | 4.3 |
Sorbitan monolaurate (Span 20) | 8.6 |
Triethanolamine oleate | 12.0 |
Polyoxyethylene sorbitan monooleate (Tween 80) | 15.0 |
Polyoxyethylene sorbitan monolaurate (Tween 20) | 16.7 |
Sodium oleate | 18.0 |
Sodium lauryl sulfatea | 40.0 |
aAlthough applied mainly to non-ionic surfactants, it is possible to obtain numbers for ionic surfactants.
Group contribution
The HLB system has been put on a more quantitative basis by calculating group contributions or group numbers to the HLB number such that an HLB was obtained from
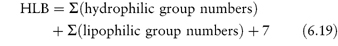
Some group numbers are given in Table 6.3. Equation 6.19 should be applied with caution to non-ionic surfactants, particularly those with a polyoxyethylene chain as the only hydrophilic moiety, where considerable deviation from experimental values is noted.1 Example 6.6 shows the calculation of the HLB for an anionic surfactant using the group contribution method.
|
Calculate the HLB value for sodium dodecyl sulfate (SDS) using the group contribution method. Answer The HLB of CH3(CH2)11SO4Na is calculated from equation (6.19) using the group contributions of Table 6.3 as follows: HLB = Σ(hydrophilic group numbers) + Σ(lipophilic group numbers) + 7 = 38.7 + (12 × –0.475) + 7 = 40.0 The calculated HLB of SDS is 40.0, which agrees with the experimental value in Table 6.2. |

Table 6.3 Group contributions to HLB numbersa
Group | Group number |
Hydrophilic groups | |
‒SO4Na | 38.7 |
‒COONa | 19.1 |
‒SO3Na | 11 |
‒COOH | 2.1 |
Ester (free) | 2.4 |
Hydroxyl (free) | 1.9 |
Hydroxyl (sorbitan) | 0.5 |
‒CH2CH2O- | 0.33 |
Lipophilic groups | |
‒CH‒;‒CH2‒; =CH and ‒CH3 | -0.475 |
Phenyl | -1.66 |
a Values from reference 1.
Choice of emulsifier or emulsifier mixture
Regardless of any theories, the appropriate choice of emulsifier or emulsifier mixture is usually made by preparing a series of emulsions with a range of surfactants of varying HLB values. It is assumed that the HLB of a mixture of two surfactants containing fraction f of A and (l − f) of B is the algebraic mean of the two HLB numbers:

Example 6.7 shows how equation (6.20) may be used to calculate the quantities of a surfactant mixture required to emulsify a mixture of two oils. For reasons not explained by the HLB system, mixtures of high HLB and low HLB give more stable emulsions than do single surfactants. Apart from the possibility of complex formation at the interface, the solubility of surfactant components in both the disperse and the continuous phase maintains the stability of the surfactant film at the interface. Creaming of emulsions (a function of particle size) is observed and is taken as an index of stability. The system with the minimum creaming or separation of phases is deemed to have an optimal HLB. It is therefore possible to determine optimum HLB numbers required to produce stable emulsions of a variety of oils. Table 6.4 shows the required HLB of surfactants to achieve stability of five oils. A more sensitive method would be to determine the mean globule size in emulsions using techniques such as laser diffraction methods to produce data such as those in Fig. 6.20. For a mineral o/w emulsion stabilised by a mixture of two non-ionic surfactants, an optimal HLB of between 7.5 and 8 is identified.
Table 6.4 Required HLB for different oils for o/w emulsion formation
Oil | HLB |
Caprylic/capric triglycerides (medium-chain-length triglycerides) | 5 |
Cottonseed oil | 6 |
Soybean oil | 6 |
Olive oil | 7 |
Hydrogenated castor oil | 8 |
Corn oil | 8 |
Vaseline oil | 8.5 |
Dodecane | 9–9.5 |
Mineral oil | 10–12 |
Cyclohexane | 12 |
Isopropyl myristate | 12 |
Castor oil | 14 |
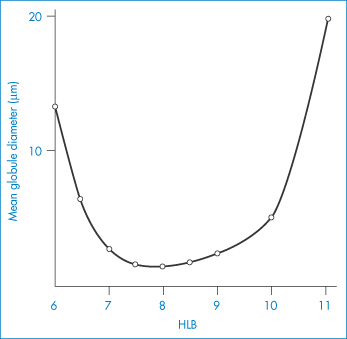
Figure 6.20 Variation of mean globule size in a mineral oil-in-water emulsion as a function of the HLB of the surfactant mixtures present at a level of 2.5%. Surfactants: Brij 92–Brij 96 mixtures.
Source: P. Depraetre, M. Seiller, A. T. Florence and F. Puisieux (unpublished material).
|
Calculate the relative amounts of Tween 80 (HLB 15.0) and Span 80 (HLB 4.3) required to emulsify 100 g of an o/w emulsion containing 35 g olive oil and 5 g isopropyl myristate using a total emulsifier concentration of 4 g. Answer An equation similar to equation (6.20) can be used to calculate the required HLB of the oil mixture: HLBmixture = fO HLBO + (1 – fO) HLBIM where subscripts O and IM refer to olive oil and isopropyl myristate respectively. The weight percentages of olive oil and isopropyl myristate in the 40 g of the oil mixture are 0.875 and 0.125 respectively, hence, using the required HLB values of olive oil (7) and isopropyl myristate (12) from Table 6.4 gives HLBmixture = 0.875 × 7 + 0.125 × 12 = 7.6 Using equation (6.20) to calculate the proportions of the two surfactants required to produce this required HLB gives HLBmixture = fT HLBT + (1 – fT) HLBS where subscripts T and S refer to Tween 80 and Span 80 respectively. 7.6 = fT × 15.0 + (1 – fT) × 4.3 10.7 fT = 3.3 Hence, fT = 0.31 and fS = 0.69. The total weight of emulsifier in the formulation is 4 g, therefore, weight of Tween 80 = 0.31 × 4 = 1.24 g and the weight of Span 80 = 0.69 × 4 = 2.76 g |

At the optimum HLB the mean particle size of the emulsion is at a minimum (Fig. 6.20) and this factor would explain to a large extent the stability of the system (see equations 6.1 and 6.2, for example).
Although the optimum HLB values for forming o/w emulsions are obtained in this way, it is possible to formulate stable systems with mixtures of surfactants well below the optimum. This is sometimes because of the formation of a viscous network of surfactant in the continuous phase. The high viscosity of the medium surrounding the droplets prevents their collision and this overrides the influence of the interfacial layer and barrier forces due to the presence of the adsorbed layer.
The HLB system has several drawbacks. The calculated HLB, of course, cannot take account of the effect of temperature or that of additives. The presence in emulsions of agents that salt in or salt out surfactants will respectively increase and decrease the effective (as opposed to the calculated) HLB values. Salting out the surfactant (for example, with NaCl) will make the molecules less hydrophilic and one can thus expect a higher optimal calculated HLB value for the stabilising surfactant for o/w emulsions containing sodium chloride. Examples are shown in Fig. 6.21, in which the effects of NaCl and NaI are compared.
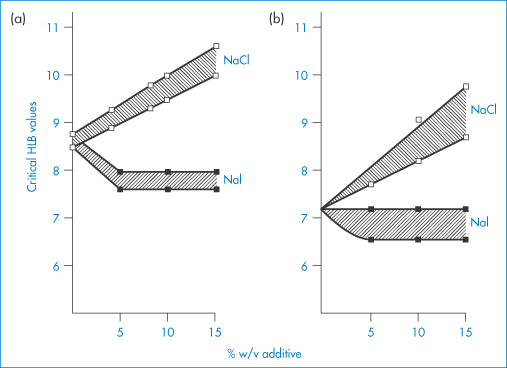
Figure 6.21 The change in critical HLB values as a function of added salt concentration, where the salt is either NaCl or NaI. Results were obtained from measurements of particle size, stability, viscosity and emulsion type as a function of HLB for liquid paraffin-in-water emulsions stabilised by Brij 92–Brij 96 mixtures. Data from different experiments showed different critical values; hence, on each diagram hatching represents the critical regions while data points actually recorded are shown. Results in (a) show particle size and stability data; those in (b) show the HLB at transition from pseudoplastic to Newtonian flow properties (see section 6.4.12) and emulsion type (o/w → w/o transitions).
Reproduced from Florence AT et al. Emulsion stabilization by non-ionic surfactants: the relevance of surfactant cloud point.J Pharm Pharmacol 1975;27:385. Copyright Wiley-VCH Verlag GmbH & Co. KGaA. Reproduced with permission.
6.4.3 Multiple emulsions
Multiple emulsions are emulsions whose disperse phase contains droplets of another phase (Fig. 6.17). Water-in-oil-in-water (w/o/w) or o/w/o emulsions may be prepared, both forms being of interest as drug delivery systems. w/o emulsions, in which a water-soluble drug is dissolved in the aqueous phase, may be injected by the subcutaneous or intramuscular routes to produce a delayed-action preparation. To escape, the drug has to diffuse through the oil to reach the tissue fluids. The main disadvantage of a w/o emulsion is generally its high viscosity, brought about through the influence of the oil on the bulk viscosity. Emulsifying a w/o emulsion using surfactants that stabilise an oily disperse phase can produce w/o/w emulsions with an external aqueous phase and lower viscosity than the primary emulsion. On injection, into muscle, for example, the external aqueous phase dissipates rapidly, leaving behind the w/o emulsion. Nevertheless, biopharmaceutical differences have been observed between w/o and multiple emulsion systems (Fig. 6.22).

Figure 6.22 Blood levels of 5-fluoro(3H)uracil (5-FU) following intramuscular injection of (●) an aqueous solution, (□) a w/o emulsion prepared with hexadecane, and a w/o/w emulsion prepared with ( ) isopropyl myristate or (■) hexadecane as the oil phase.
Physical degradation of w/o/w emulsions can arise by several routes (Fig. 6.23a):
- coalescence of the internal water droplets
- coalescence of the oil droplets
- rupture of the oil film separating the internal and external aqueous phases
- osmotic flux of water to and from the internal droplets, possibly associated with inverse micellar species in the oil phase.
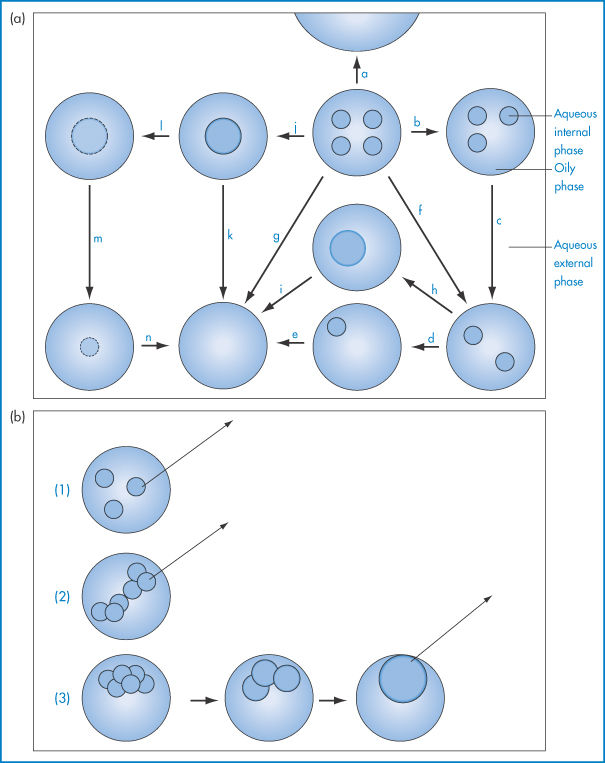
Figure 6.23 (a) Possible breakdown pathways (see text) in w/o/w multiple emulsions. (b) Diagrammatic representation of mechanisms of drug release. See text for explanation.
(a) Reproduced from Whitehill D, Florence AT. Some features of breakdown in water-in-oil-in-water multiple emulsions. J Colloid Interface Sci 1981;79:243–256. Copyright Elsevier 1981.
(b) After Davis SS. J Clin Pharm 1976;1:11.
The external oil particles may coalesce with others (which may or may not contain internal aqueous droplets), as in route (a); the internal aqueous droplets may be expelled individually (routes b, c, d, e) or more than one may be expelled (route f), or less frequently they may be expelled in one step (route g); the internal droplets may coalesce before being expelled (routes h, i, j, k); or water may pass by diffusion through the oil phase, gradually resulting in shrinkage of the internal droplets (routes l, m, n). Figure 6.23 is of course oversimplified; in practice the number of possible combinations is large. Several factors will determine the breakdown mechanisms in a particular system, but one of the main driving forces behind each step will be the reduction in the free energy of the system brought about by the reduction in the interfacial area.
Mechanisms of drug release from multiple emulsion systems include diffusion of the drug molecules from the internal droplets (1), from the medium of the ‘external’ droplets (2), or by mass transfer due to the coalescence of the internal droplets (3), as shown in Fig. 6.23b.
6.4.4 Non-aqueous emulsions
Relatively few studies have been carried out on non-aqueous emulsions, but these can be useful as topical vehicles or reservoirs for the delivery of hydrolytically unstable drugs.2 Systems such as castor oil or propylene glycol in silicone oil can be formulated using silicone surfactants; the HLB number clearly does not help in formulation in these cases, especially if the continuous phase has low polarity. For hydrocarbon–formamide emulsions, surfactants that stabilise aqueous systems can be used, taking into account the change in effective HLB number of the replacement for the aqueous phase. The key to stabilisation lies in the sufficient solubility of the emulsifier in the continuous phase.
6.4.5 Microemulsions
Microemulsions consist of apparently homogeneous transparent systems of low viscosity that contain high concentrations (15–25%) of emulsifier mixture. They were first described by J. T. Schulman3 as disperse systems with spherical or cylindrical droplets in the size range 8–80 nm. They are essentially swollen micellar systems, but obviously the distinction between a swollen micelle and small emulsion droplet is difficult to assess.
Microemulsions form spontaneously when the components are mixed in the appropriate ratios and are thermodynamically stable. In their simplest form, microemulsions are small droplets (diameter 5–140 nm) of one liquid dispersed throughout another by virtue of the presence of a fairly large concentration of a suitable combination of surfactants. They can be dispersions of oil droplets in water (o/w) or water droplets in oil (w/o). An essential requirement for their formation and stability is the attainment of a very low interfacial tension, γ. Since microemulsions have a very large interface between oil and water (because of the small droplet size), they can only be thermodynamically stable if the interfacial tension is so low that the positive interfacial energy (given by γA, where A is the interfacial area) can be compensated by the negative free energy of mixing ΔGm. We can calculate a rough measure of the limiting value required as follows: ΔGm is given by −T ΔSm (where T is the temperature), and the entropy of mixing (ΔSm) is of the order of the Boltzmann constant. Hence kBT = 4πr2γ. Therefore, for a droplet radius r of about 10 nm, an interfacial tension of 0.03 mN m−1 would be required. The role of the surfactants in the system is thus to reduce the interfacial tension between oil and water (typically about 50 mN m−1) to this low level.
Cosurfactants
With the possible exception of double-alkyl chain surfactants and a few non-ionic surfactants, it is generally not possible to achieve the required interfacial area with the use of a single surfactant. If, however, a second amphiphile (cosurfactant) is added to the system, the effects of the two surfactants can be additive provided that the adsorption of one does not adversely affect that of the other and that mixed micelle formation does not reduce the available concentration of surfactant molecules.
The importance of the cosurfactant is illustrated in the following example. The interfacial tension between cyclohexane and water is approximately 42 mN m−1 in the absence of any added surfactant. The addition of the ionic surfactant SDS (sodium dodecyl sulfate) in increasing amounts causes a gradual reduction of γ to a value of about 2 mN m−1 at an SDS concentration of 10−4 g cm−3. Addition of 20% pentanol to the cyclohexane–water system in the absence of SDS reduces the interfacial tension to 10 mN m−1. It is then theoretically possible by the addition of SDS to achieve a negative interfacial tension at SDS concentrations below the level at which it forms micelles (the critical micelle concentration). The changes in interfacial tension occurring in this system are illustrated in Fig. 6.24. Although pentanol is not generally regarded as a surfactant, it has the ability to reduce interfacial tension by virtue of its amphiphilic nature (a short hydrophobic chain and a terminal hydrophilic hydroxyl group) and functions as the cosurfactant in this system. Its presence means that, in order to produce a microemulsion, the SDS is now required to produce a much smaller lowering of the interfacial tension (10 mN m−1 rather than 42 mN m1 in its absence).
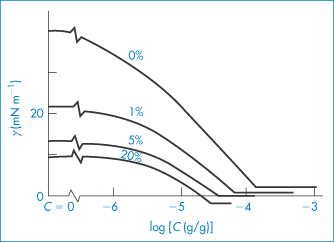
Figure 6.24 Interfacial tension, γ, between solutions of sodium dodecyl sulfate (SDS) of concentration C in aqueous 0.30 mol dm−3 NaCl and solutions of 1-pentanol in cyclohexane with the percentage concentrations indicated.
The simplest representation of the structure of microemulsions is the droplet model, in which microemulsion droplets are surrounded by an interfacial film consisting of both surfactant and cosurfactant molecules, as illustrated in Fig. 6.25. The orientation of the amphiphiles at the interface will, of course, differ in o/w and w/o microemulsions. As shown in Fig. 6.25, the hydrophobic portions of these molecules will be in the dispersed oil droplets of o/w systems, with the hydrophilic groups protruding in the continuous phase, while the opposite situation will be true of w/o microemulsions.
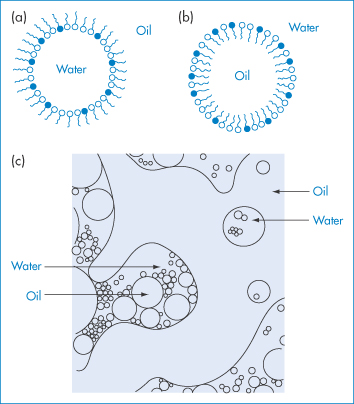
Figure 6.25 Diagrammatic representation of microemulsion structures: (a) a water-in-oil microemulsion droplet; (b) an oil-in-water microemulsion droplet; and (c) an irregular bicontinuous structure.
Whether the systems form o/w or w/o microemulsions is determined to a large extent by the nature of the surfactant. The geometry of the surfactant molecule is important. If the volume of the surfactant molecule is v, the cross-sectional area of its head group is a, and its length is l, then when the critical packing parameter v/al (see section 5.3.3) has values between 0 and 1, o/w systems are likely to form; but when v/al is greater than 1, w/o microemulsions are favoured. Values of the critical packing parameter close to unity can result in the formation of a bicontinuous structure in which areas of water can be imagined to be separated by a connected amphiphile-rich interfacial layer, as depicted in Fig. 6.25c. Values of the parameters v, a and l can readily be estimated, but it should be noted that the critical packing parameter is based purely on geometric considerations. Penetration of oil and cosurfactant into the surfactant interface and hydration of the surfactant head groups will also influence the packing of the molecules in the interfacial film around the droplets. In many systems, inversion from w/o to o/w microemulsions can occur as a result of changing the composition or the temperature. In general, o/w microemulsions are favoured when small amounts of oil are present and w/o systems form in the presence of small amounts of water. Under such conditions the droplet model is a reasonable representation of the system. The structure of microemulsions containing almost equal amounts of oil and water is best represented by a bicontinuous structure.
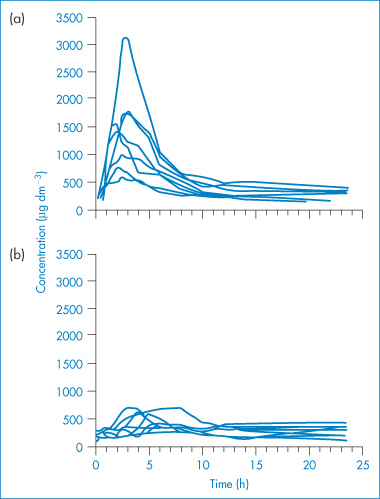
Figure 6.26 Blood ciclosporin concentration–time curves obtained following single oral doses (10 mg kg−1) of (a) microemulsion and (b) conventional formulations in eight liver transplant recipients with external biliary diversion.
Reproduced from Trull AK et al. Absorption of cyclosporin from conventional and new microemulsion oral formulations in liver transplant recipients with external biliary diversion. Br J Clin Pharmacol 1995;39:627. Copyright Wiley-VCH Verlag GmbH & Co. KGaA. Reproduced with permission.
Reviews of parenteral microemulsions as drug delivery systems have been published.4,5
6.4.6 Self-emulsifying drug delivery systems
Microemulsions carrying a variety of anticancer drugs such as paclitaxel and vincristine, and an antimalarial, artemether, amongst other drugs have been prepared and studied experimentally.5 Utilisation of microemulsions and emulsions in therapy is aided by the development of self-emulsifying drug delivery systems (SEDDS) and the analogous self-microemulsifying delivery systems (SMEDDS), systems which disperse in vivo to form emulsions or microemulsions.
Simple formulations comprising a solution of a lipophilic drug in an oil (for example, a medium-chain-length triglyceride or vegetable oil) loaded into a gelatin capsule rely on the surfactants present in the gastrointestinal tract (bile salts and lecithin) to solubilise the lipophilic drug in a colloidal dispersion in the intestine from which the drug may be absorbed. The bioavailability of drugs from such formulations can vary considerably, mainly because the efficiency of solubilisation depends to a large extent on the bile salt concentration in the gastrointestinal tract, which can show a wide interpatient variability. More reliable bioavailability is achieved from formulations in which suitable surfactants (and cosurfactants, if required) are added to the oil/drug solution; on contact with water in the gastrointestinal tract these spontaneously form emulsions (SEDDS) or microemulsions (SMEDDS) depending on the formulation.
The extent of absorption of poorly water-soluble drugs from o/w dispersions is influenced by droplet size: the smaller the droplet, the more rapid the breakdown of the triglycerides in which the drug is dissolved and hence the more rapidly the drug is released from the vehicle. The reason for this is that, before the drug can be released from the oil droplets, it is first necessary to hydrolyse the oil. The pancreatic lipase which is responsible for this hydrolysis acts only at the interface of the oil droplets; the smaller the droplet size, the larger the interface exposed to the enzyme and hence the more rapid the breakdown of the triglycerides (oil) in which the drug is dissolved. As a consequence, the release of drug into the aqueous environment, which is an essential first step in its absorption, is more rapid when the droplet size is reduced and the interfacial area so increased. As a consequence of their much smaller droplet size, SMEDDS formulations have the potential to achieve higher, less variable bioavailability than SEDDS. An illustration of this is seen from the development of the Neoral formulation for the delivery of ciclosporin (see clinical points box).
|
A formulation of ciclosporin (Neoral, Novartis) incorporates the drug in a preconcentrate that forms a microemulsion on dilution in aqueous fluids.6,7 The original formulation (Sandimmun) was an emulsion preconcentrate (SEDDS) comprising a solution of ciclosporin in a vegetable oil (olive oil or corn oil) and ethanol, and containing a polyglycolysed glyceride (Labrafil M-1944CS) as a surfactant. When administered orally as a liquid formulation, this mixture was stirred with several millilitres of a non-carbonated liquid (e.g. water, milk or orange juice) to form a coarse o/w dispersion before drinking. Alternatively, when the preconcentrate was delivered in a gelatin capsule, the emulsification occurred on release of the capsule contents in the aqueous environment of the gastrointestinal tract. The bioavailability characteristics were improved by the addition of the surfactants polyoxyl 40 hydrogenated castor oil (Cremophor RH40) and a polyglycolysed glyceride (Labrafil M-2125CS), together with a cosolvent (propylene glycol) to form the microemulsion preconcentrate (SMEDDS) Neoral. The residence time of ciclosporin in the gastrointestinal tract is shorter and the rate of absorption is faster with this microemulsion formulation. Some data can be found in Fig. 6.26. |

6.4.7 Structured (semisolid) emulsions
So far we have considered only relatively simple dilute emulsions. Many pharmaceutical preparations, lotions or creams are, in fact, complex semisolid or structured systems that contain excess emulsifier over that required to form a stabilising monolayer at the oil–water interface. The excess surfactant can interact with other components either at the droplet interface or in the bulk (continuous) phase to produce complex semisolid multiphase systems. Theories derived to explain the stability of dilute colloidal systems cannot be applied directly. In many cases the formation of stable interfacial films at the oil–water interface cannot be considered to play the dominant role in maintaining stability. Rather it is the structure of the bulk phase that maintains the disperse phase at a distance. Even very complex emulsions are often mobile at some point in their lifetime, e.g. during manufacture at elevated temperatures, or may become so during application of high shear rates in use. Under these conditions globules previously unable to interact become free to do so.
Stable o/w creams prepared with ionic or non-ionic emulsifying waxes are composed of (at least) four phases (Fig. 6.27): (1) dispersed oil phase; (2) crystalline gel phase; (3) crystalline hydrate phase; and (4) bulk aqueous phase containing a dilute solution of surfactant. The interaction of the surfactant and fatty alcohol components of emulsifying mixtures to form these structures (body) is critical. It is also time-dependent, giving the name ‘self-bodying’ to these emulsions. The overall stability of a cream is dependent on the stability of the crystalline gel phase.
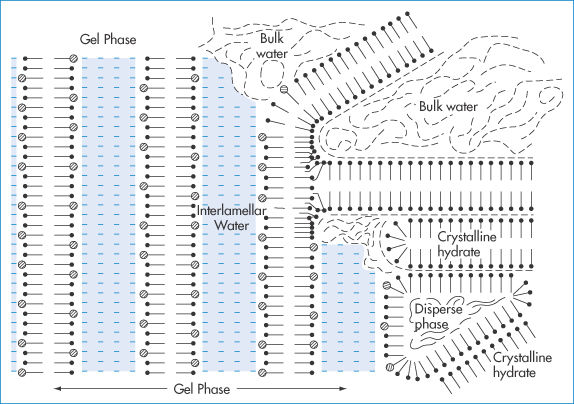
Figure 6.27 Schematic diagram of a typical semisolid cream prepared with cetostearyl alcohol and ionic surfactant. Note the four phases: (1) the dispersed oil phase; (2) the crystalline gel phase containing interlamellar fixed water; (3) phase composed of crystalline hydrates of cetostearyl alcohol; (4) bulk water phase.
Reproduced with permission from Eccleston GM. The microstructure of semisolid creams. Pharm Int 1986;7:63.
Emulsion stability is increased by the presence of liquid crystalline phases, as they form multilayers at the oil–water interface. These multilayers thus protect against coalescence by reducing the van der Waals forces of attraction and by retarding film thinning between approaching droplets, the viscosity of the liquid crystalline phases being at least 100 times that of the continuous phase in the absence of these structures. Guidelines have been devised for the formulation of self-bodied emulsions, the main ones of which are as follows8:
- The lipophilic component should be an amphiphile that promotes the formation of w/o emulsions and is capable of complexing with the hydrophilic surfactant at the o/w interface.
- The hydrophilic component should be a surfactant that promotes the formation of o/w systems and is capable of complexing with the lipophilic component at the o/w interface.
The rigidity and strength of networks prepared with cetostearyl alcohol and alkyltrimethylammonium bromides (C12–C18) increase as the alkyl chain length increases. The rheological stability of ternary systems is markedly dependent on the alcohol chain length; networks prepared with ionic or non-ionic surfactants and pure cetyl or pure stearyl alcohol are weaker than those prepared with cetostearyl alcohol.
6.4.8 Biopharmaceutical aspects of emulsions
Where traditionally emulsions have been used to deliver oils (castor oil, liquid paraffin) in a palatable form, a major use now is in IV nutrition. Lipid o/w emulsions are used as vehicles for lipophilic drugs (diazepam, propofol) for IV use. Griseofulvin, presented as an emulsion, exhibits enhanced oral absorption; an emulsion of indoxole has superior bioavailability over other oral forms. Medium-chain triglycerides and mono- and diglycerides promote the absorption of ceftriaxone and cefoxitin as well as ciclosporin.
In the case of griseofulvin, administration in a fatty medium enhances absorption. Fat is emulsified by the bile salts, and the administration of a pre-emulsified form increases the opportunity for solubilisation and hence transport across the microvilli by fat absorption pathways. The influence of the emulsifier on membrane permeability is one factor that must be considered. Knowledge that nanoparticles may be absorbed albeit in low amounts from the gut by the gut-associated lymphoid tissue suggests that we may have to revise our views on the nature of absorption of many drugs from the gastrointestinal tract.
Drug release from emulsions is related to the partition coefficient of the drug and the volume of the disperse phase, as well as to the concentration of surfactant that might solubilise the drug in the aqueous phase. Table 6.5 lists some drugs currently marketed as emulsions; Scheme 6.1 shows their structures and partition coefficients.
Table 6.5 Drugs formulated as emulsions
Drug | Product | Company | Route |
Ciclosporin A | Gengraf | Abbot | Oral |
Ciclosporin A | Restasis | Allergan | Ocular topical use |
Dexamethasone palmitate | Lipotalon/Limethason | Merckle | Intra-articular |
Diazepam | Diazepam | Braun Melsungen | IV |
Diazepam | Stesolid | Dumex | IV |
Etomidate | Etomidate-Lipuro | Braun Melsungen | IV |
Propofol | Diprivan | AstraZeneca | IV |
Ritonavir | Norvir | Abbott | Oral |
Modified from Tamilvanan S et al. Formulation of multifunctional oil-in-water nanosized emulsions for active and passive targeting of drugs to otherwise inaccessible internal organs of the human body. Int J Pharm 2009;381:62–72. Copyright Elsevier 2009.
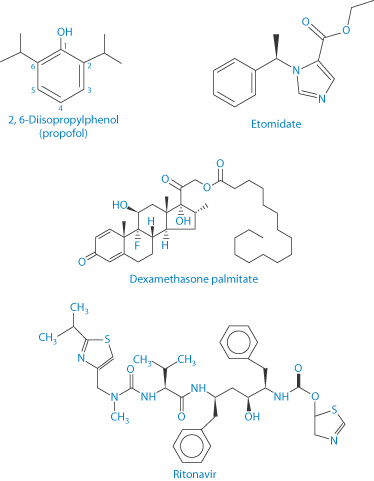
Scheme 6.1 Structures of propofol, etomidate, dexamethasone palmitate and ritonavir. Their log P values (range reported) as follows: for propofol = 3.81–4.16; for etomidate = 2.5–2.66; for dexamethasone palmitate = 9.8; and for ritonavir = 3.9–4.3 (N.B.: water solubility 400 μg mL–1 in 0.1 N HCl).
|
Etomidate and propofol are both IV anaesthetics. Etomidate was first formulated as a racemic mixture but the dextrorotatory form (the structure having R chirality) is substantially more active than its enantiomer, hence its reformulation as the single potent enantiomer. Etomidate is available in two formulations:
The hypnotic effects and onset of activity of both formulations are virtually identical. It has been found that propylene glycol-based formulations cause pain on injection, not least in paediatric subjects, and some patients also develop phlebitis and signs of an allergic reaction. Three papers on the topic explain progress in identifying the overall better formulation:
The British National Formulary 68 lists only emulsion formulations of propofol:
but as one commentary emphasises, ‘Not all propofols are equal’. |

There are suggestions of cross-allergy12 of the soybean oil present in all the emulsion formulations discussed here to peanut oil and hence adverse events in those with peanut allergies. Bioequivalence, antimicrobial preservatives and difference in lipid loads and lipid types are aspects which complicate comparison of propofol formulations. The propofol prodrug fospropofol (Lusedra) (Scheme 6.2) is available as an aqueous solution, and may be one route to avoid some of the problems encountered with more elaborate formulations.
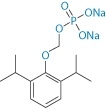
Scheme 6.2 Fospropofol sodium, which is metabolised to propofol and can be formulated as a solution
Prostaglandin E1 (PGE1) formulations
Lipid emulsion formulations of PGE1 have been used in the treatment of vascular disorders. They exhibit a reduced incidence of side-effects at the site of injection. A soybean emulsion stabilised by egg-yolk lecithin13 releases the PGE1 over a period of 4–16 h depending on pH (Fig. 6.28). The partition coefficients of PGE1 between soybean emulsion and aqueous buffers at 20°C are shown in Fig. 6.29, explaining why the release profiles have the pH dependency shown in Fig. 6.28. The release profile follows the expected pH trend, but a more detailed analysis shows that the majority of the drug is associated with the phospholipid.
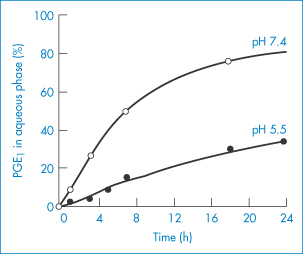
Figure 6.28 Release profiles of PGE1 from particles in Lipo-PGE1 diluted 10-fold with buffer solutions at 5°C: (●), pH 5.5; (○), pH 7.4.
Reproduced from Yamaguchi T et al. Distribution of prostaglandin E1 in lipid emulsion in relation to release rate from lipid particles. Chem Pharm Bull 1994;42:446–450. Copyright Wiley-VCH Verlag GmbH & Co. KGaA. Reproduced with permission.
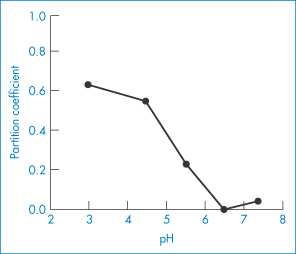
Figure 6.29 The pH–partition profiles of PGE1 between soybean oil and water at 20°C, explaining why the release profiles have the pH dependency shown in Fig. 6.28.
Reproduced from Yamaguchi T et al. Distribution of prostaglandin E1 in lipid emulsion in relation to release rate from lipid particles. Chem Pharm Bull 1994;42:446–450. Copyright Wiley-VCH Verlag GmbH & Co. KGaA. Reproduced with permission.
Intravenous lipid emulsions in detoxification
An interesting and valuable use of lipid emulsions is as a means of reducing high levels of drugs and other toxic materials from the circulation. IV administration of a lipid emulsion can reduce the levels of very lipophilic drugs which have accumulated at toxic amounts.14 The lipid particles act as a ‘sink’ for lipophilic drugs which will partition into the particles.
Drugs that have been reported to be taken up in this way in animal work and in some human studies include:
- amiodorone
- mepivacaine
- bupivacaine
- verapamil.
Calculated log P values for these molecules are 7.57, 1.95, 3.4 and 3.79, respectively. Success will be related to log P, the amount of drug in the blood and the concentration of lipid particles administered. L-type calcium channel blocker drugs are used as cardiac antiarrhythmics or antihypertensives, depending on whether the drugs have higher affinity for the heart (such as verapamil: Fig. 6.30) or for the vessels (e.g. nifedipine). The IV administration of Intralipid is seen to return the disturbed Ca2+ currents to nearly normal as a result of the free drug partitioning into the lipid droplets.
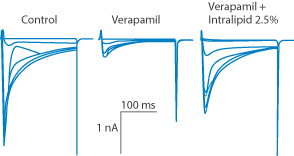
Figure 6.30 Intralipid emulsion administred IV decreases free verapamil concentrations and reverses verapamil-induced Ca2+ channel block. Graph depicts L-type Ca2+ currents in (from left to right) the control, verapamil and verapamil plus Intralipid. Kryshtal D et al. (Circulation 2010; 122:A18810) state that ‘rapid intravenous administration of Intralipid may be an effective antidote for hypotension caused by acute verapamil poisoning’.
6.4.9 Preservative availability in emulsified systems
Microbial spoilage of emulsified products is avoided by the inclusion of appropriate amounts of a preservative in the formulation. Infected topical emulsions have been the cause of outbreaks of pseudomonal and other bacterial skin infections. The incorporation of preservatives into pharmaceutical emulsions is not without problems as most agents partition to the oily or micellar phases of complex systems; some are inactivated by surfactants.
The amount of preservative remaining in the aqueous phase (Cw) is related to the total amount (C) of preservative with a partition coefficient P in an emulsion with an oil/water phase ratio of Φ by equation (6.21):
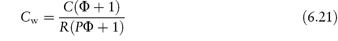
where R is the preservative/emulsifier ratio or interaction ratio. P and R need to be determined experimentally.
The presence of surfactant micelles alters the native partition coefficient of the preservative molecule because the micellar phase offers an alternative site for preservative molecules. The partitioning then occurs between the oil globule and the aqueous micellar phases.
For preservatives that are less soluble in the oily phase (P < 1), the concentration in all phases increases when the proportion of the oil phase is increased. In contrast, for those preservatives that are more soluble in oil than in water (P > 1), the concentration in all phases decreases when the proportion of the oil phase is increased. This is the case with phenol and chlorocresol (see data given in Table 6.6).
Table 6.6 Percentage (W) of phenol and chlorocresol partitioned to various sites in arachis oil emulsions
Arachis oil in water Φ (phase ratio) | Phenol | Chlorocresol | ||||||
Oil Wo | Aqueous phase Wa | Micelles Wm | Water Ww | Oil Wo | Aqueous phase Wa | Micelles Wm | Water Ww | |
0.18 | 38 | 62 | 15.6 | 46.4 | 74.8 | 25.2 | 21.3 | 3.9 |
0.25 | 46.8 | 53.2 | 13.6 | 39.6 | 80.5 | 19.5 | 17 | 2.5 |
0.5 | 64 | 36 | 10.4 | 25.6 | 89.3 | 10.7 | 9.5 | 1.2 |
1.0 | 78.2 | 21.8 | 7.7 | 14.1 | 94.4 | 5.6 | 5.1 | 0.5 |
1.5 | 84.2 | 15.8 | 6.2 | 9.6 | 96.2 | 3.8 | 3.5 | 0.3 |
Reproduced from Konning GK. Can J Pharm Sci 1974;9:103.
Note that Wa = Wm + Ww. Phenol and chlorocresol are present in 2.5% concentration.
Stabiliser: 1% polysorbate 80.
In an emulsion containing 60% arachis oil (Φ = 1.5) and 1% polysorbate, 9.6% of the phenol but only 0.3% of the more lipophilic chlorocresol is free in the water phase. As much as 93% of the phenol and 99.9% of chlorocresol are locked up in the oily phase or the micellar phases in emulsions containing 10% polysorbate 80.
The use of these equations can be criticised because of the simple manner in which R has been measured and defined, but they are useful to estimate effects of changing parameters. When the emulsified system is very complex, containing not one but at least two emulsifying agents (as most do), the determination of the parameters of the equation is a lengthy process, and a direct experimental approach to the determination of free aqueous concentration, such as a dialysis technique, may be the only approach.
6.4.10 Mass transport in oil-in-water emulsions
Not only preservative molecules partition from the phases in emulsions: drug molecules and flavouring and colouring agents also do. Interest in the extent and rate of flavour release on ingestion of a food emulsion has resulted in quantitative studies of the topic. The model used is equally applicable to drug release in the gastrointestinal tract as in the mouth, since dilution of the emulsion system occurs in both instances.
The concentration of the solute in the aqueous phase immediately after dilution  and on re-establishing equilibrium
  depends on the various properties of the solutes, such as the partition coefficient.
Usually, drugs dissolved in oils are absorbed mainly via the aqueous phase. Transport from one phase to the other and partitioning are therefore important. In the absorption of drugs from o/w emulsions when the drug partition coefficient is greater than 1, the amount of drug in the aqueous phase (rather than the concentration) is a critical factor for absorption. In the absorption of poorly oil-soluble drugs, drug absorption from emulsions is greater than from aqueous solution. In an emulsion of volume ratio, Φ, the drug concentration in the aqueous phase (Cw) is related to the overall concentration of the drug (C) by the expression:
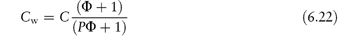
where P is the oil/water partition coefficient of the drug or other agent.
6.4.11 Intravenous fat emulsions
|
Fat emulsions are used to supply a large amount of energy in a small volume of isotonic liquid; they supply the body with essential fatty acids and triglycerides. Fat emulsions for IV nutrition contain vegetable oil and phospholipid emulsifier. Several commercial fat emulsions are available, such as Intralipid, Lipiphysan, Lipofundin and Lipofundin S. They contain either cottonseed oil or soybean oil. In Intralipid, for example, purified egg-yolk phospholipids are used as the emulsifiers, and isotonicity is obtained by the addition of sorbitol, xylitol or glycerol. Intralipid has also been used as the basis of an IV drug carrier, for example for diazepam (Diazemuls) and propofol (Diprivan), as an alternative to solubilisation in non-ionic micellar systems such as Cremophor EL. To avoid adverse effects on injection it is important that the particle size of the emulsions is small and remains so on storage. After storage of Intralipid for 2 years at 4°C, more than 99% of the particles visible by light microscopy had a diameter of less than 1 μm; that is, there was practically no change in mean diameter. |

Chylomicrons
Fat that finds its natural way into plasma occurs in three forms: as lipoprotein complexes, as free fatty acids bound to albumin, or as an emulsion of particles in the size range 0.4–3.0μm. These natural emulsion globules are chylomicrons (from the Greek chylo, meaning juice or milky fluid, and micron, meaning small particle). There are pronounced physical similarities between chylomicrons and the fat particles of the Intralipid emulsion. Chylomicrons are lipoprotein particles that consist of triglycerides (85–92%), phospholipids (6–12%), cholesterol (1–3%) and proteins (1–2%). They transport dietary lipids from the intestines to other locations in the body. Chylomicrons are one of the five major groups of lipoproteins (chylomicrons, very-low-density lipoproteins, intermediate-density lipoprotein, low-density lipoproteins, high-density lipoproteins) that enable fats and cholesterol to move within the water-based solution of the blood stream.
|
The addition of electrolyte or drugs to IV fat emulsions is generally contraindicated because of the risk of destabilising the emulsion. Addition of cationic local anaesthetics reduces the electrophoretic mobility of the dispersed fat globules, and this contributes to instability.15 |

Minimum stability (and a minimum value of zeta potential) is caused by addition to Intralipid of 3 × 10⁻³ mol dm−3 CaCl2 and 2.5 × 10⁻¹ mol dm−3 NaCl, which are thus recommended as the maximum additive levels (Fig. 6.31).
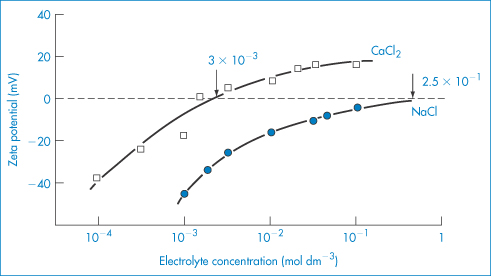
Figure 6.31 Zeta potential of Intralipid 20% diluted into varying concentrations (mol dm−3) of (●) NaCl, (□) CaCl2.
Reproduced with permission from Whateley TL et al. Particle size stability of Intralipid and mixed total parenteral nutrition mixtures. J Clin Hosp Pharm 1984;91:13–26.
6.4.12 Emulsion rheology
Most emulsions, unless very dilute, display both plastic and pseudoplastic flow behaviour rather than simple Newtonian flow (see section 6.3). An attempt has been made16 to calculate the shear conditions for simple pharmaceutical operations such as the spreading of an ointment or cream on the skin, ointment milling and the flow of liquid through a hypodermic needle. The flow properties of fluid emulsions should have little influence on their biological behaviour, although the rheological characteristics of semisolid emulsions may affect their performance. The ‘pourability’, ‘spreadability’ and ‘syringeability’ of an emulsion will, however, be directly determined by its rheological properties. The high viscosity of w/o emulsions leads to problems with intramuscular administration of injectable formulations. Conversion to a multiple emulsion (w/o/w), in which the external oil phase is replaced by an aqueous phase, leads to a dramatic decrease in viscosity and consequent improved ease of injection.
The influence of phase volume on the flow properties of an emulsion is shown in Fig. 6.32. In this diagram the relative viscosity ( rel) of the system increases with increasing
  , and at any given phase volume increases with decreasing mean particle size, Dm. These and other factors that affect emulsion viscosity are listed in Table 6.7.
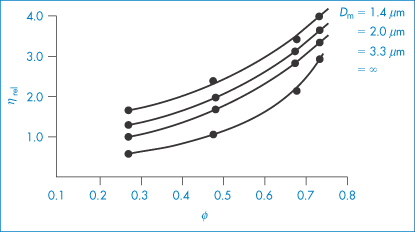
Figure 6.32 The relative viscosities of w/o emulsions stabilised with sorbitan trioleate; as a function of volume fraction and globule diameters Dm.
Reproduced from Sherman P. The flow properties of emulsions. J Pharm Pharmacol 1964;16:1. Copyright Wiley-VCH Verlag GmbH & Co. KGaA. Reproduced with permission.
Table 6.7 Factors that influence emulsion viscosity
Internal (disperse) phase |
Volume fraction ( |
Viscosity |
Particle size and size distribution |
Chemical nature |
Continuous phase |
Viscosity |
Chemical constitution and polarity |
Emulsifier |
Chemical constitution and concentration |
Solubility in the continuous and internal (disperse) phase |
Physical properties of the interfacial film |
Electroviscous effects |
Presence of additional stabilisers, pigments, hydrocolloids, etc. |

As most emulsions are polydisperse, the influence of particle size and, in particular, of particle size distribution on viscosity is important. Figure 6.32 shows the viscosity of w/o emulsions varying in mean particle size (Dm) stabilised with sorbitan trioleate.
Several equations for the viscosity of emulsion systems take the form
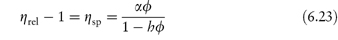
where α = 2.5, and h is a measure of the fluid immobilised between the particles in concentrated emulsions and dispersions, which therefore reduces the total volume of liquid available for the particles to move around in. Immobilised liquid attached to solvated macromolecular stabilisers effectively increases the concentration of the particles and increases viscosity. In emulsions in which  does not exceed 0.65, an equation of the form
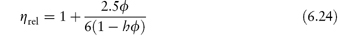
may be used, while for emulsions in which  rel becomes infinite when
  → 0.74, the appropriate equation is
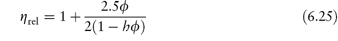
where h has a value of 1.28–1.35.
When an emulsion is aged, its mean globule size increases. The ensuing changes in Dm and globule size distribution cause a fall in emulsion viscosity at high rates of shear. Provided no other changes have occurred in the system, the viscosity at any given time should be predictable from viscosity–Dm relationships derived from fresh emulsions of the same formulation. Viscosity changes at low rates of shear are more difficult to predict because of the complication of particle aggregation, which may change with time. Creep compliance tests show viscoelastic behaviour for concentrated o/w emulsions stabilised by mixtures of non-ionic emulsifiers and fatty alcohols. The rheological characteristics of these emulsions change with time as a result of interactions between the components of the system and they are termed ‘self-bodying’ emulsions.
|
|

6.5 Suspensions
Suspensions are dispersions of an insoluble drug or other substance in an aqueous or non-aqueous continuous phase. Pharmaceutical suspensions tend to be coarse dispersions rather than true colloids, although there are many sub-micrometre polymer dispersions available as drug carriers. There are also suspensions of drug nanocrystals, as discussed in Chapter 14. Drugs in suspension are prepared mainly for oral, intramuscular or subcutaneous use, but suspensions of drugs are also used as reservoirs in transdermal patch preparations and in conventional topical formulations. Many therapeutic aerosols are suspensions of drugs in a volatile propellant.
Problems can arise when a drug is dispersed in a liquid. Sedimentation, caking (leading to difficulty in resuspension), flocculation and particle growth (through dissolution and recrystallisation) are all possible. In practice we wish to avoid the problems of aggregation of particles in suspensions and in many lyophilised preparations and to ensure their efficient redispersion on reconstitution with water or other media. Adhesion of suspension particles to container walls has also been identified as a problem, particularly with low-dose drugs.
Formulation of pharmaceutical suspensions to minimise caking can be achieved by the production of flocculated systems. A flocculate, or floc, is a cluster of particles held together in a loose open structure; a suspension consisting of particles in this state is termed flocculated (Fig. 6.33). There are various states of flocculation and deflocculation. Unfortunately, flocculated systems clear rapidly and the preparation often appears unsightly, so a partially deflocculated formulation is the ideal pharmaceutical.
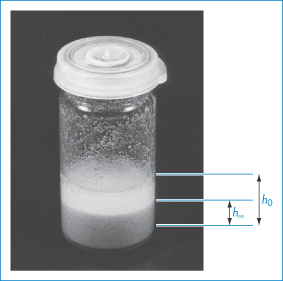
Figure 6.33 A flocculated suspension that has rapidly settled, clearly identifying the sedimentation layer, from which can be calculated the ratio R (equation 6.26) as R = h∞/h0.
Suspensions of liposomes, microspheres and microcapsules, and nanospheres and nanocapsules formed from a variety of polymers or proteins form a relatively new class of pharmaceutical suspension in which physical stability is still paramount. It is important that on injection these carrier systems do not aggregate, as this will change the effective size and the fate of the particles. One exception to this would be the deliberate flocculation of latex particles administered to the eye, where aggregation leads to agglomerated particles that do not easily pass through the drainage ducts of the eye.
6.5.1 Stability of suspensions
In order to quantify the sedimentation of suspended particles, the ratio R of sedimentation layer volume (Vs) to total suspension volume (Vt) may be used. A measure of sedimentation may also be obtained from the height of the sedimented layer (h∞) in relation to the initial height of the suspension (h0).
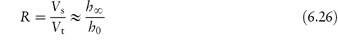
In a completely deflocculated system the particles are not associated; pressure on the individual particles can lead in this layer to close packing of the particles to such an extent that the secondary energy barriers are overcome and the particles become irreversibly bound together. In flocculated systems (where the repulsive barriers have been reduced) particles settle as flocs and not as individual particles. The supernatant clears but, because of the random arrangement of the particles in the flocs, the sediment is not closely packed and caking does not readily occur.
In flocculated or concentrated suspensions, zone settling occurs (Fig. 6.34a). In the region A–B of Fig. 6.34b there is hindered settling of the particle interface at a constant rate; at B–C a transitional settling occurs; from C to D consolidation of the sediment occurs.

Figure 6.34 Zone sedimentation in a suspension. (a) The various zones are delineated, showing the clear layer at the top of the suspension and the sedimented layer at the bottom; immediately above this layer is a region in which the particles are crowded and begin to be compressed to form sediment. (b) The height of the interface between the clarified zone and the suspension as a function of time.
Suspension stability is governed by the same forces as in other disperse systems such as emulsions. There are differences, however, as coalescence obviously cannot occur in suspensions; the adsorption of stabilising polymers and surfactants may also occur in a different fashion. Flocculation, unlike coalescence, can be a reversible process and partial or controlled flocculation is attempted in formulation, as discussed above.
Caking of the suspension, which arises on close packing of the sedimented particles, cannot be eliminated by reduction of particle size or by increasing the viscosity of the continuous phase. Fine particles in a viscous medium settle more slowly than coarse particles but, after settling, they form a more closely packed sediment that may be difficult to re-disperse. Particles in a close-packed condition brought about by settling and by the pressure of particles above thus experience greater forces of attraction. Flocculating agents can prevent caking; deflocculating agents increase the tendency to cake. The addition of flocculating and deflocculating agents is often monitored by measurement of the zeta potential of the particles in a suspension.
Zeta potential and its relationship to stability
Most suspension particles dispersed in water have a charge acquired by specific adsorption of ions or by ionisation of ionisable surface groups, if present. If the charge arises from ionisation, the charge on the particle will depend on the pH of the environment. As with other colloidal particles, repulsive forces arise because of the interaction of the electrical double layers on adjacent particles. The magnitude of the charge can be determined by measurement of the electrophoretic mobility of the particles in an applied electric field. A microelectrophoresis apparatus in which this mobility may be measured is shown schematically in Fig. 6.35.
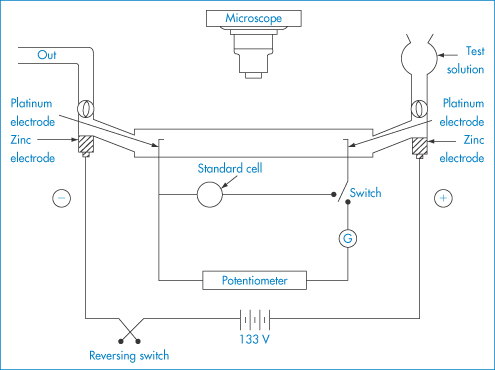
Figure 6.35 Schematic drawing of a microelectrophoresis apparatus showing the positioning of the anode and cathode and the capillary in which the velocity of particulates is monitored to allow calculation of zeta potential.
The velocity of migration of the particles (μE) under unit applied potential can be determined microscopically with a timing device and an eyepiece graticule. For non-conducting particles, the Henry equation is used to obtain ζ from μE. This equation can be written in the form
where f(κa) varies between 1 for small κa and 1.5 for large κa; ε is the dielectric constant of the continuous phase and  its viscosity. In systems with low values of κa, the equation can be written in the form
The zeta potential (ζ) is not the surface potential (ψ0) discussed earlier but is related to it. Therefore ζ can be used as a reliable guide to the magnitude of electric repulsive forces between particles. Changes in ζ on the addition of flocculating agents, surfactants and other additives can then be used to predict the stability of the system.
The changes in a bismuth subnitrate suspension system on addition of dibasic potassium phosphate as flocculating agent are shown in Fig. 6.36. Bismuth subnitrate has a positive zeta potential; addition of phosphate reduces the charge and the zeta potential falls to a point where maximum flocculation is observed. In this zone there is no caking. Further addition of phosphate leads to a negative zeta potential and a propensity towards caking. Flocculation can therefore be controlled by the use of ionic species with a charge opposite to the charge of the particles dispersed in the medium.
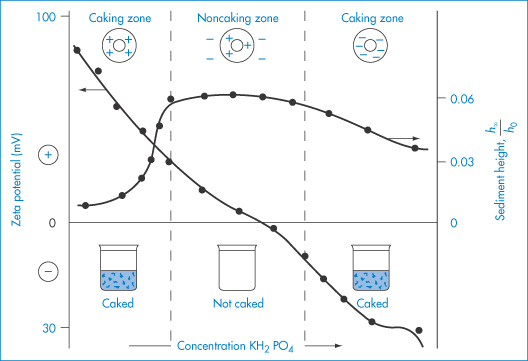
Figure 6.36 Caking diagram showing controlled flocculation of a bismuth subnitrate suspension employing dibasic potassium phosphate as the flocculating agent.
The rapid clearance of the supernatant in a flocculated system is undesirable in a pharmaceutical suspension. The use of thickeners such as sodium carboxymethylcellulose hinders the movement of the particles by increasing the viscosity of the medium, slowing down sedimentation. The incompatibility of any anionic agents with cationic flocculating agents has to be considered. A technique to overcome the problem is the conversion of the particle surfaces into positive surfaces so that they require anions and not cations to flocculate them. Negatively charged or neutral particles can be converted into positively charged particles by addition of a surface-active amine. Such a suspension can then be treated with phosphate ions to induce flocculation.
It is perhaps not surprising that with some complex systems the interpretation of behaviour is open to debate. Consider the system shown in Fig. 6.37. One starts with a clumped suspension of sulfamerazine, a flocculated system that produces non-caking sediments. Addition of the surfactant sodium dioctyl sulfosuccinate (docusate sodium) confers a greater negative charge on the suspension particles and deflocculation results. Addition of aluminium chloride as a flocculating agent reduces the negative charge in a controlled way to produce the loose clusters illustrated in the diagram. These are the observable results of these procedures. The different interpretations of the effects are diagrammatically realised, the difference lying in the manner in which the aluminium ions adsorb on to the sulfamerazine particles; in one view they adsorb directly, and in the other view they interact with the surfactant ions on the surface.
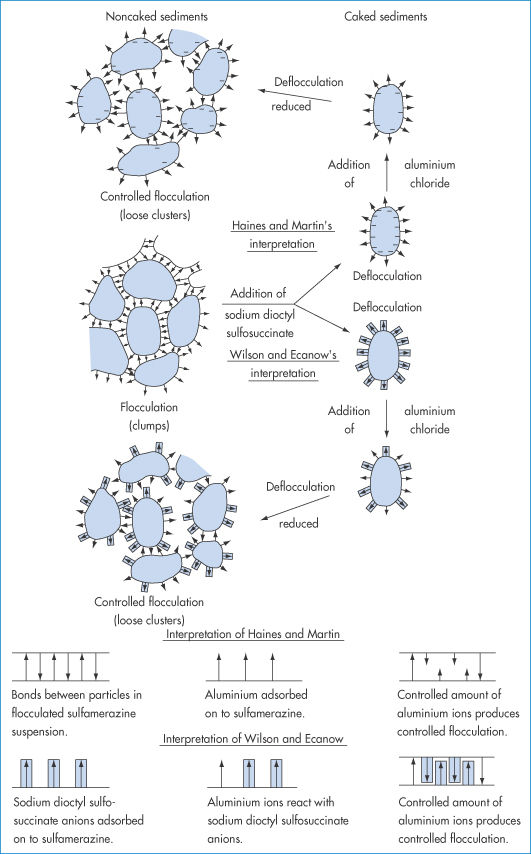
Figure 6.37 Diagrammatic drawing of flocculation and controlled flocculation in a sulfamerazine suspension: the effect of the addition of sodium dioctyl sulfosuccinate (docusate sodium) and aluminium chloride is shown and two interpretations of the results are outlined.
Reproduced from Woodford R, Pharmacy Digest, 1966; 29: 17.
|
The formulation of barium sulfate (BaSO4) suspensions as a radiopaque material has to be carefully controlled for use. Flocculation of the suspended particles, which can be caused by the mucin in the gastrointestinal tract, causes artefacts to be seen in radiography. Factors such as particle size, zeta potential, pH dependence of the properties of adjuvants and the whole suspension, and the film-forming characteristics of the formulation must be taken into account. The preparation must flow readily over the mucosal surface, penetrate into folds and coat the surface evenly with a thin radiopaque layer. A film 2 μm thick will absorb twice as much radiation as a layer 1 μm thick if the average BaSO4 particle size and concentration are the same in both cases. The adhesion of wet films of barium sulfate suspensions to surfaces and their thickness have been assessed in vitro by a simple method in which a clean microscope slide is dipped into the suspension and allowed to drain for 30 seconds. The gross appearance displays evidence of irregular coating caused by foaming, bubble formation or coagulation of particles. Commercially available suspensions preferred by radiologists are strongly negative at low pH, presumably resisting flocculation because of strong interparticle repulsion. |

Polymers as flocculating agents
In many applications, such as water purification, suspended particles have to be removed by filtration. Flocculated particles are more readily removed than deflocculated particles. Polymers have been widely used as flocculating agents. Polymers used as flocculating or destabilising agents frequently act by adsorption and interparticle bridging. To be effective, the polymer must contain chemical groups that can interact with the surface of the colloidal particles. A particle–polymer complex is then formed, with polymer emerging into the aqueous phase. This free end will attach itself to another particle (‘bridging’) and thus promote flocculation. If there are no particles with which to interact, the polymer can coat the particle, leading to restabilisation. As can be seen in Fig. 6.38, however, the action of polymeric agents that can anchor at the particle surface is very concentration-dependent.
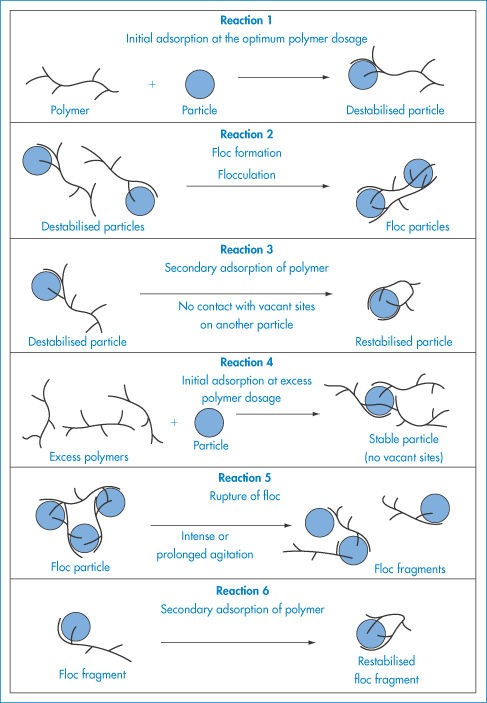
Figure 6.38 Schematic representation of the bridging model for the destabilisation of colloids by polymers: the concentration dependence of the process is illustrated.
Reproduced from Weber WJ. Physicochemical Processes for Water Quality Control. New York: Wiley; 1972. Copyright Wiley-VCH Verlag GmbH & Co. KGaA. Reproduced with permission.
Polyacrylamide (30% hydrolysed) is an anionic polymer that can induce flocculation in kaolinite at very low concentrations. Restabilisation occurs by ‘overdosing’, probably by the mechanism outlined in Fig. 6.38. Dosages of polymer that are sufficiently large to saturate the colloidal surfaces produce a stable colloidal system, since no sites are available for the formation of interparticle bridges. Under certain conditions, physical agitation of the system can lead to breaking of polymer–suspension bonds and to a change in the state of the system.
|
|

6.5.2 Extemporaneous suspensions
Extemporaneous preparation of suspensions of drugs is still widely practised in hospital pharmacies, particularly to prepare dose forms for paediatric use when either a commercial product is unavailable or the dose has to be adjusted or the child cannot swallow tablets or capsules, as discussed in Chapter 10. Drugs such as acetazolamide, amiodarone and mercaptopurine are examples. In such formulations, alternatives to traditional suspending agents are required. The ideal suspending agent should:
- be readily and uniformly incorporated in the formulation
- be readily dissolved or dispersed in water without resort to special techniques
- ensure the formation of a loosely packed system that does not cake
- not influence the dissolution rate or absorption rate of the drug
- be inert, non-toxic and free from incompatibilities.
Among the alternative suspending agents are sodium carboxymethylcellulose, microcrystalline cellulose, aluminium magnesium silicate (Veegum), sodium alginate (Manucol) and sodium starch (Primojel). Pregelatinised starches, Primojel and Veegum, are promising alternatives to compound tragacanth powder. Paediatric formulations demand special care because of the potential toxicities of formulation additives. Some issues are discussed in the text Paediatric Drug Handling,17 and in Chapter 10.
6.5.3 Suspension rheology
Dilute flocculated suspensions exhibit pseudoplastic flow; more concentrated flocculated suspensions tend to exhibit plastic flow as a consequence of the closer packing of their particles at higher concentrations. At shear stresses below τ0 in concentrated suspensions, the three-dimensional structure of the flocculated suspension is maintained, the apparent viscosity is relatively high and very little flow occurs. As the shear stress is increased between the lower and upper yield stresses, the floccules are progressively broken down and eventually, at shear stresses above the upper yield stress, the flow appears to become Newtonian. The effect is shown schematically in Fig. 6.39. As a consequence, the viscosity (gradient of the plot of shear stress vs shear rate) of both pseudoplastic and plastic suspensions decreases with increasing shear rate, as illustrated in Fig. 6.40.
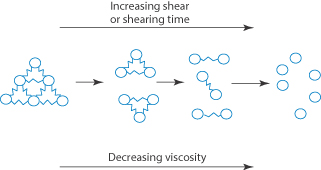
Figure 6.39 Schematic showing the viscosity decrease with increasing shear in a flocculated suspension caused by the breakdown of floccules.
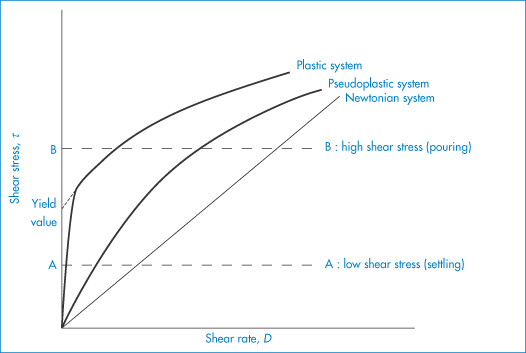
Figure 6.40 A plot of shear stress τ =  D against shear rate D for plastic and pseudoplastic suspensions. As
  = τ/D, the slope of the line represents the viscosity at each rate of shear; in both the plastic and pseudoplastic systems the viscosity at level A is greater than that at level B.
Modified from Samyn JC, An industrial approach to suspension formulation. J Pharm Sci, 1961; 50: 517. Copyright Wiley-VCH Verlag GmbH & Co. KGaA. Reproduced with permission.
Shear thickening (dilatancy) is shown by concentrated suspensions of densely packed deflocculated particles in which there is only sufficient liquid to fill the void spaces in between the particles. The apparent viscosity is low at low shearing stress, but increases as the applied stress increases. This effect is due to the increase of electrostatic repulsion that occurs when the charged particles are forced close together (as seen from the DLVO plot of Fig. 6.5), causing the particles to rebound, creating voids into which liquid flows, leaving other parts of the dispersion ‘dry’.
6.5.4 Non-aqueous suspensions
Many pharmaceutical aerosols consist of solids dispersed in a non-aqueous propellant. Few studies have been published on the behaviour of such systems, although their sensitivity to water is well established. Low amounts of water adsorb at the particle surface and can lead to aggregation of the particles with each other or to deposition on the walls of the container, which adversely affects the product performance.
6.5.5 Electrostatics in aerosols
Aerosol particles can become electrostatically charged as they are projected from the aerosol canister. The net charge is sufficient to affect deposition in the respiratory tract. Positive charges have been found on particles below 0.6 μm and negative charges above that size in Intal Forte, Tilade and Flixotide aerosols, which are suspension formulations with plastic valves. The number of charges on the particles ranged from zero to several thousands!
As Schein18 has written in an article on continuing puzzles in electrostatics, charging of solid surfaces ‘remains one of the most poorly understood areas of solid-state physics’. It would be an advance to have charge correlated with the properties of the powders that experience this effect, but the issue in pharmaceuticals is often the presence of excipients. Particle adhesion, say to plastic components as in spacers, has been thought to be due to electrostatic interactions between the charges on the particles and the resultant induced charges on any surface (Fig. 6.41). But the physical picture is more complex, and appears to be related to the discreteness of the charge, which produces strong electrostatic forces.19
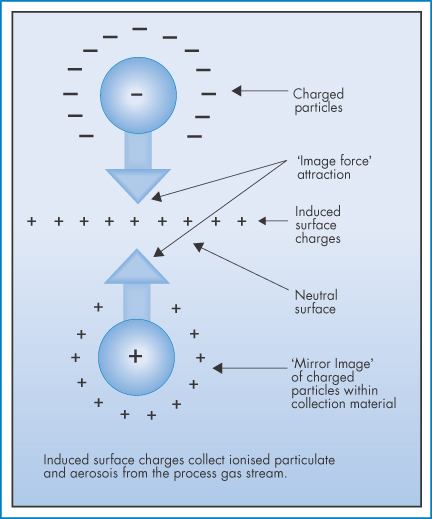
Figure 6.41. Schematic of induced positive charges on surfaces close to a negatively charged aerosol particle, which leads to particle adhesion.
Redrawn from www.verantis.com.
6.5.6 Adhesion of suspension particles to containers
When the walls of a container are wetted repeatedly, an adhering layer of suspension particles may build up, and this subsequently dries to a hard and thick layer. In Fig. 6.42 three types of wetting are shown. Where the suspension is in constant contact with the container wall, immersional wetting occurs, in which particles are pressed up to the wall and may or may not adhere. Above the liquid line, spreading wetting of the suspension during shaking or pouring may also lead to adhesion of the particles contained in the spreading liquid. Adhesional wetting occurs when a liquid drop remains suspended, like a drop of water on a clothes line. Evidently the surface tension of the suspension plays a part in the spreading and wetting processes. Adhesion increases with increase in suspension concentration, and with the number of contacts the suspension makes with the surfaces in question. Additives, especially surfactants, will modify the adhesion of suspension particles. They will act in two ways: (a) by decreasing the surface tension; and (b) by adsorption modifying the forces of interaction between particle and container. The example illustrated in Figs 6.43 and 6.44 refers to the addition of benzethonium chloride to chloramphenicol suspensions. Benzethonium chloride converts both the glass surface and the particles into positively charged entities (Fig. 6.43). Adhesion in the presence of this cationic surfactant is concentration-dependent, the process being akin to flocculation. At low concentrations the surfactant adsorbs by its cationic head to the negative glass and to the suspension particle. The glass is thus made hydrophobic. At higher concentrations hydrophobic interactions occur between coated particle and surface (Fig. 6.44). Further increase in concentration results in multilayer formation of surfactant, rendering the surfaces hydrophilic. In this condition the particles repel, reducing adhesion.
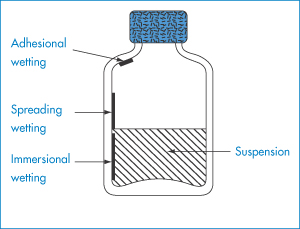
Figure 6.42 Adhesion. (a) Three types of wetting, giving rise to adhesion of suspension particles. Suspended particles adhering to the surface of a glass vial can be seen in Fig. 6.33.
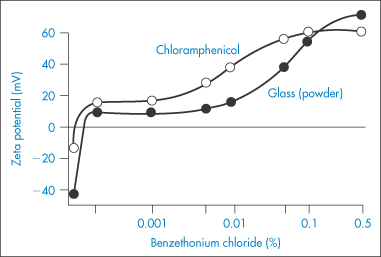
Figure 6.43 Zeta potential of glass (powder) and chloramphenicol in aqueous benzethonium chloride solutions.
Reproduced from Uno H, Tanaka S. Adhesion of suspension particles on the wall surface of a container. Mechanism of particle adhesion. Kolloid Z Z Polym 1972;250:238, with kind permission from Springer Science and Business Media.
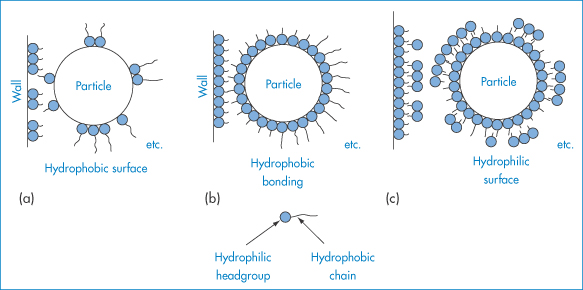
Figure 6.44 Adsorption of benzethonium chloride on particle and wall surfaces creating in (a) hydrophobic surfaces and in (b) hydrophobic bonding between the adsorbed molecules. In (c) further additions of the benzethonium chloride result in the conversion to hydrophilic surfaces.
Modified from Uno H, Tanaka S. Kolloid Z Z Polym 1972;250:238.
6.6 Miscellaneous colloidal systems
Several colloidal systems have not been mentioned in this chapter because they are dealt with elsewhere. These include nanoparticle suspensions used in drug delivery and targeting, and vesicular dispersions (liposomes, niosomes, etc.). Variations on the emulsion theme include microsphere-in-water-in-oil systems (s/w/o) and vesicle-in-water-in-oil (v/w/o) formulations. Figure 6.45 shows (a) the appearance of a vesicle-based system and (b) the modes of release of drug encapsulated in the system.
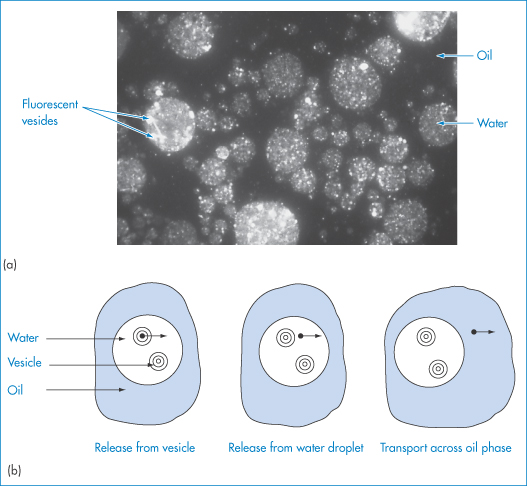
Figure 6.45 (a) Photomicrograph of a vesicle-in-water-in-oil (v/w/o) emulsion. (b) Diagrammatic representation of the modes of release of solutes from the formulation (● = drug).
6.7 Applications of colloid stability theory to other systems
There are several colloidal systems other than synthetically produced emulsions and suspensions that are of relevance – blood and other cell suspensions, for example – whose behaviour can now be better understood by application of colloid stability theory. The adhesion of cells to surfaces, the aggregation of platelets, the spontaneous sorting out of mixed-cell aggregates and other such phenomena depend to a large extent on interaction between the surfaces of the objects in question, although the surfaces are frequently more labile and less homogeneous than those encountered in model colloids. The extended circulation in the blood of ‘long-life’ or ‘stealth’ liposomes whose surfaces are modified by protruding long surface-bonded hydrophilic chains (usually polyoxyethylene glycols) may also be ascribed to their modified interactions in vivo with opsonins and with scavenging cells of the reticuloendothelial system.
6.7.1 Cell–cell interactions
A simple way of considering interactions between free-floating cells is to treat the cells as spheres. Adhesion between cells in contact is, however, best considered as interaction between planar surfaces (Fig. 6.46). Cell adhesion and separation occur during the interaction of sperm and egg, in cell fusion and in parasitism; phagocytosis may also have an adhesive component. Cell adhesion can occur with a variety of non-living materials such as implanted prosthetic devices.
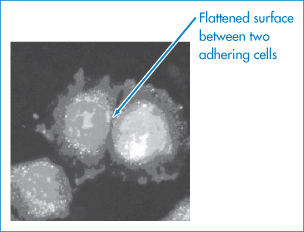
Figure 6.46 Interacting cells with a planar interface formed between them.
Photograph: J. Ivaska, Centre for Biotech, Finland.
Adhesion is primarily a surface phenomenon. The main factors that act to produce adhesion are:
- bridging mechanisms
- electrostatic interactions
- interactions involving long-range forces.
As in suspension flocculation, the bridging agent will be a molecule that combines in some way with both surfaces and thus links them together. Macromolecules may adsorb on to the surface of the particle and, if the length of the molecule is greater than twice the range of the electrostatic forces of repulsion, the other end of the molecule may adsorb on to a second surface. Flexible molecules may adsorb on to the same cell or particle. Alternatively, polyvalent ions may bind to charged groups on the two adjacent surfaces. Brownian motion may provide the means for close approach of the particles, or the polyvalent ion and may so reduce the electrostatic repulsion that the cells can approach each other.
Electrostatic forces of attraction will come into play when the surfaces have opposite sign or charge or when the surfaces possess mosaics of charges such that interaction can occur. The long-range forces are those discussed earlier in the chapter. Low pH, high ionic strength and the presence of covalent cations all favour cell–cell adhesion.
It is not possible to discuss all cell–cell interactions rigorously from a purely physical point of view. Often adhesion results in the secretion of complex chemicals that further induce interaction that cannot be treated by any physicochemical model.
6.7.2 Adsorption of microbial cells to surfaces
The contamination of pharmaceutical suspensions for oral use can be a problem. Under some conditions, bacteria may be strongly adsorbed and therefore more resistant to the effects of preservatives. In other cases, the bacteria may be free in the liquid phase of the suspension.
Two distinct phases of bacterial adsorption on to glass have been observed20; the first, reversible, phase may be interpreted in terms of DLVO theory. Reversible sorption of a non-mobile strain (Achromobacter) decreased to zero as the electrolyte concentration of the medium was increased, as would be expected. The second, irreversible, phase is probably the result of polymeric bridging between bacterial cell and the surface in contact with it. It is obviously not easy to apply colloid theory directly, but the influence of factors such as surface potential, pH and additives can usually be predicted and experimentally confirmed.
In the agglutination of erythrocytes and the adsorption of erythrocytes to virus-infected cells, projections of small radius of curvature have been observed and could well account for the local penetration of the energy barrier and strong adhesion at the primary minimum. The various modes of cell sorption are shown diagrammatically in Fig. 6.47.
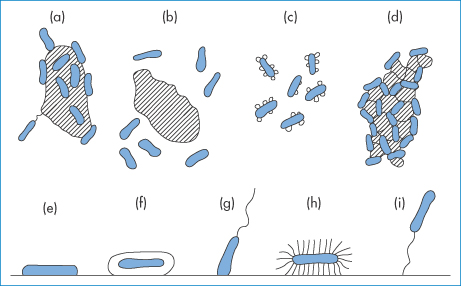
Figure 6.47 Various types of bacterial sorption on solid surfaces (see text).
Reproduced with permission from Zvyagintsev D. Interaction between Microorganisms and Solid Surfaces. Moscow: Moscow University Press; 1973.
Sorption of microbial cells is selective but there is no obvious relation between Gram-staining characteristics and attachment. In Fig. 6.47, bacterial cells are shown adsorbing on to larger solid particles (a) or free in suspension (b); (c) illustrates the opposite effect – small particles are shown adsorbed on to bacterial cells. The bacterial cells are adsorbed on to flocculated particles in (d), on to solid surfaces in (e); (f)–(i) show the more complicated behaviour of bacterial forms with coats, cilia and flagella. The adsorption affects growth partly by masking the cell surface and partly by altering the release of metabolites from the cell.
In addition to the van der Waals and electrical forces, steric forces resulting from protruding polysaccharide and protein molecules affect interactions; specific interactions between charged groups on the cell surface and on the solid surface, hydrogen bonding or the formation of cellular bridges may all occur to complicate the picture.
6.7.3 Blood as a colloidal system
Blood is a non-Newtonian suspension showing a shear-dependent viscosity. At low rates of shear, erythrocytes form cylindrical aggregates (rouleaux), which break up when the rate of shear is increased. Calculations show that the shear rate (D) associated with blood flow in large vessels such as the aorta is about 100 s−1, but for flow in capillaries it rises to about 1000 s−1. The flow characteristics of blood are similar to those of emulsions except that, while shear deformation of oil globules can occur with a consequent change in surface tension, no change in membrane tension occurs on cell deformation.
Velocity gradients in blood vessels are reduced in cases of retarded peripheral circulation, especially in shock. Under these conditions erythrocytes may aggregate and the discovery of agents that are capable of reducing this structural viscosity is thus of great clinical value. Dextrans and polyvinylpyrrolidones diminish attraction between individual cells in blood and improve flow properties.
Aggregation of platelets involves a contact phase and an adhesive phase, shown diagrammatically in Fig. 6.48. Shearing effects of blood may dislodge platelets. Interest in platelet interaction with simpler surfaces has been stimulated by the increasing use of plastic prosthetic devices which come into contact with blood.
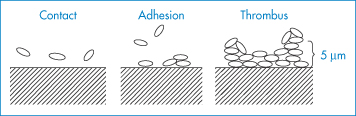
Figure 6.48 Sequence in the formation of a thrombus at a surface, involving three stages: contact, adhesion and thrombus growth.
While we do not have a clear idea of the physical and chemical properties of surfaces that are responsible for the attraction of platelets, a relationship between adhesion and the critical surface tension of uncharged hydrophobic surfaces has been demonstrated. The number of platelets adsorbed increases as the critical surface tension increases. There is other evidence that platelets adhere readily to high-energy hydrophilic surfaces and less readily to low-energy hydrophobic surfaces. Thus platelet adhesion to glass is reduced following coating of the latter with dimethylsiloxane.
6.8 Foams
Aqueous foams are formed from a three-dimensional network of surfactant films in air. They are disperse systems with a high surface area. Consequently, foams tend to collapse spontaneously. They can, however, if suitably stabilised, be used as formulations for the delivery of enemas and topical products. There are several parameters that contribute to the stability of foams:
- foam viscosity
- foam drainage rates
- foam deformation
- foam density
- foam structure.
There is a European Pharmacopoeia monograph on medicated foams. Relative foam density is an indication of foam ‘firmness’ and foam ‘expansion time’ which relates to the foamability of a formulation. The density of foams (FD) is measured by weighing a volume of foam compared to the same volume of water,

Foams that develop in production of liquids or in ampoules are troublesome, hence there is an interest in breaking foams and preventing foam formation. The breaking and prevention of liquid foams are less well understood than the stabilisation of foams. It is recognised, however, that small quantities of specific agents can reduce foam stability markedly. There are two types of such agent:
1. foam breakers, which are thought to act as small droplets forming in the foam lamellae (Fig. 6.49)
2. foam preventatives, which are thought to adsorb at the air–water interface in preference to the surfactants that stabilise the thin films. Once adsorbed they do not have the capacity to stabilise the foam.
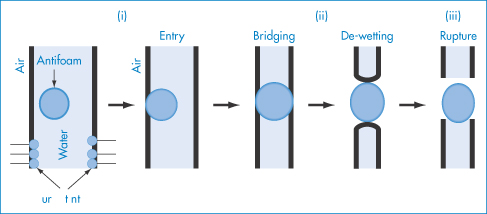
Figure 6.49 A schematic drawing of the antifoaming mechanism of antifoam droplets: (i) entering a foam lamella; (ii) bridging–de-wetting; and (iii) rupturing the foam wall.
Reproduced from Perry D et al. Foam Control in Aqueous Coatings. Midland, MI, USA: Dow Corning Corporation; 2001.
It is well established that pure liquids do not foam. Transient foams are obtained with solutes such as short-chain aliphatic alcohols or acids that lower the surface tension moderately; really persistent foams arise only with solutes that lower the surface tension strongly in dilute solution – the highly surface-active materials such as detergents and proteins. The physical chemistry of the surface layers of the solutions is what determines the stability of the system.
Ordinarily, three-dimensional foams of surfactant solutes persist for a matter of hours in closed vessels. Gas slowly diffuses from the small bubbles to the large ones (since the pressure and hence thermodynamic activity of the gas within the bubbles are inversely proportional to bubble radius). Diffusion of gas leads to a rearrangement of the foam structures and this is often sufficient to rupture the thin lamellae in a well-drained film.
The most important action of an antifoam agent is to eliminate surface elasticity – the property that is responsible for the durability of foams. To do this it must displace foam stabiliser. It must therefore have a low interfacial tension in the pure state to allow it to spread when applied to the foam, and it must be present in sufficient quantity to maintain a high surface concentration. Many foams can be made to collapse by applying drops of liquids such as ether, or long-chain alcohols such as octanol. Addition of ether, which has a low surface tension, to an aqueous foam will locally produce regions with a low surface tension. These regions are rapidly pulled out by surrounding regions of higher tension. The foam breaks because the ethereal region cannot stretch. Long-chain alcohols also break foams because the surface is swamped by rapidly diffusing molecules so that changes in surface tension are rapidly reversed (that is, elasticity disappears).
Generally more effective and more versatile than any soluble antifoams are the silicone fluids, which have surface tensions as low as 20 mN m−1. Quantities of the order of 1–60 ppm prevent foaming in fermentation vats, sewage tanks and dyebaths. Antifoam droplets are seen in Fig. 6.49 entering the foam lamella, bridging between the surfaces, de-wetting and then rupturing the foam wall.
|
X-ray studies have clearly shown the presence of foam in the upper gastrointestinal tract in humans. Silicone antifoaming agents derive their value from their ability to change the surface tension of the mucus-covered gas bubbles in the gut and thus to cause the bubbles to coalesce. A range of polydimethylsiloxanes is available commercially, including Dimethicone 20, 200, 350, 500 and 1000 (the numbers refer to the viscosity of the oil in centistokes). In simple in vitro tests, polydimethylsiloxane of molecular weight used in pharmaceutical formulations (Dimethicone 1000) has poor antifoaming properties. The addition of a small percentage (2–8%) of hydrophobic silica, which on its own is a weak defoamer, increases the antifoaming effect, the finely divided silica particles being suspended in the silicone fluid. The product is a simple physical mixture of silica and polydimethylsiloxane. |

Some in vivo results are listed in Table 6.8. The incorporation of these materials into antacid tablets is widespread; certain antacids have been found, however, to adsorb the polydimethylsiloxane and reduce its antifoaming potential.21
Table 6.8 In vivo effects of polydimethylsiloxane (PDMS)
Treatment by mouth | Volume (cm3) | Dose (mg/rat) | Mean percentage reductiona in foam height (± SEM) | |
|
| PDMS | Silica |
|
PDMS | 0.25 | 250 |
| 19 ± 4 |
| 0.50 | 500 |
| 29 ± 6 |
| 1.00 | 1000 |
| 56 ± 6 |
| 2.00 | 2000 |
| 84 ± 3 |
PDMS containing 65 w/v silica | 0.005 | 4.7 | 0.2 | 45 ± 6 |
| 0.01 | 9.4 | 0.6 | 58 ± 5 |
| 0.02 | 18.9 | 1.1 | 61 ± 5 |
| 0.04 | 37.7 | 2.0 | 87 ± 2 |
Reproduced from Birtley RDN et al. J Pharm Pharmacol 1973;25:859.
a Ten rats in each group; foam induced by saponin.
Summary
This chapter has covered the topic of pharmaceutical colloids, with a special emphasis on emulsions and suspensions. These have been rather traditional pharmaceutical forms, but they are attracting increasing interest because of increased knowledge of the biodistribution and fate of colloidal particles in the body, and the need to deliver highly lipophilic and often very potent drugs in carriers. Emulsions, microemulsions and solid suspensions are all, therefore, important in modern drug delivery.
The chapter has dealt with the stability and stabilisation of colloidal systems and covered topics such as their formation and aggregation. If the particle size of a colloidal particle determines its properties (such as its viscosity or its fate in the body), then maintenance of that particle size throughout the lifetime of the product is important. The emphasis in the section on stability is therefore understandable. Various forms of emulsions, microemulsions and multiple emulsions have also been discussed, while other chapters deal with other important colloidal systems, such as protein and polymer micro- and nanospheres and phospholipid and surfactant vesicles. Suspensions also feature in processing technologies, as in the formation of granules and spherules where a powder–liquid mass is the basis for further processing. Some aspects of these systems are discussed and should be read in the light of an understanding of contact angles and solid-surface hydrophobicities.
Towards the end of the chapter we point out the biological importance of an understanding of colloid chemistry and several examples of biological importance are covered. Pharmaceutical and biological colloids are often very complex systems, but even so the fundamental principles can be applied to obtain an appreciation of the behaviour of systems such as blood, platelets and microorganisms when they come in contact with inert or biological surfaces. In simplifying the concepts here, we do not pretend that there are no other forces at work. It is nonetheless useful to think of complex systems in a straightforward physicochemical manner, as pointed out in the introduction to the book.
References
1. Gao X et al. Calculation of hydrophile–lipophile balance for polyethoxylated surfactants by group contribution method. J Colloid Interface Sci 2006;298:441–450.
2. Suitthimeathegorn O et al. Novel anhydrous emulsions: formulation as controlled release vehicles. Int J Pharm 2005;298:367–371.
3. Hoar TP, Schulman JT. Transparent water-in-oil dispersions: the oleopathic hydro-micelle. Nature 1943; 152:102–103.
4. Date AA, Nagarsenker MS. Parenteral microemulsions: an overview. Int J Pharm 2008;355:19–30.
5. Ansari MJ et al. Microemulsions as potential delivery systems: a review. PDA J Pharm Sci Technol 2008;62:66–79.
6. Kovarik JM et al. Cyclosporine pharmacokinetics and variability from a microemulsion formulation – a multicenter investigation in kidney transplant patients. Transplantation 1994;58:658–663.
7. Mueller EA et al. Improved dose linearity of cyclosporine pharmacokinetics from a microemulsion formulation. Pharm Res 1994;11:301–304.
8. Barry BW. Structure and rheology of emulsions stabilized by mixed emulsifiers. Rheol Acta 1971;10:96–105.
9. Nyman Y et al. Etomidate-Lipuro is associated with considerably less injection pain in children compared with propofol with added lidocaine. Br J Anaesth 2006;97:536–539.
10. Kam E et al. Comparison of propofol-Lipuro with propofol mixed with lidocaine 10 mg on propofol injection pain. Anaesthesia 2004;59:1167–1169.
11. Suttmann H et al, A new formulation of etomidate in lipid emulsion. Bioavailability and venous irritation. Anaesthesist 1989;38:421–423.
12. Gangineni K et al. Propofol and peanut allergy (letter). Anaesthesia 2007;62:1191.
13. Yamaguchi T et al. Distribution of prostaglandin E1 in lipid emulsion in relation to release rate from lipid particles. Chem Pharm Bull 1994;42:446–450.
14. Kaplan A, Whelan M. (2012) The use of IV lipid emulsion for lipophilic drug toxicities. J Am Anim Hosp Assoc 2012;48:221–227.
15. Whateley TL et al. Particle size stability of Intralipid and mixed total parenteral nutrition mixtures. J Clin Hosp Pharm 1984;91:13–26.
16. Henderson NL et al. Approximate rates of shear encountered in some pharmaceutical processes. J Pharm Sci 1961;50:788–791.
17. Costello I et al. Paediatric Drug Handling. London: Pharmaceutical Press; 2007.
18. Schein LB. Recent progress and continuing puzzles in electrostatics. Science 2007;316:1572–1573.
19. Kwok PCL et al. Electrostatic charge characteristics of aerosols produced from metered dose inhalers. J Pharm Sci 2005;94:2789–2799.
20. Marshall KC et al. Mechanism of the initial events in the sorption of marine bacteria to surfaces. J Gen Microbiol 1971;68:337–348.
21. Rezak MJ. In vitro determination of deforming inactivation of silicone antacid tablets. J Pharm Sci 1966;55:538–539.
Stay updated, free articles. Join our Telegram channel

Full access? Get Clinical Tree


