6 Atomic spectrophotometry
Atomic emission spectrophotometry (AES)
Introduction
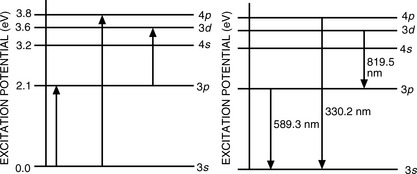
Atoms contain various energy states, as illustrated in Figure 6.1 for the sodium atom. The normal unexcited state is the ground state. Sodium contains one electron in its outer (3p) orbital and, if energy is gained by the atom, this electron may be excited to a higher state and then subsequently lose its excess energy by falling back to a lower energy orbital. Thus, when a sodium salt is heated in a flame, the outer electrons in the volatilised atoms are excited and then return to the ground state with emission of energy, which appears, for example, as yellow light (wavelength 589.3 nm). The major line in the sodium emission spectrum is due to an electron falling from the 3p excited state to the 3s ground state; the atomic emission spectrum of sodium contains two other major lines, at 819.5 nm and 330.2 nm, due to the transitions shown in Figure 6.1. Atomic emission lines are very narrow (< 0.01 nm). Only a limited number of elements are sufficiently excited by thermal energy for AES measurements to be carried out. Common elements with emission lines suitable for utilisation in their quantitation are Ca, Ba, Na, Li and K.
Instrumentation
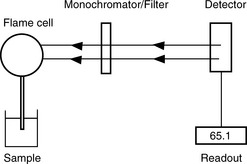
An atomic emission spectrophotometer (Fig. 6.2) is composed of the following components:
(i) Flame. The sample containing the metal is volatilised in a natural gas/compressed air flame at 2000°C. A higher temperature (2500°C) may be obtained using air/acetylene and is required for analysis of Mg by AES.
(ii) Monochromator/Filter. The radiation emitted by the excited atoms is passed through a filter, or a monochromator in more expensive instruments. Thus a narrow band of emitted radiation is selected and interfering sources of radiation such as the flame and other components in the sample are screened out.
(iii) Detector. The intensity of the selected radiation is then measured using a photosensitive cell.
Examples of quantitation by AES
Assay of sodium and potassium ions in an i.v. infusion
(i) •Weight of NaCl used to prepare standard solution = 0.5092 g
(ii) Dilutions were carried out on standards:
(iii) The infusion solution was diluted as follows:
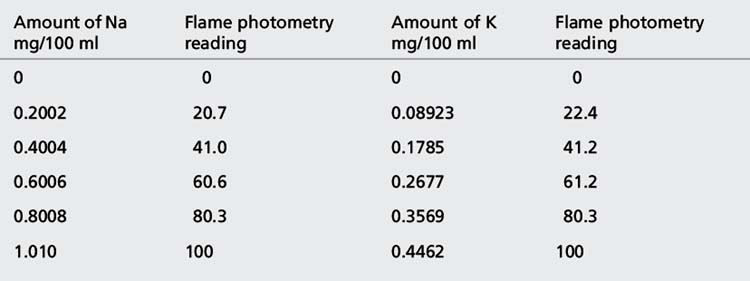
(iv) The instrument was used with a sodium filter to establish the sodium calibration curve and then the sodium in the sample. The instrument was switched to a potassium filter in order to determine the potassium calibration curve and the potassium in the sample. Table 6.1 shows the readings obtained for sodium (Na) and potassium (K) in the calibration solutions as well as the concentrations of Na and K in the calibration solutions (calculated below). Calculate the concentrations of Na and K in the infusion solution in mmoles/l. Atomic weights: Na = 23; K = 39.1; Cl = 35.5.
Dilutions of standards
Step 2: Point 1 = 5 to 100 (× 20).
Total dilution = 5 × 20 = 100.
Concentrations in solution used for point 1.
The rest of the points in the calibration series are simply × 2, × 3, × 4 and × 5. These values give the concentrations in Table 6.1.
The equations of the lines obtained for the above data were:
Reading of diluted sample for Na = 70.2. Reading of diluted sample for K = 70.6.
The following readings were obtained for the calibration series: 0, 20.3, 40.1, 60.3, 80.1 and 100.
Answer: (From a computer-fitted calibration curve) K 496.2 mg per tablet
Stay updated, free articles. Join our Telegram channel

Full access? Get Clinical Tree


