11 Gas chromatography
Selectivity of liquid stationary phases
Summary of parameters governing capillary GC performance
Applications of GC in quantitative analysis
Determination of manufacturing and degradation residues by GC
Determination of residual solvents
Solid-phase microextraction (SPME)
Applications of GC in bioanalysis
Applications
• The characterisation of some unformulated drugs, particularly with regard to detection of process impurities.
• Limit tests for solvent residues and other volatile impurities in drug substances.
• Sometimes used for quantification of drugs in formulations, particularly if the drug lacks a chromophore.
• Characterisation of some raw materials used in synthesis of drug molecules.
• Characterisation of volatile oils (which may be used as excipients in formulations), proprietary cough mixtures and tonics, and fatty acids in fixed oils.
• Measurement of drugs and their metabolites in biological fluids.
Strengths
• Capable of the same quantitative accuracy and precision as high-pressure liquid chromatography (HPLC), particularly when used in conjunction with an internal standard.
• Has much greater separating power than HPLC when used with capillary columns.
• Can be used to determine compounds which lack chromophores.
• The mobile phase does not vary and does not require disposal and, even if helium is used as a carrier gas, is cheap compared to the organic solvents used in HPLC.
Limitations
• Only thermally stable and volatile compounds can be analysed.
• The sample may require derivatisation to convert it to a volatile form, thus introducing an extra step in analysis and, potentially, interferants.
• Quantitative sample introduction is more difficult because of the small volumes of sample injected.
• Aqueous solutions and salts cannot be injected into the instrument.
Introduction
The use of gas chromatography (GC) as a quantitative technique in the analysis of drugs has declined in importance since the advent of high-pressure liquid chromatography (HPLC) and the increasing sophistication of this technique. However, it does still have a role in certain types of quantitative analysis and has broad application in qualitative analysis. Since HPLC currently dominates quantitative analyses in the pharmaceutical industry, the strengths of GC may be overlooked. Capillary GC is capable of performing much more efficient separations than HPLC, albeit with the limitation that the compounds being analysed must be volatile or must be rendered volatile by formation of a suitable derivative1 and must also be thermally stable. GC is widely used in environmental science, brewing, the food industry, perfumery and flavourings analysis, the petrochemical industry, microbiological analyses and clinical biochemistry. Although packed column GC is still used in the pharmaceutical industry, this chapter will concentrate to a large extent on open tubular capillary GC, which is the more modern manifestation of GC.
Instrumentation
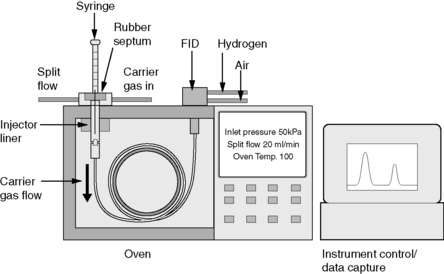
Figure 11.1 shows a schematic diagram of a GC system. The principles of the system are that:
(i) Injection of the sample may be made, manually or using an autosampler, through a re-sealable rubber septum.
(ii) The sample is evaporated in the heated injection port area and condenses on the head of the column.
(iii) The column may be either a capillary or a packed column, which will be discussed in more detail later. The mobile phase used to carry the sample through the column is a gas – usually nitrogen or helium.
(iv) The column is enclosed in an oven which may be set at any temperature between ambient and ca 400°C.
(v) The most commonly used detector is the flame ionisation detector (FID).
Syringes
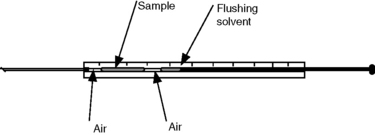
The volumes injected in GC are routinely in the range of 0.5–2 μl. The most commonly used type of syringe is shown in Figure 11.2; the usual syringe volumes are 5 and 10 μl. A recommended technique for injection into a capillary GC is to fill the syringe with about 0.5 μl of solvent and draw this solvent into the barrel slightly before filling with sample. The sample is also drawn into the barrel to leave an air gap below it. The syringe needle can then be introduced into the injector and left for a couple of seconds to warm up before the plunger is depressed. The syringe is then withdrawn immediately from the injection port.
Injection systems
Packed column injections
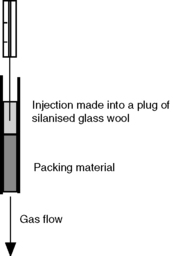
Injection generally occurs through a re-sealable rubber septum. The injector port is held at 150–250° depending on the volatility of the sample and direct injection of 0.1–10 μl of sample is made onto the head of the column. The amount of sample injected onto a packed column is ca 1–2 μg per component. Injection into packed columns presents less of a problem than sample introduction into a capillary column, since all the sample is introduced into the packed column (Fig. 11.3). Thus, although packed columns do not produce high-resolution chromatography, this is their strength.
Split/splitless injection
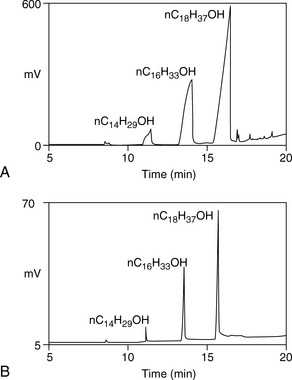
In the split mode, the sample is split into two unequal portions, the smaller of which goes onto the column. Split ratios range between 10:1 and 100:1, with the larger portion being vented in the higher flow out of the split vent. This technique is used with concentrated samples. Figure 11.4 shows a chromatogram of a 4 mg/ml solution of the pharmaceutical excipient cetostearyl alcohol injected in a GC split and splitless mode. In splitless mode the peak shapes are poor due to overloading of the column with too much sample. In the splitless mode, all the sample is introduced onto the column and the injector purge valve remains closed for 0.5–1 min after injection.
The difficulty faced with split/splitless injection onto a capillary column is in obtaining good injection precision.2
Attention has to be paid to certain points:
(i) Since injection is made at high temperatures into an injection port, a lack of precision resulting from decomposition of some of the components in a mixture before they reach the column has to be considered. Thus it is important to ensure that the sample has minimal contact with metal surfaces during the injection process, since these can catalyse decomposition.
(ii) If a split injection is used, care has to be taken that there is no discrimination between more and less volatile components in a mixture in terms of the proportion lost through the split vent.
(iii) If a splitless injection is made, volumes have to be kept below ca 2 μl in case the sample backflashes through rapid expansion of the solvent in which it is dissolved, into either the gas supply lines or the purge lines. Each 1 μl of solvent expands greatly upon vapourisation, e.g. methanol ca 0.66 ml/μl or ethyl acetate ca 0.23 ml/μl at atmospheric pressure.
(iv) Even if an internal standard (p. 287) is used to compensate for losses, the possibility of it being randomly discriminated against through differences in either volatility or decomposition compared with the sample has to be considered.
(v) In the splitless mode, the sample must be efficiently trapped at the head of the column. For this to occur, it must be sufficiently involatile, i.e. have a boiling point > ca 50°C higher than the column starting temperature. If the sample is relatively volatile, it has to be injected into the GC in a low-volatility solvent, which will condense at the head of the column, trapping the sample in the process. Figure 11.5 shows the effect of too high a starting temperature on the trapping of a volatile analyte resulting in misshapen peaks, which can be corrected by lowering the starting temperature and then programming the GC temperature to rise.
(vi) Sample transfer may be slow and it is important to take this into account when setting purge valve times, e.g. for a typical 1 ml/min flow of helium through a capillary column, about 0.5 min would be required to transfer a 2 μl injection volume of ethyl acetate onto the column.
(vii) Injection precision is greatly improved by the use of an autosampler to carry out injection since it can achieve much better precision in measuring volumes of ca 1 μl than a human operator.
Types of column
Packed columns
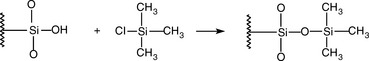
The columns are usually made from glass which is silanized to remove polar silanol Si–OH groups from its surface, which can contribute to the peak tailing of the peaks of polar analytes. These columns have internal diameters of 2–5 mm. The columns are packed with particles of a solid support which are coated with the liquid stationary phase. The most commonly used support is diatomaceous earth (mainly calcium silicate). This material is usually acid washed to remove mineral impurities and then silanized as shown in Figure 11.6 to remove the polar Si–OH groups on the surface of the support, which can lead to tailing of the analyte peak.
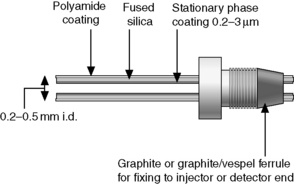
Capillary columns
Capillary columns are made from fused silica, usually coated on the outside with polyamide to give the column flexibility (Fig. 11.7). Coating on the outside with aluminium has also been used for high temperature (> 400°C) work. The internal diameter of the columns ranges between 0.15 and 0.5 mm. The wall of the column is coated with the liquid stationary phase, which may have a thickness between 0.1 and 5 μm. The most common type of coating is based on organo silicone polymers, which are chemically bonded to the silanol groups on the wall of the column and the chains of the polymers are further cross-linked. These types of phases have more or less replaced the wall-coated open tubular (WCOT) and support-coated open tubular (SCOT) columns, which are reported in earlier literature, for most routine applications. SCOT columns are sometimes encountered in very high temperature work. The wall-bonded phases are stable to at least 325°C and some types of coating will withstand temperatures of 370°C. The non-silicone-based polymers, e.g. carbowax, cannot be bonded onto the wall of the column in the same way and columns with these coatings are less temperature stable. For instance, the temperature limit for a carbowax capillary column is ca 240°C. The most commonly used carrier gas in capillary GC is helium and the flow rates used are between 0.5 and 2 ml/min. Since the flow rate from the end of the capillary column is low compared to the internal space of some detectors, ‘make up’ gas often has to be added to the gas flow post column in order to sweep the sample through the internal volume of the detector at a reasonable rate. Typically ca 100 ng per component is loaded onto a capillary column.
Selectivity of liquid stationary phases
Kovats indices and column polarity
Kovats indices (I-values) are based on the retention time of an analyte compared to retention times of the series of n-alkanes. For a particular GC phase, I-values are very reproducible from one column or from one GC to another. However, they are slightly affected by GC programming conditions. n-Alkanes have most affinity for non-polar phases and tend to elute more quickly from polar phases. In contrast, a polar analyte will elute more slowly from a polar phase and thus, relative to the n-alkanes, its retention time, and thus its I-value, will increase as the polarity of the GC phase increases. A measure of the polarity of a stationary phase is given by its McReynold’s constant (Table 11.1), which is based on the retention times of benzene, n-butanol, pentan-2-one, nitropropane and pyridine on a particular phase. The higher the McReynold’s constant, the more polar the phase. Many stationary phases are described by an OV-number. The higher the number after the OV, the more polar the phase.
Table 11.1 McReynold’s constants
| Phase | Chemical type | McReynold’s constant |
|---|---|---|
| Squalane | Hydrocarbon | 0 |
| Silicone OV-1 | Methylsilicone | 222 |
| Silicone SE-54 | 94% methyl, 5% phenyl, 1% vinyl | 337 |
| Silicone OV-17 | 50% methyl, 50% phenyl | 886 |
| Silicone OV-225 | 50% methyl, 25% cyanopropyl, 25% phenyl | 1813 |
| Carbowax | Polyethylene glycol | 2318 |
I-values provide a useful method for characterising unknown compounds and tables of I-values have been compiled for a large number of compounds.3 Under temperature programming conditions, where the GC temperature rises at a uniform rate, e.g. 10°C/min, a plot of the carbon numbers of n-alkanes (where 1 carbon = 100) against their retention times is a straight line. Under isothermal conditions, where the column is maintained at the same temperature throughout the analysis, a plot of carbon number against the logarithm of the retention times of the n-alkanes is a straight line. Such calibration curves can be used to convert the retention time of a compound into an I-value.
Examples of the separation of mixtures by GC
Analysis of peppermint oil on two GC phases
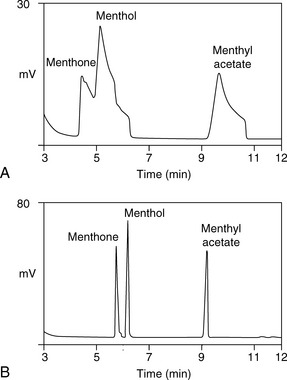
Figure 11.8 shows the structures of some of the major components in peppermint oil. The use of the retention index system is illustrated in Figures 11.8 and 11.9 for peppermint oil run in comparison with n-alkane standards on both a weakly polar OV-5-type column and a polar carbowax column.
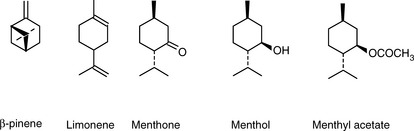
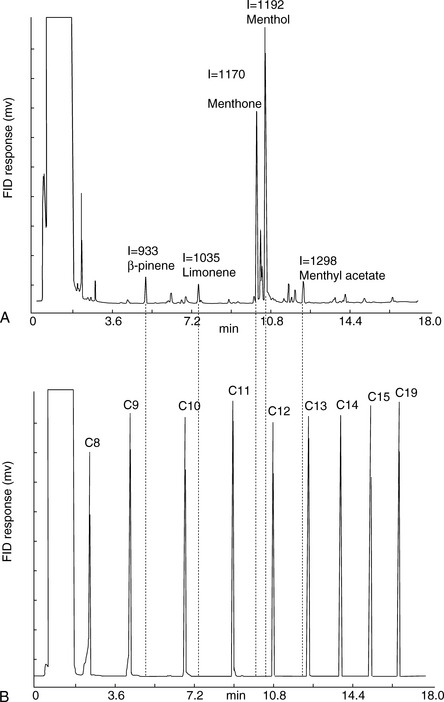
Figure 11.9 indicates approximate I-values for some of the components in peppermint oil on a BPX-5 column; this column selects mainly on the basis of molecular weight and shape. For example, ß-pinene has the same molecular weight as limonene but has a more compact shape and thus a lower I-value. Menthyl acetate has a higher I-value than menthol because of its higher molecular weight.
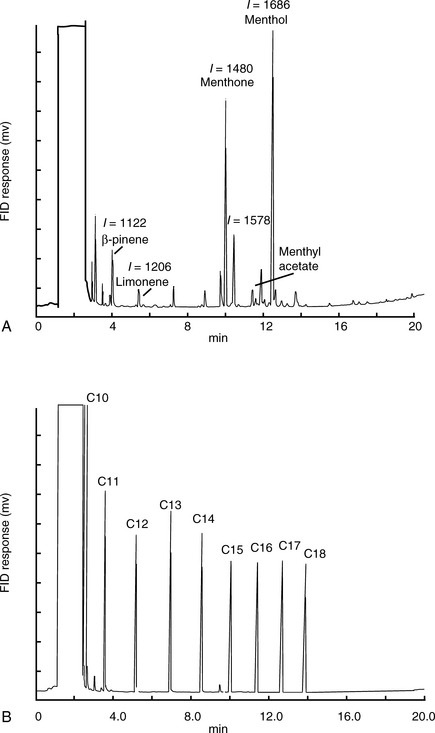
A carbowax column is highly selective for polar compounds. As can be seen in Figure 11.10, the group of polar compounds including menthol and menthone is resolved more extensively on a carbowax column, with the alcohol menthol and a number of other minor alcohols eluting at around 12 min. In addition, the less polar ketone menthone and a number of minor ketones elute at around 10 min. Menthyl acetate, which on the non-polar BPX-5 column ran later than menthol, runs earlier than menthol on the carbowax column because its polar alcohol group is masked by the acetate and it thus has a lower polarity than menthol.
Analysis of the fatty acid composition of a fixed oil by GC
• palmitic acid (16:0) 4.0–9.0%
• palmitoleic acid (16:1) < 0.6%
• stearic acid (18:0) 0.9–2.0%
• oleic acid (18:1) 62.0–86.0%
• linoleic acid (18:2) (7.0–30.0%)
• linolenic acid (18:3) < 0.2%
• arachidic acid (20:0) < 0.1%
Stay updated, free articles. Join our Telegram channel

Full access? Get Clinical Tree


