13 Thin-layer chromatography
Principles
• An analyte migrates up or across a layer of stationary phase (most commonly silica gel), under the influence of a mobile phase (usually a mixture of organic solvents), which moves through the stationary phase by capillary action. The distance moved by the analyte is determined by its relative affinity for the stationary vs the mobile phase.
Strengths
• Detection by chemical reaction with a visualisation reagent can be carried out, which means that more or less every type of compound can be detected if a suitable detection reagent is used.
• In conjunction with densitometric detection, it can be used as a quantitative technique for compounds which are difficult to analyse by other chromatographic methods because of the absence of a chromophore.
• Since all the components in the chromatographic system can be seen, there is no risk, as is the case in gas chromatography (GC) and HPLC analyses, that some components are not observed because they do not elute from the chromatographic system.
• Batch chromatography can be used to analyse many samples at once, increasing the speed of analysis, and can be automated.
• The method is flexible since thin-layer chromatography (TLC) plates can be simply treated with a variety of chemicals, thus imparting a wide range of properties to the stationary phase.
Limitations
• The number of theoretical plates available for separation is limited in routine TLC systems, although high-performance TLC (HPTLC) plates can offer nearly the same efficiency in a 10 cm distance as an HPLC column of the same length.
• Sensitivity is often limited
• Not suitable for volatile compounds
Introduction
Thin-layer chromatography (TLC) has developed into a very sophisticated technique for identification of compounds and for determination of the presence of trace impurities. Since it was one of the earliest chromatographic techniques, a huge array of TLC-based tests is available and pharmacopoeial monographs reflect the extent to which this technique has been developed as a fundamental quality control technique for trace impurities. The reason for its prominence in this regard is due to its flexibility in being able to detect almost any compound, even some inorganic compounds. Following TLC, the entire chromatogram can be seen and thus there is no doubt over whether or not components in a sample have failed to elute from a chromatographic system, as is the case with HPLC and GC, and even capillary electrophoresis (CE). In this short chapter it would be impossible to outline all of the tests that can be used; comprehensive reviews of the technique have been written.1,2 Even the most advanced form of TLC, high-performance TLC (HPTLC), remains essentially a simple technique. The sophistication in the application of the technique derives from the broad choice of stationary phases, mobile phases and the wide range of spray reagents which can be used for visualising the chromatogram.
The advances in the technology of the technique have been recently reviewed3 and these include the use of high-pressure TLC and interfacing with detection systems such as Raman spectroscopy and mass spectrometry.
Instrumentation
Figure 13.1 shows a simple thin-layer chromatography apparatus.
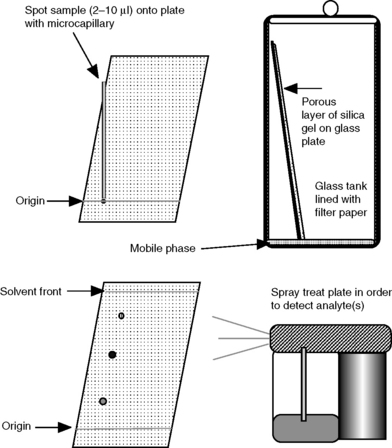
(i) A few μl of sample solution are slowly spotted onto the plate at the origin. If more than ca 1 μl is applied at once, the spot will spread too far. The spot has to be allowed to dry between each application of 1 μl. Loadings of sample are typically 20 μg.
(ii) The bottom 0.5 cm of the plate is immersed in the mobile phase contained in a tank and the liquid mobile phase is allowed to travel up the silica gel plate by capillary action.
(iii) The more polar a compound is the more it adsorbs (partitions into) the silica gel stationary phase, the less time it spends in the mobile phase as it travels up the plate and thus the shorter the distance it travels up the plate in a given time.
TLC chromatogram
A diagram of a typical thin-layer chromatography plate after development and spraying to locate the analytes is shown in Figure 13.2.
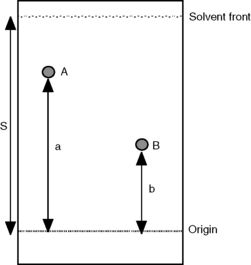
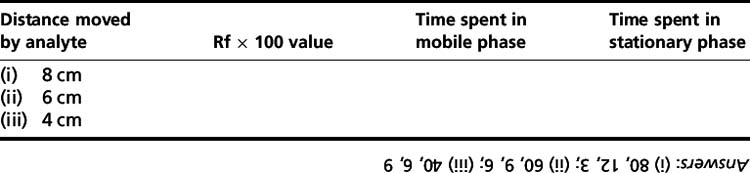
In Figure 13.2, compound A is less polar than compound B since it travels further with the mobile phase in the same time. The distance travelled by the compound from the origin (where the compound is put onto the plate) divided by the distance travelled by the solvent from the origin is called the ‘Rf value’ of the compound. For example, for compound A, Rf = a/S; for compound B, Rf = b/S; the Rf is usually quoted as a Rf × 100 value. The area/intensity of a spot on a TLC plate is logarithmically related to the concentration of the analyte producing it.
Stationary phases
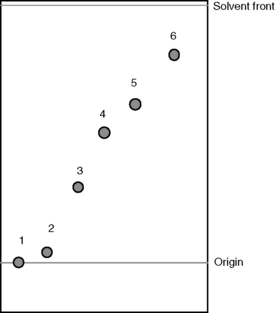
Silica gel (Fig. 13.3) is the most commonly used adsorbant for TLC. The rate at which compounds migrate up a silica gel plate depends on their polarity. In a given length of time, the most polar compounds move the least distance up the plate while the least polar move the furthest (Fig 13.4).
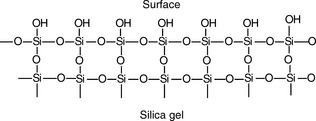
Although silica gel is used widely, some other polar stationary phases are also used in pharmacopoeial tests; silica gel may also be used in modified form. Some examples of stationary phases are given in Table 13.1.
Table 13.1 Stationary phases which are commonly used in TLC
| Stationary phase | Description | Applications |
| Silica gel G | Silica gel with average particle size 15 μm containing ca 13% calcium sulphate binding agent | Use in a wide range of pharmacopoeial tests. In practice commercial plates may be used which contain a different type of binder |
| Silica gel GF254 | Silica gel G with fluorescent agent added | The same types of applications as silica G where visualisation is to be carried out under UV light |
| Cellulose | Cellulose powder of less than 30 μm particle size | Identification of tetracyclines |
| Keiselguhr G | Diatomaceous earth containing calcium sulphate binder | Used as a solid support for stationary phases such as liquid paraffin used in analysis of fixed oils |
Elutropic series and mobile phases
As described in Chapter 12, the strength of a mobile phase depends on the particular solvent mixture used. Table 13.2 lists common solvents in order of increasing polarity. The more polar a solvent or solvent mixture, the further it will move a polar compound up a silica gel TLC plate. When non-polar compounds are being analysed, there will not be a marked increase in the distance migrated with increasing polarity of the mobile phase since they migrate towards the solvent front under most conditions. Although water is polar, there are practical difficulties in using pure water as a solvent since many organic compounds are not very soluble in water; thus it is usually used in mobile phases containing a water-miscible organic solvent such as methanol. Quite subtle changes in separation can be achieved by using complex mixtures of solvents. Because of its simplicity, TLC is often used as a preliminary screen for identifying drugs, and thus mobile phases have been developed which ensure that a particular drug will have a quite different Rf value in one system compared with another.
| Solvent | Polarity index |
| Hexane (C6H14) | 0 |
| Toluene (C7H8) | 2.4 |
| Diethylether (C4H10O) | 2.8 |
| Dichloromethane (CH2Cl2) | 3.1 |
| Butanol (C4H9OH) | 3.9 |
| Chloroform (CHCl3) | 4.1 |
| Ethyl acetate (C2H5COOCH3) | 4.4 |
| Acetone (CH3COCH3) | 5.1 |
| Methanol (CH3OH) | 5.1 |
| Ethanol (C2H5OH) | 5.2 |
| Acetonitrile (CH3CN) | 5.8 |
| Acetic acid (CH3COOH) | 6.2 |
| Water (H2O) | 9.0 |
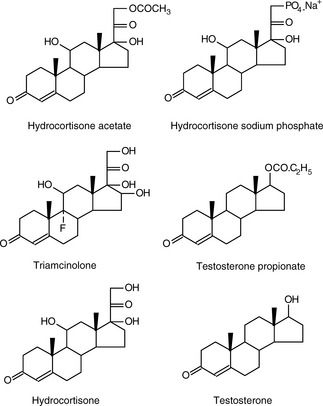
The steroids below are spotted onto a silica gel TLC plate. The plate is developed in methylene chloride/ether/methanol/water (77:15: 8:1.2) and under UV light has the appearance shown in Figure 13.4. From your knowledge of the polarity of organic molecules, match the steroids to the spots on the TLC plate shown in Figure 13.4.
Stay updated, free articles. Join our Telegram channel

Full access? Get Clinical Tree


