1 Control of the quality of analytical methods
Introduction
Pharmaceutical analysis procedures may be used to answer any of the questions outlined in Box 1.1. The quality of a product may deviate from the standard required but in carrying out an analysis one also has to be certain that the quality of the analysis itself is of the standard required. Quality control is integral to all modern industrial processes and the pharmaceutical industry is no exception. Testing a pharmaceutical product involves chemical, physical and sometimes microbiological analyses. It has been estimated that £10 billion is spent each year on analyses in the UK alone and such analytical processes can be found in industries as diverse as those producing food, beverages, cosmetics, detergents, metals, paints, water, agrochemicals, biotechnological products and pharmaceuticals. With such large amounts of money being spent on analytical quality control, great importance must be placed on providing accurate and precise analyses (Box 1.2). Thus it is appropriate to begin a book on the topic of pharmaceutical analysis by considering, at a basic level, the criteria which are used to judge the quality of an analysis. The terms used in defining analytical quality form a rather elegant vocabulary that can be used to describe quality in many fields, and in writing this book the author would hope to describe each topic under consideration with accuracy, precision and, most importantly, reproducibility, so that the information included in it can be readily assimilated and reproduced where required by the reader. The following sections provide an introduction to the control of analytical quality. More detailed treatment of the topic is given in the reference cited at the end of the chapter.1
Box 1.1 Questions pharmaceutical analysis methods are used to answer
• Is the identity of the drug in the formulated product correct?
• What is the percentage of the stated content of a drug present in a formulation?
• Does this formulation contain solely the active ingredient or are additional impurities present?
• What is the stability of a drug in the formulation and hence the shelf-life of the product?
• At what rate is the drug released from its formulation so that it can be absorbed by the body?
• Do the identity and purity of a pure drug substance to be used in the preparation of a formulation meet specification?
• Do the identity and purity of excipients to be used in the preparation of a formulation meet specification?
• What are the concentrations of specified impurities in the pure drug substance?
• What is the concentration of the drug in a sample of tissue or biological fluid?
• What are the pKa value(s), partition coefficients, solubilities and stability of a drug substance under development?
Box 1.2 International Conference on Harmonisation (ICH) guidelines
The requirements for control of the quality of methods of analysis (validation) have been addressed by the International Conference on Harmonisation of Technical Requirements For Registration of Pharmaceuticals for Human Use, or, more briefly, the ICH (www.ich.org). The ICH was initiated in Brussels in 1990 and brought together representatives of regulatory agencies and industry associations of Europe, Japan and the USA. The purpose of the organisation was to standardise the requirements for medicines regulation throughout the world. The standardisation of the validation of analytical procedures is one area that the ICH has addressed. The ICH indicated that the most important analytical procedures that require validation are:
Control of errors in analysis
Student 1: 99.5%, 99.9%, 100.2%, 99.4%, 100.5%
Student 2: 95.6%, 96.1%, 95.2%, 95.1%, 96.1%
Student 3: 93.5%, 98.3%, 92.5%, 102.5%, 97.6%
The means of these results can be simply calculated according to the formula:
 [Equation 1]
where  is the arithmetic mean, xi is the individual value and n is the number of measurements.
These results can be seen diagrammatically in Figure 1.1.
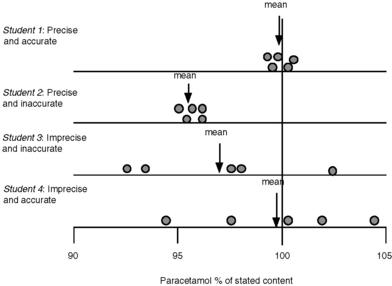
Fig. 1.1 Diagrammatic representation of accuracy and precision for analysis of paracetamol in tablet form.
In practice it might be rather difficult to tell whether student 1 or student 2 had carried out the best analysis, since it is rare, unless the sample is a pure analytical standard, that the exact content of a sample is known. In order to determine whether student 1 or 2 had carried out the best assay it might be necessary to get other analysts to obtain similar sets of precise results in order to be absolutely sure of the correct answer. The factors leading to imprecision and inaccuracy in assay results are outlined in Box 1.3.
Box 1.3 Some factors giving rise to imprecision and inaccuracy in an assay
• Incorrect weighing and transfer of analytes and standards
• Inefficient extraction of the analyte from a matrix, e.g. tablets
• Incorrect use of pipettes, burettes or volumetric flasks for volume measurement
• Measurement carried out using improperly calibrated instrumentation
• Failure to use an analytical blank
• Selection of assay conditions that cause degradation of the analyte
• Failure to allow for or to remove interference by excipients in the measurement of an analyte
Suggest how the following might give rise to errors in an analytical procedure:
(i) Analysis of a sucrose-based elixir using a pipette to measure aliquots of the elixir for analysis.
(ii) Weighing out 2 mg of an analytical standard on a four-place analytical balance which weighs a minimum of 0.1 mg.
(iii) Use of an analytical standard that absorbs moisture from the atmosphere.
(iv) Incomplete powdering of coated tablets prior to extraction.
(v) Extraction of an ointment with a solvent in which it is poorly soluble.
(vi) Use of a burette that has not been rinsed free of traces of grease.
Accuracy and precision
The most fundamental requirements of an analysis are that it should be accurate and precise. It is presumed, although it cannot be proven, that a series of measurements (y) of the same sample will be normally distributed about a mean (μ), i.e. they fall into a Gaussian pattern as shown in Figure 1.2.
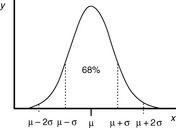
The distance σ shown in Figure 1.2 appears to be nearly 0.5 of the width of distribution; however, because the function of the curve is exponential it tends to zero and does not actually meet the x axis until infinity, where there is an infinitesimal probability that there may be a value for x. For practical purposes approximately 68% of a series of measurements should fall within the distance σ either side of the mean and 95% of the measurements should lie with 2σ of the mean. The aim in an analysis is to make σ as small a percentage of the value of μ as possible. The value of σ can be estimated using Equation 2:
 [Equation 2]
 = mean of the measurements
Sometimes n rather than n – 1 is used in the equation but, particularly for small samples, it tends to produce an underestimate of σ. For a small number of values it is simple to work out s using a calculator and the above equation. Most calculators have a function which enables calculation of s directly and σ estimated using the above equation is usually labelled as σn – 1. For instance, if the example of results obtained by student 1, where the mean is calculated to be 99.9%, are substituted into equation 2, the following calculation results:
The calculated value for s provides a formal expression of the scatter in the results from the analysis rather than the visual judgement used in Figure 1.1. From the figure obtained for the standard deviation (SD), we can say that 68% of the results of the analysis will lie within the range 99.9 ± 0.46% (± σ) or within the range 99.44–100.36%. If we re-examine the figures obtained by student 1, it can be seen that 60% of the results fall within this range, with two outside the range, including one only very slightly below the range. The range based on ± σ defines the 68% confidence limits; for 95% confidence ± 2σ must be used, i.e. 95% of the results of student 1 lie within 99.9 ± 0.92% or 98.98–100.82%. It can be seen that this range includes all the results obtained by student 1.
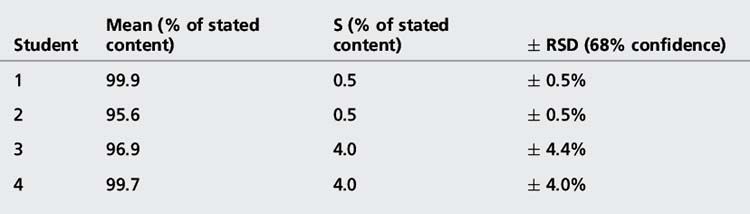
The precision of an analysis is often expressed as the ± relative standard deviation (± RSD) (Equation 3).
 [Equation 3]
The confidence limits in this case are often not quoted but, since it is the SD that is an estimate of σ which is being used, they are usually 68%. The advantage of expressing precision in this way is that it eliminates any units and expresses the precision as a percentage of the mean. The results obtained from the assay of paracetamol tablets are shown in Table 1.1.
Validation of analytical procedures
The analytical procedure
(i) the quality and source of the reference standard for the compound being analysed
(ii) the procedures used for preparing solutions of the reference standard
(iii) the quality of any reagents or solvents used in the assay and their method of preparation
(iv) the procedures and settings used for the operation of any equipment required in the assay
(v) the methodology used for calibration of the assay and methodology used for the processing of the sample prior to analysis.
Repeatability
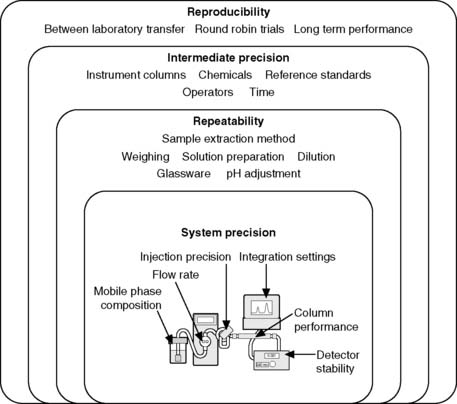
Repeatability expresses the precision obtained under the same operating conditions over a short interval of time. Repeatability can also be termed intra-assay precision. It is likely that the assay would be repeated by the same person using a single instrument. Within repeatability it is convenient to separate the sample preparation method from the instrument performance. Figure 1.3 shows the levels of precision including some of the parameters which govern the system precision of a high-pressure liquid chromatography (HPLC) instrument. It would be expected that the system precision of a well-maintained instrument would be better than the overall repeatibility where sample extraction and dilution steps are prone to greater variation than the instrumental analysis step.
An excellent detailed summary of levels of precision is provided by Ermer. For example Figure 1.4 shows the results obtained from five repeat injections of a mixture of the steroids prednisone (P) and hydrocortisone (H) into a HPLC using a manual loop injector. The mixture was prepared by pipetting 5 ml of a 1 mg/ml stock solution of each steroid into a 100 ml volumetric flask and making up to volume with water.
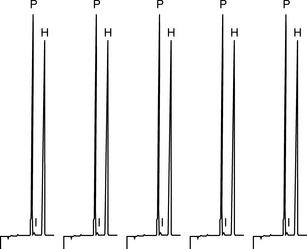
The precision obtained for the areas of the hydrocortisone peak is ± 0.3%; the injection process in HPLC is generally very precise and one might expect even better precision from an automated injection system, thus this aspect of system precision is working well. The precision obtained for the prednisone peak is ± 0.6%; not quite as good, but this is not to do with the injector but is due to a small impurity peak (I) which runs closely after the prednisone causing some slight variation in the way the prednisone peak is integrated. The integration aspect of the system precision is not working quite as well when challenged with a difficulty in the integration method but the effect is really only minor. For the repeat, analysis is carried out on a subsequent day on a solution freshly prepared by the same method. The injection precision for hydrocortisone was ± 0.2%. The variation for the means of the areas of hydrocortisone peaks obtained on the 2 days was ± 0.8%; this indicates that there was small variation in the sample preparation (repeatability) between the 2 days since the variation in injection precision is ± 0.2%–± 0.3%. Usually it is expected that instrument precision is better than the precision of sample preparation if a robust type of instrument is used in order to carry out the analysis. Table 1.2 shows the results for the repeat absorbance measurement of the same sample with a UV spectrophotometer in comparison with the results obtained from measurement of five samples by a two-stage dilution from a stock solution. In both cases the precision is good but, as would be expected, the better precision is obtained where it is only instrumental precision that is being assessed. Of course instruments can malfunction and produce poor precision, for example a spectrophotometer might be nearing the end of the useful lifetime of its lamp and this would result in poor precision due to unstable readings.
Table 1.2 Comparison of precision obtained from the repeat measurement of the absorbance of a single sample compared with the measurement of the absorbance of five separately prepared dilutions of the same sample
| Sample | Absorbance readings | RSD% |
| Repeat measurement | 0.842, 0.844, 0.842, 0.845, 0.841 | ± 0.14 |
| Repeat dilution/measurement | 0.838, 0.840, 0.842, 0.845, 0.847 | ± 0.42 |
A target level for system precision is generally accepted to be < ± 1.0%.
Stay updated, free articles. Join our Telegram channel

Full access? Get Clinical Tree


