To quantify the changes in drug concentration that mark the different phases of the PK profile of a drug, scientists commonly calculate a parameter referred to as the half-life or t1/2 (we have encountered this parameter in other contexts in Chapters 6–8 and Appendix 1). In their simplest forms, the distribution and clearance phases of drug PK can be modeled as single exponential decay processes; exponential decay is a very common kinetic process that describes many chemical, biochemical and biological systems in addition to drug PK (see Appendix 1). For any system undergoing exponential decay, the concentration of the analyte (in our case, the drug molecule) varies with time according to a simple equation:

where [C]t is the concentration of drug (analyte) at time t, [C]0 is the starting concentration of drug (at time zero, or at Cmax/tmax in the current case of oral PK) and k is the first order rate constant for the decay process. The rate constant is an intrinsic constant that defines the speed or rate at which the decay process occurs. Figure 10.2 illustrates a typical exponential decay process with the data fit to the form of Equation (10.1).
Figure 10.2 Idealized first order decay of drug concentration over time plotted on a (A) linear-linear scale and (B) semi-log scale.
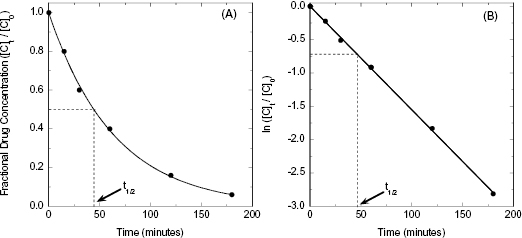
The amount of time required for the concentration of drug to decrease to half of its starting concentration is referred to as the half-life and is represented by the symbol t1/2. The half-life can be calculated directly from the rate constant, k, as follows:

In the era before computer-based nonlinear curve fitting was common, scientists often sought means of linearizing data of the type shown in Figure 10.2A, to make it simple to extract fitting parameters, such as t1/2, using graph paper and a straight edge. In the case of an exponential decay, Equation (10.2) can be linearized by taking the natural logarithm of both sides of the equation:
(10.3) 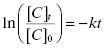
Thus, a plot of ln([C]t/[C]0) as a function of time would be a descending, linear plot with slope of –k. Because of the linear natural of the plot one could also determine the value of t1/2 visually by drawing a horizontal line from the y-axis at the value of ln([C]t/[C]0) = −0.693 (i.e., ln(0.5)) to the data-fit line and then drawing a vertical line from this intersection point to the x-axis. Figure 10.2B illustrates this method of graphing such data.
For both in vivo PK and for many of the in vitro surrogate assays described in this chapter, the data are quantified in terms of the half-life of the processes being measured, with the half-life values calculated from the graphical analysis methods just described. In general the direct fitting of experimental data by nonlinear curve fitting methods is considered the most accurate means of determining values of the rate constant and, from this, the half-life. The linear graphic method is, however, still often used and encountered in the literature.
10.1.2 Caco-2 Cell Permeability as a Surrogate for Intestinal Absorption
Drugs that are administered orally are absorbed from the intestines into the mesenteric vein, from which they travel through the liver and lungs before reaching systemic circulation. To reach circulation, the compound must be absorbed through the enterocytes of the luminal surface of the intestines and traverse several other layers of cellular and extracellular space. Thus, intestinal permeability is a major factor in determining the bioavailability of orally dosed drugs. Ultimately, the rate of compound absorption from the gastrointestinal tract and the overall oral bioavailability are parameters that must be measured in vivo. During the early stages of drug discovery, however, it is common to use the permeability of compounds through Caco-2 cells as a surrogate marker of intestinal permeability.
The Caco-2 cell line is derived from a human colon carcinoma and has the unique feature of spontaneously differentiating into monolayers of polarized cells with morphologic and functional features of intestinal enterocytes. After about 3 weeks in culture, the cells will lay down to form a tight monolayer on various surfaces such that the apical (intestinal lumen) and basolateral (blood) surfaces of all cells are oriented in a common direction (Figure 10.3). If the cell monolayer is deposited on a porous membrane, the monolayer can be used to determine transport of compounds across the monolayer. Figure 10.3 shows a schematic representation of the apparatus used to study Caco-2 cell permeability of compounds. To assess the potential transport of drug from the intestines to the mesenteric vein, compound is added to the chamber above the apical surface of the cell monolayer and permeability is determined by measuring the amount of compound that appears in the basolateral chamber after some time period. Typically, permeability is measured at pH 7.4 and 37°C at time points between 5 and 120 minutes. The apparent permeability (Papp) can then be calculated as follows:
(10.4) 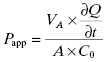
where VA is the volume of the drug-accepting compartment (the compartment into which compound is being transported; typical volumes are 1.5 to 2.6 mL = cm3); dQ/dt is the rate of transport, which is calculated as the molar concentration of compound appearing in the drug-accepting compartment divided by the amount of time (typical units of dQ/dt are μM/s); A is the area of the monolayer (for a typical 24 mm transwell, the area is 4.71 cm2); and C0 is the molar concentration of compound added to the drug-donating compartment (the compartment from which the compound is transported across the monolayer) at time zero (typical units of C0 are also μM). Working through the various units for each element in this equation we find that the units of permeability here are cm/s:
(10.5) 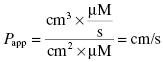
Figure 10.3 (A) Schematic diagram of a transport chamber for measuring drug transport by Caco-2 cells in vitro. (B) Correlation of intestinal absorption in humans and in vitro Caco-2 cell permeabilitiy for 17 compounds spanning a broad range of permeability.
Source: Data replotted from Apredica (www.apredica.com).
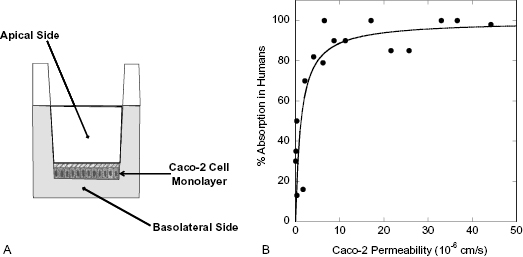
As mentioned above, the directional transport from the intestinal lumen to the blood is modeled by adding compound to the apical (A) chamber (drug-donating compartment) and measuring appearance of compound in the basolateral (B) chamber (drug-accepting compartment), with compound typically quantified by HPLC or by HPLC/MS detection. To understand the mechanism of transport fully, it is necessary to also measure transport in the opposite direction; that is, from basolateral (B) chamber to apical (A) chamber. If the compound is being passively transported, then the measured permeability should be the same in both directions. If, however, the compound is actively transported by transporters in the enterocytes, then the permeability will be greater in the A-to-B direction than in the B-to-A direction. On the other hand, compounds can also be substrates for the brush border membrane efflux pump P-glycoprotein, causing transport of compound back into the intestinal lumen. If significant efflux is occurring for a test compound, then the B-to-A permeability can be greater than the A-to-B permeability.
The predictive value of the Caco-2 assay has been called into question by many researchers. In several cases the rank order of permeability for compounds tested in the Caco-2 assay has not provided a quantitative prediction of oral absorption in vivo. Other researchers have found significant predictive value in this assay (Usansky and Sinko, 2005). Usansky and Sinko (2005), for example, used a test set of 51 structurally diverse compounds and found a significant correlation between Caco-2 permeability and human oral absorption kinetics. Likewise, Apredica (www.apredica.com) has measured the Caco-2 permeability for a test set of 31 compounds of known oral bioavailability ranging from ca. 5% to 100%. They report a non-linear relationship between Caco-2 permeability and bioavailability, such that compounds with Caco-2 permeability >10 cm/s generally translate into >60% bioavailability. Despite its shortfalls, the Caco-2 permeability assay is very widely used as a predictive measure of compound permeability in early drug discovery.
10.1.3 Whole Blood or Plasma Stability
Blood is a complex mixture of red (erythrocytes) and white (leukocytes) blood cells, platelets, small molecule metabolites, and, largely within the plasma fraction, a collection of extracellular proteins. Among the proteins of blood are a number of enzymes that catalyze the hydrolysis of various chemical bonds. Hence, all pharmaceutical agents—whether small organic molecules, peptides and proteins, or nucleic acids—are potentially susceptible to enzymatic breakdown upon reaching systemic circulation. Obviously, this enzymatic breakdown of the compound in blood reduces the lifetime of active drug in circulation, hence reducing the available concentration of drug for distribution to the tissues for subsequent pharmacology.
Hydrolysis of compounds by blood-borne enzymes is one of multiple mechanisms that contribute to the overall clearance of compounds from circulation. To assess the potential for this metabolic liability, one can simply collect whole blood from healthy volunteers, add a known concentration of test compound to a known volume of blood, and incubate for varying amounts of time at 37°C. Alternatively, some researchers use plasma instead of whole blood for this testing, as the plasma fraction is often easier to store and contains the bulk of the hydrolytic enzymes of blood. Regardless of whether whole blood or plasma is used, the experimental details are the same. Compound is added at time zero and samples are withdrawn at specific time points thereafter; typical time points would be 0, 15, 30, 60, 120, and 180 minutes. The proteins within the withdrawn sample are precipitated by addition of a protein denaturant, such as methanol or acetonitrile, and the parent compound and any hydrolysis products contained within the supernatant are quantified by a convenient analytical method. Today, the most common method used for analysis of these samples is LC/MS/MS. During drug discovery one typically quantifies only the amount of parent compound remaining at these different time points, rather than attempting to identify the hydrolysis products. The concentration of parent drug is then plotted as a function of time, as in Figure 10.2, and the half-life is thus determined. The half-lives of different compounds within or among pharmacophore series can thus be compared on a quantitative basis. In an effort to save time and resources, some groups choose to perform initial evaluation of blood stability at a single time point (e.g., 60 or 120 minutes) and rank compounds by the percentage of parent remaining at that time. Half-lives are subsequently determined only for compounds of further interest.
Owing to the nature of the hydrolytic enzymes found in blood, certain chemical functionalities are particularly susceptible to degradation. Some particularly problematic functionalities include amide bonds, sulfonamides, esters, carbamates, lactones, and lactames. Compounds containing these functionalities may suffer from rapid clearance in blood due to enzymatic degradation. However, compounds of all chemical structures must be tested experimentally to determine their blood or plasma half-lives, as blood-borne enzymes can act on sites within an organic molecule that might not be readily predicted from the known substrate specificities of these enzymes. Like all enzymes, the hydrolytic enzymes of blood tend to bind substrates with enantiomeric specificity; hence drug molecules containing chiral centers often display widely different blood stability for the R and S enantiomers. Therefore, in early assessment one may wish to test both enantiomers of a chiral compound, depending, of course, on the enantiomeric tolerance of the primary target.
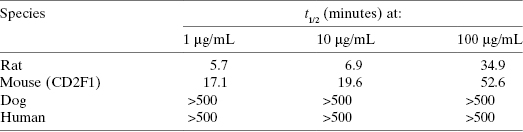
It is commonly found that the half-life of a compound in blood will vary considerably among different species. Often, for example, compounds show much lower stability in rat and mouse blood than in human blood. Figure 10.4 illustrates this for the antifungal compound fluconazole. The half-life of fluconazole is only 4.0 and 4.8 hours in rats and mice, respectively, but jumps to 14 hours in dogs and to 22 hours in humans (Humphrey et al., 1985). Although the ultimate aim of any drug discovery effort is to obtain sustained efficacy in humans, preclinical modeling of compound efficacy and safety is always done in nonhuman mammals. For example, in most cancer drug discovery efforts efficacy is assessed in mouse models (e.g., xenograft models) and safety is most often assessed in rat and dog models. Hence, it is important to assess compound stability in blood or plasma from all of these test species in addition to humans. To illustrate further the significant differences in blood stability among species, consider the data published by Wang et al. (2005) on the preclinical pharmacology of epothilone D (EpoD), a chemotherapeutic agent that functions as a tubulin stabilizer. These researchers measured the plasma stability of EpoD in vitro over an 8-hour time period at three different starting concentrations of compound: 1, 10, and 100 μg/mL in several rodent species as well as dog and human plasma. The data of Wang et al. for CD2F1 mouse, rat, dog, and human plasma are summarized in Table 10.1. We see that the half-life of the compound increased with starting concentration in the rodent species, but more striking is the vast differences in half-life at each concentration among species. The kinetics of degradation are such that in mice and rats no detectable compound would be left in plasma after 8 hours. In contrast, >99% of the starting concentration of EpoD would remain in dog and human plasma after 8 hours. Results like this can have significant impact on the course of in vivo studies during lead optimization and beyond.
Figure 10.4 Stability of fluconazole in whole blood from different animal species: mouse (closed squares), rat (open squares), dog (open circles), and human (closed circles).
Source: Data replotted from Humphrey et al., 1985.
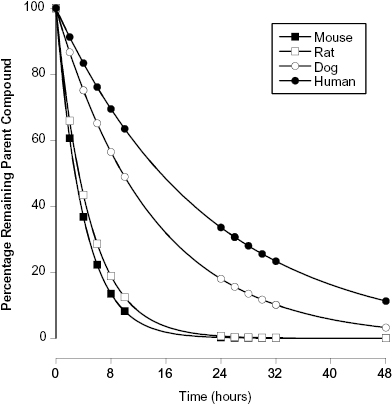
TABLE 10.1 In vitro Stability of EpoD in Plasma from Different Species. (Measurements Reported Here Were Performed at 37°C)
Source: Data taken from Wang et al. (2005).
10.1.4 Plasma Protein Binding
Once a compound enters the blood stream, it can partition between remaining free in solution or binding to proteins that are present in blood plasma at relatively high concentrations. Binding of drug to plasma proteins can stabilize the drug against metabolism by blood-borne enzymes and in this way extend the half-life of the compound in circulation. However, for a drug to be efficacious it must distribute from systemic circulation into the tissues of the body to reach its molecular target. It is generally held that only the fraction of drug that is not bound to plasma proteins (i.e., the free fraction or unbound fraction) is available for distribution to tissues; this concept is referred to as the “free drug principle” (Trainor, 2007). Hence, significant plasma protein binding diminishes the effective concentration of drug available for pharmacology at a given overall dose. For this reason, lead compounds should not exhibit very high plasma protein binding (typically ≤98%). While this characteristic can be ameliorated through medicinal chemistry during lead optimization, it is best to start these efforts with lead compounds that do not present an overwhelming challenge in this regard. Table 10.2 provides some examples of marketed drugs that span a wide range of plasma protein binding. Within this list are very highly bound drugs, such as Warfarin and Vinblastine, and also drugs with almost no propensity for plasma protein binding, such as Atenolol. These extreme examples notwithstanding, one generally finds that drugs used in human medicine fall in the range of ca. 80–98% bound.
TABLE 10.2 Some Examples of the Percentage of Plasma Protein Binding for Marketed Drugs Used in Human Medicine
| Drug | % Bound to Human Plasma Proteins |
|---|---|
| Warfarin | ≥99 |
| Vinblastine | 99 |
| Taxol | 95–98 |
| Buspirone | 95 |
| Paclitaxol | 88–98 |
| Verapamil | 88–92 |
| Propanolol | 80–92 |
| Doxorubicin | 76 |
| Amoxicillin | 18 |
| Acyclovir | 15 |
| Atenolol | <5 |
Among the myriad of proteins present in human plasma, two are the most common binders of drug molecules: human serum albumin (HSA) and alpha-1 acid glycoprotein (AAG; also known as orosomucoid). HSA is the most abundant protein in blood. In healthy adult humans the concentration of HSA in serum ranges from 530 to 758 μM, with a median value of 644 μM; this translates into whole blood concentrations of between 291 and 417 μM. AAG concentrations vary considerably among healthy adult humans, depending on gender, diurnal circadian rhythms, menstrual cycle in women, and other factors. The literature reports a range of 0.4 to 1.2 mg/mL in serum from healthy volunteers, translating to a whole blood concentration of 7–30 μM (Parish and Spivey, 1991; Colombo et al., 2006). Hence, both HSA and AAG are present in systemic circulation at much higher concentrations than the typical picomolar to nanomolar concentrations of target proteins within cells. The concentrations of HSA and AAG in whole blood also exceed the typical maximum concentration of drug (Cmax) achieved through oral or IV dosing. Because of these high concentrations, and the nature of the equilibrium between proteins and ligands (see Copeland, 2000; Chapter 7; and Appendix 2), even compounds of relatively low affinity for HSA and/or AAG can partition significantly into the protein-bound state.
To illustrate this concept, let us consider the following example. Let us say that a drug is dosed such that the serum concentration of drug is 1 μM. Let us further say that the Kd for binding of this drug to human serum albumin (HSA) is 10 μM and that the concentration of HSA in serum is 644 μM. One might at first consider that the fraction of drug-bound HSA would be rather small, as the drug is present in serum at a concentration well below the Kd value. However, it is not the concentration of drug-bound protein that is important in this case, but rather the fraction of drug that is bound by protein. To determine this, we must consider the very high HSA concentration present in serum, which effectively creates a tight-binding situation similar to that presented in Chapter 7. The fraction of drug bound by protein is thus given by the following quadratic equation:
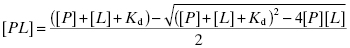
where [PL] is the concentration of drug-protein complex, [P] is the total concentration of plasma protein, [L] is the total concentration of drug and Kd is the equilibrium dissociation constant for the binary PL complex. Plugging our values into Equation (10.6) we obtain a value of [PL] of 0.985 μM. In other words, the fraction of drug bound by HSA in this illustrative example is 0.985 or 98.5%. Thus, despite dosing to achieve a total plasma concentration of 1 μM, the actual free drug concentration is only 0.015 μM.
A wide range of small, organic molecules bind to HSA and/or AAG, and attempts to develop a general understanding of recognition determinants for binding through SAR have been frustratingly disappointing. Thus, while some researchers continue to measure binding of compounds to the individual, isolated proteins, most drug discovery researchers take a more empirical approach of measuring compound binding in whole plasma or in a dilution of whole plasma, so that all potential binding proteins are present. The disadvantage of this empirical approach is that resolution of a plasma protein binding issue for a chemical series will be likewise empirical, as any SAR that emerges will not inform on specific binding interactions with specific proteins. Nevertheless, the empirical approach has proved pragmatic and effective for hit-to-lead and lead optimization efforts.
An array of biochemical and biophysical methods have been applied to the study of drug binding to plasma proteins (Cohen, 2004). Of these, equilibrium dialysis, ultrafiltration, and analytical ultracentrifugation are the most commonly used methods. For all three methods, a known concentration of drug is added to a sample of plasma. The sample is then incubated until equilibrium is established and then the free and protein-bound populations of compound are separated by some mechanism. The concentration of drug in the free fraction, the bound fraction, or both is then measured by an appropriately sensitive analytical method (e.g., liquid chromatography with mass spectral detection). Knowing the total concentration of compound at the start of the experiment—and adjusting for any losses to vessel surfaces and the like—one can then calculate the percentage of compound that is bound to plasma proteins.
The methods that are most commonly applied to assessment of plasma protein binding (vide supra) are well established, provide accurate determinations of the equilibrium distribution of bound and free compounds, and are well recognized by regulatory agencies such as the U.S. Food and Drug Administration. Hence, as compounds progress toward candidate selection and ultimately into the clinic, assessment of plasma protein binding by one or more of these well established methods will be necessary. These methods, however, are generally not amenable to high throughput assessment of large numbers of compounds, as may be required during early hit and lead evaluation. They also require specialized equipment and are generally performed by specialists within drug metabolism departments.
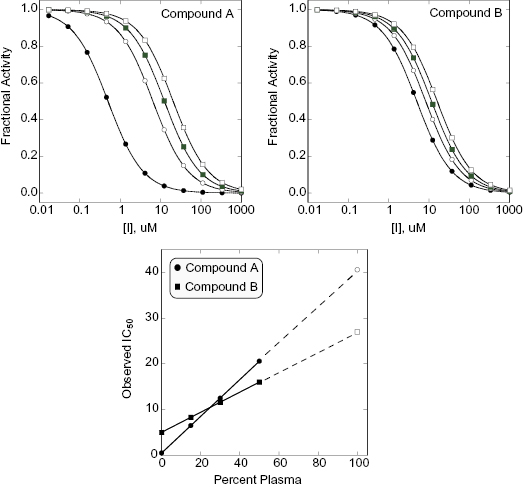
An alternative method for assessing plasma protein binding in early phase drug discovery is by the impact of added plasma, or plasma proteins, on the apparent potency of compounds in biochemical or cellular assays. Rusnak et al. (2004) have shown that when a compound is bound by plasma proteins, the addition of plasma or plasma proteins will cause a shift in the apparent IC50 of the compound in cellular or cell-free biochemical assays. The extent of the shift in IC50 value is linearly dependent on the amount of plasma protein added to the assay (Copeland, 2000b; Rusnak, 2004), and the slope of the linear IC50 versus plasma protein concentration plot is directly proportional to the fraction of compound bound to plasma proteins (Figure 10.5). Thus, a compound that is highly bound by plasma proteins will display a large shift in IC50 when plasma is added to a cellular or biochemical assay, while a compound that is less highly bound to plasma proteins will display a more modest shift in apparent potency. As an example, consider the data illustrated in Figure 10.5. Compound A has an IC50 of 0.5 μM in an assay of target activity, while compound B is an order of magnitude less potent, displaying an IC50 of 5.0 μM in the same assay. The apparent potency of both compounds is determined by measuring the IC50 in the same assay with 15, 30, and 50% plasma added to the cell medium. We note that while compound A is more potent in the absence of added plasma, it displays a significant shift in IC50 with increasing plasma. In contrast, the less potent compound B displays a much more modest shift in IC50 upon plasma addition. These data indicate that compound B is less bound by plasma proteins. As a result, a replot of IC50 as a function of plasma concentration indicates that when the data are extrapolated to 100% plasma, compound B would actually be a better inhibitor than compound A because of the difference in plasma protein binding. This example illustrates the importance of proper consideration of multiple factors beyond target potency—including plasma protein binding—during hit-to-lead and lead optimization activities.
Figure 10.5 Hypothetical example of the use of the IC50 shift method for evaluating plasma protein binding by compounds. In this example, compound A is a more potent inhibitor of its target enzyme than is compound B when both are assessed in the absence of added plasma proteins. However, compound A also demonstrates a great shift in IC50 when plasma proteins are added to the enzyme assay. As illustrated in the lower panel, a replot of observed IC50 as a function of percent plasma is linear for both compounds and suggests that at 100% plasma Compound B would actually be a more effective inhibitor of target activity.
To utilize the IC50 shift method one must first determine the tolerance of the assay system for added plasma. Typically, one will find that biochemical and cellular assays will continue to work well over some specific range of plasma (or plasma protein) concentrations. Having established a workable range of plasma addition, one could then determine the IC50 value of a compound at zero plasma and at two or three other plasma concentrations within the workable range, as described above for the example illustrated in Figure 10.5. Because assays for hit-to-lead and lead optimization will already be formatted for 96- or 384-well plate methods, the throughput of determining IC50 values at several plasma concentrations would still allow large numbers of compounds to be assessed. Also, because the relationship between apparent IC50 and added plasma is linear, one can extrapolate the empirical data to calculate the apparent IC50 that would be realized in 100% plasma (vide supra). Hence, the shift in IC50 at a given plasma concentration, the slope of the IC50 versus plasma concentration line, or the extrapolated IC50 at 100% plasma could each be used as a relative metric for ranking compounds with respect to plasma protein binding. In this manner, the SAR for plasma protein binding can be established with large numbers of compounds early in a hit-to-lead and lead optimization campaign.
10.1.5 Metabolism of Xenobiotics in the Liver
When a foreign substance (i.e., a xenobiotic) is ingested or otherwise enters the bloodstream, it is either utilized as a nutrient or must somehow be eliminated from the body. Xenobiotic metabolism evolved largely as a mechanism by which to detoxify potentially harmful substances that may be swallowed, inhaled, or otherwise brought into the body. Hence, metabolism is a positive defense mechanism that nature provides us. In the context of drug discovery, however, these same processes can be problematic, as the body treats drug molecules as xenobiotics and thus attempts to eliminate them via metabolic pathways that biotransform drugs in specific ways. The general goal of biotranformation is to increase the water solubility of lipophilic xenobiotics so that they can be more readily excreted in bile (leading to elimination in feces) or urine.
Understanding compound metabolism is critical to drug discovery and development for several reasons. First, metabolism is a key driver of drug elimination from the body and therefore defines in large part the lifetime of the parent drug in circulation (i.e., pharmacokinetics). In some cases biotransformation by metabolic enzymes can transform a safe compound into a toxic metabolite, thus impacting significantly the utility of a specific drug. Finally, compounds can act as substrates or inhibitors of specific metabolic enzymes that are also involved in the biotransformation of other drugs. In such cases, the occupancy of one drug at a metabolic enzyme can diminish the transformation, by that enzyme, of a second drug, leading to slower metabolism and potentially unexpected accumulation of the second drug to unsafe levels. This scenario is referred to as drug–drug interactions, or more generally as metabolic interactions. Overall, it is estimated that 20–30% of all adverse reactions seen with drug therapies are due to drug–drug interactions (Scripture and Figg, 2006).
A good illustration of metabolic interaction comes from the class III anti-arrythmic drug dofetilide (Tikosyn™). This drug works well to control cardiac arrhythmia but at high doses it blocks a cardiac potassium channel known as hERG (vide infra), leading to a potentially lethal arrhythmia known as torsade de pointes (TdP). There is a linear relationship between dofetilide plasma concentration and the extent of hERG blockage. Dofetilide is metabolized, in part, by a specific isoform of the cytochrome P450 family of monooxygenases (CYP3A4; vide infra). Verapamil is a commonly prescribed calcium channel blocker that is used to treat hypertension and angina. Verapamil is also an inhibitor of the CYP3A4 enzyme that metabolizes dofetilide. Hence, co-administration of verapamil with dofetilide can lead to a 42% increase in the peak plasma concentration of dofetilide, thus elevating significantly the potential for torsade de pointes in patients. For this reason the use of dofetilide is contraindicated for patients using verapamil. Other examples of clinically significant drug–drug interactions are summarized in Table 10.3.
TABLE 10.3 Examples of Clinically Significant Drug–Drug Interactions among Marketed Drugs
Source: Data from Kenny et al. (2008).
It is worth noting that metabolic interactions are not limited to interactions between multiple drugs. Sometimes other aspects of the patient’s history and lifestyle can also affect drug metabolism. For example, patients who drink grapefruit juice can show slowed metabolism, hence accumulation of certain drugs. The reason for this is that grapefruit juice contains a class of compounds known as furocoumarins, most notably 6′,7′-dihydrobergamottin, that are potent inhibitors of a number of cytochrome P450 isoforms (CYP450s), especially the CYP3A subfamily of enzymes. Similarly, tobacco use, alcohol use, patient age, gender, ethnic origin, and disease state can affect the distribution and levels of metabolic enzymes like the CYP450s. Thus, different patients will metabolize drugs at different rates and may show different patterns of metabolic interactions; this must be taken into account in defining dosing amounts and schedules during clinical use.
The vast majority of biotransformation reactions are mediated by intracellular enzymes within the liver (i.e., within hepatocytes). The reactions catalyzed by these enzymes are broadly divided into two major types: phase I and phase II reactions (Table 10.4). Phase I reactions increase the aqueous solubility of compounds by performing oxidation, reduction, and hydrolytic transformations, commonly adding or exposing polar functionalities to the parent molecule such as amines (-NH2), alcohols (-OH), sulfhydrals (-SH), and carboxylates (-COOH). Enzymes that catalyze these reactions include CYP450 monooxygenases, flavin-containing monooxygenases, esterases, alcohol dehydrogenases, aldehyde dehydrogenases, and monoamine oxidases. Phase II reactions involve conjugation of hydrophilic, endogenous species to specific functional groups that exist on the parent molecule, or have been added or exposed via phase I transformation. Examples of phase II conjugation reactions include: addition of glucuronic acid to hydroxyl or carboxylate groups (glucuronidation); amino acid conjugation at carboxylate groups; sulfation, acetylation, or methylation at hydroxyl or amine groups; and glutathione conjugation at sulfhydrals and other functionalities. Enzymes that catalyze phase II reactions include glucuronosyltransferases, sulfotransferases, N-acetyltransferases, methyltransferases, glutathione S-transferases, and acyl-CoA N-acyltransferases.
TABLE 10.4 Some Common Enzyme-Catalyzed Drug Biotransformation Reactions
| Metabolic Phase | Reaction Type | Reaction |
|---|---|---|
| I | Oxidation | Aromatic hydroxylation |
| I | Oxidation | Aliphatic hydroxylation |
| I | Oxidation | N-Hydroxylation |
| I | Oxidation | N-, O-, S-Dealkylation |
| I | Oxidation | Deamination |
| I | Oxidation | Sulfoxidation |
| I | Oxidation | N-Oxidation |
| I | Oxidation | Dehalogenation |
| I | Reduction | Azoreduction |
| I | Reduction | Nitroreduction |
| I | Reduction | Alcohol dehydrogenation |
| I | Hydrolytic | Ester hydrolysis |
| I | Hydrolytic | Amide hydrolysis |
| I | Hydrolytic | Peptide hydrolysis |
| II | Conjugation | Glucuronidation |
| II | Conjugation | Sulfation |
| II | Conjugation | Acetylation |
| II | Conjugation | Methylation |
| II | Conjugation | Amino acid conjugation |
| II | Conjugation | Peptide conjugation |
| II | Conjugation | Glutathione conjugation |
The enzymes that catalyze both phase I and phase II reactions within hepatocytes are largely found either as soluble proteins in the cell cytosol, or as membrane-associated proteins in the membranes of mitochondria and especially the endoplasmic reticulum (ER). For example, the CYP450s and several phase II reaction-mediating enzymes are membrane-bound enzymes that are found in the ER membrane of cells, while the majority of the glutathione S-transferase activity of hepatocytes is found in the cytosol. Intact hepatocytes can be isolated from liver samples of various species and these can be used for in vitro assessment of compound metabolic stability. If hepatocytes or liver samples are disrupted by homogenation, sonication, or other means, the membranes of the endoplasmic reticulum are broken but reseal themselves in the form of small, vesicular species referred to as microsomes. The microsomes can be isolated from cell debris and other organelles by differential centrifugation. Once isolated, microsomes are a rich source of many of the enzymes involved in hepatic drug metabolism. Hence microsomes can also be used for assessment of compound metabolic stability. Isolated microsomes are very stable and can be stored frozen for long periods of time (Pearce et al., 1996), making them particularly convenient for in vitro studies. However, as described above, microsomes do not contain the full complement of drug metabolizing enzymes that exist in hepatocytes.
10.1.6 Hepatocyte, S9, and Microsome Stability
Hepatocytes, hepatic S9 fraction, and liver microsomes are all used to assess the metabolic stability of compounds in early drug discovery. Hepatocytes are isolated from livers (human or other organisms’) by gentle treatments that include mild collagenase-mediated tissue disruption and differential centrifugation. The S9 fraction is a subcellular fraction of hepatocytes that contains both microsomes and cytosolic enzymes involved in drug metabolism. The S9 fraction is prepared by homogenizing minced liver samples in Tris-HCl and subjecting the homogenate to low speed centrifugation at 9,000 × g for 30 minutes. This treatment pellets cellular debris and intact organelles. The supernatant is designated the S9 fraction and can be used immediately for assay or stored at −70°C. Microsomes can be isolated from the S9 fraction by further, high speed centrifugation. The S9 fraction is centrifuged at 105,000 × g for 60 minutes to pellet the microsomes. The protocols for use of S9 fractions and microsomes are essentially identical. Both S9 fractions and microsomes from human and other common, preclinical in vivo testing species (i.e., rat, mouse, and dog) are commercially available today from several sources. Since microsomes are more commonly used in preclinical compound evaluation, we shall focus on these for the remainder of this section. All of the statements that follow regarding compound testing with microsomes apply equally to use of S9 fractions, except where noted.
Microsomes contain most of the membrane-associated drug metabolizing enzymes, most notably the CYP450s. However, because these are subcellular particles, not all of the necessary cofactors for enzyme activity are present in isolated microsomes. In particular, the CYP450 enzymes require the soluble cofactor NADPH as an electron source for activity. Hence, microsomes for use in assessing compound metabolic stability must be supplemented with NADPH or with an NADPH regenerating system consisting of the enzyme glucose-6-phosphate dehydrogenase, NADP, glucose-6-phosphate, and magnesium chloride (Ackley et al., 2004). Microsomes are relatively easy to work with, in that they are readily adapted to higher throughput assay formats and are stable to long-term storage. Hepatocytes, however, have the advantage of containing all of the enzymes of hepatic drug metabolism. Cryopreserved hepatocytes are now available from commercial sources and can be stored frozen for a reasonably long time.
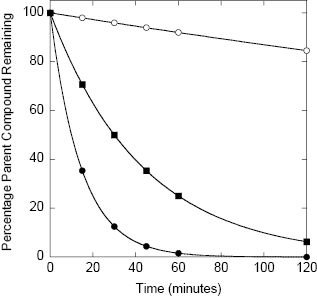
Detailed assay protocols for determining compound metabolic stability using in vitro microsomes, S9 fractions, and hepatocyte systems have been published elsewhere (Ackley et al., 2004; Wu and McKown, 2004). With any of these systems, the compound of interest is incubated at 37°C with the test system (i.e., microsomes, S9 fraction, or suspended hepatocytes) for various lengths of time, typically 0, 15, 30, 45, 60, and 120 minutes. Reactions are quenched by addition of methanol, acetonitrile, trichloroacetic acid, or a similar denaturant to stop enzymatic reactions, and the microsomes or hepatocytes are separated from the supernatant by centrifugation or filtration methods. Samples of the supernatant are analyzed by a convenient detection method; today most compounds are detected by LC/MS methods. The concentration of parent compound is thus determined as a function of time and converted to a percentage of parent remaining. The percentage parent remaining will diminish over time as a result of multiple metabolic processes taking place within the microsomal or hepatocyte system. Nevertheless, the data can generally be modeled as a monophasic exponential decay. Analysis of the data in this way allows the metabolic stability of the compound to be quantified as a half-life. Figure 10.6 illustrates the expected stability in an in vitro microsome, S9, or hepatocyte assay for compounds of high, moderate and low metabolic stability. Fitting of these simulated data yield half-life values of 480, 30, and 10 minutes, respectively. A typical cutoff value of in vitro metabolic stability for a lead compound would be t1/2 >15 minutes. One would then seek to improve this stability via medicinal chemistry during the lead optimization phase.
Figure 10.6 Idealized data for hepatic microsome stability of three compounds representing high (open circles), moderate (closed squares), and low (closed circles) stability in the assay system; the data for each compound can be fit to a simple first-order decay equation (e.g., using Equations (10.1) and (10.2)) from which half-lives of 480, 30, and 10 minutes are determined, respectively.
The assessment of stability presented above is appropriate for preliminary comparisions among large numbers of compounds within a pharmacophore series, as might be desirable during early hit-to-lead efforts. However, as with any enzyme-catalyzed reaction, the rate of parent compound metabolism will depend on the starting concentration of compound used in the assay, according to the Michaelis-Menten equation (Chapter 2). Hence, complete assessment of metabolic stability requires one to measure the rate of metabolism at multiple compound concentrations to determine the kinetic parameters kcat, KM, and kcat/KM; this approach is discussed further in the next section.
10.1.7 CYP450 Mediated Metabolism
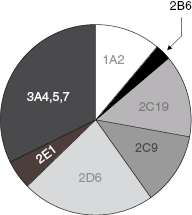
While a variety of enzymes contribute to hepatic clearance, the CYP450 family of enzymes plays a major role in the hepatic metabolism of most drugs (vide infra). The metabolism of almost every drug includes reaction by a member of the cytochrome P450 class of monooxygenases. These enzymes catalyze oxidation reactions via an active site heme iron atom that is coordinated to the protein via an iron-sulfur bond to a cysteine residue (Figure 10.7; Yano et al., 2004). The enzyme class derives its name from a unique spectroscopic feature of the heme group during catalytic turnover, resulting in a strong absorbance maximum at 450 nm. There are 57 genes within humans that encode CYP450 family members. These are divided into 18 families (Table 10.5), based on the substrate molecules that they act upon. As can be realized from Table 10.5, the CYP450 family plays key roles in xenobiotic detoxification as well as other important biosynthetic and metabolic roles in human biology. In terms of drug metabolism, members of the 3A and 2C and 2D families are particularly relevant because of their propensities for oxidizing drug-like molecules; Figure 10.8 illustrates the relative contributions of different CYP450 isozymes to drug metabolism in humans.
Figure 10.7 Active site structure of human cytochrome P450 isozyme 3A4 illustrating the heme iron-cysteine coordinate bond that is critical for enzymatic activity.
This figure was kindly provided by Dr. Lei Jin from coordinates published by Yano et al. (2004: PDB accession number 1TQN).
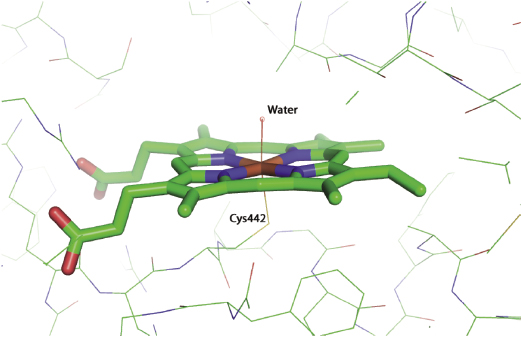
TABLE 10.5 The CYP450 Families Found in Humans
Source: Data adapted from Wikipedia.org.
| Family | Known Function | Isozymes |
|---|---|---|
| CYP1 | Drug and steroid (especially estrogen) metabolism | CYP1A1, CYP1A2, CYP1B1 |
| CYP2 | Drug and steroid metabolism | CYP2A6, CYP2A7, CYP2A13, CYP2B6, CYP2C8, CYP2C9, CYP2C18, CYP2C19, CYP2D6, CYP2E1, CYP2F1, CYP2J2, CYP2R1, CYP2S1, CYP2U1, CYP2W1 |
| CYP3 | Drug and steroid (including testosterone) metabolism | CYP3A4, CYP3A5, CYP3A7, CYP3A43 |
| CYP4 | Arachidonic acid or fatty acid metabolism | CYP4A11, CYP4A22, CYP4B1, CYP4F2, CYP4F3, CYP4F8, CYP4F11, CYP4F12, CYP4F22, CYP4V2, CYP4X1, CYP4Z1 |
| CYP5 | Thromboxane A2 synthase | CYP5A1 |
| CYP7 | Bile acid biosynthesis 7-alpha hydroxylase of steroid nucleus | CYP7A1, CYP7B1 |
| CYP8 | Varied | CYP8A1 (prostacyclin synthase), CYP8B1 (bile acid biosynthesis) |
| CYP11 | Steroid biosynthesis | CYP11A1, CYP11B1, CYP11B2 |
| CYP17 | Steroid biosynthesis, 17-alpha hydroxylase | CYP17A1 |
| CYP19 | Steroid biosynthesis: aromatase synthesizes estrogen | CYP19A1 |
| CYP20 | Unknown function | CYP20A1 |
| CYP21 | Steroid biosynthesis | CYP21A2 |
| CYP24 | Vitamin D degradation | CYP24A1 |
| CYP26 | Retinoic acid hydroxylase | CYP26A1, CYP26B1, CYP26C1 |
| CYP27 | Varied | CYP27A1 (bile acid biosynthesis), CYP27B1 (vitamin D3 1-alpha hydroxylase, activates vitamin D3), CYP27C1 (unknown function) |
| CYP39 | 7-alpha hydroxylation of 24-hydroxycholesterol | CYP39A1 |
| CYP46 | Cholesterol 24-hydroxylase | CYP46A1 |
| CYP51 | Cholesterol biosynthesis | CYP51A1 (lanosterol 14-alpha demethylase) |
Figure 10.8 Pie chart of the relative contributions of CYP450 isozymes to drug metabolism in humans.
Source: Data from the Food and Drug Administration Center for Drug Evaluation and Research web site (www.fda.gov.cder).
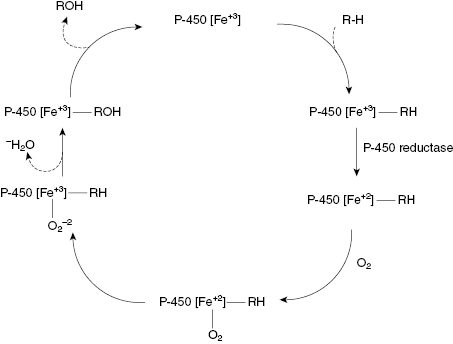
The reaction cycle for a common CYP450 catalyzed reaction, the oxidation of an alkyl group to an alcohol, is illustrated in Figure 10.9. As can be seen from this figure, the heme iron goes through several intermediate states of different coordination and oxidation. Likewise, each step in the reaction cycle results in a unique conformation of the protein surrounding the active site heme. The active sites of these enzymes are designed to be fairly permissive, recognizing a broad spectrum of substrate molecules, including many drug molecules. This is why CYP450-mediated oxidation is one of the most common phase I reactions encountered in drug metabolism.
Figure 10.9 Reaction cycle for oxidation of an alkyl group to an alcohol catalyzed by a CYP450 isozyme.
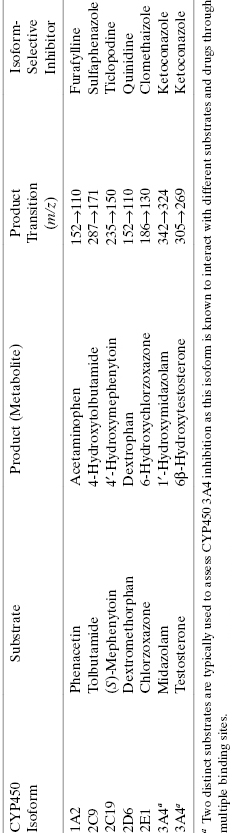
Recombinant versions of various human CYP450 isozymes are today commercially available, making it possible to measure the rate of drug metabolism by individual CYP450s. Drug metabolism by CYP450s generally follows Michaelis-Menten kinetics (Chapter 2) under steady state conditions:

The intrinsic metabolic clearance (defined more completely below), due to a specific enzyme, is defined as the ratio of v0 to the substrate concentration (in the body, the substrate concentration is replaced by the unbound or free concentration of drug as this is the concentration available to the hepatic metabolic enzymes, vide supra):
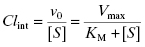
Under typical conditions the free fraction of drug reaching the liver is well below the KM value of the metabolizing enzymes, therefore the [S] term in the denominator of Equations (10.7) and (10.8) can be ignored. Hence, the intrinsic metabolic clearance by a particular enzyme is most commonly defined by the ratio Vmax/KM.
The above treatment would be correct if only a single enzyme were responsible for the hepatic metabolism of a drug. This, however, is rarely the case. Instead, the intrinsic metabolic clearance is the sum of the Vmax/KM values of all enzymes contributing to the hepatic metabolism of the drug:
(10.9) 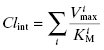
In practice, rather than trying to measure the Vmax/KM value of every enzyme involved in hepatic clearance of a drug, researchers measure the initial velocity of drug disappearance at varying drug concentrations, using hepatocytes, microsomes, or S9 fraction, and use these velocity values to calculate a composite (or total) Vmax/KM value, referred to as (Vmax/KM)T (where the T stands for total).
The in vitro value of intrinsic metabolic clearance can be used to predict the intrinsic metabolic clearance in vivo by correcting the experimentally measured value for the amount of microsomes (or hepatocytes or S9) used in the in vitro assay, the amount of microsomal protein found in a gram of liver, and the weight of liver per kilogram of body mass in an organism:
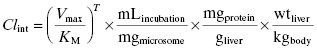
where mLincubation/mgmicrosome is the volume of reaction divided by the mg of microsomal protein used in the in vitro assay, mgprotein/gliver is the mg of microsomal protein per gram of liver, and wtliver/kgbody is the weight of liver (in mg) per kg of body mass for the organism. After canceling terms in Equation (10.10) we find that the units of intrinsic metabolic clearance are volume divided by time and body mass, typically mL ⋅ min−1 ⋅ kg−1. Values of mgprotein/gliver and wtliver/kgbody for humans and for different preclinical model organisms are available in the literature and some of these are summarized in Table 10.6.
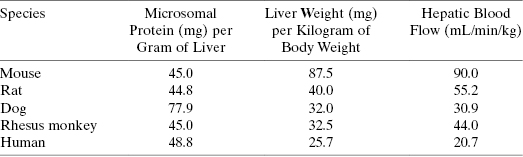
TABLE 10.6 Values of Microsomal Protein per Gram of Liver (mgprotein/gliver), Liver Weight per Kilogram (wtliver/kgbody), and Hepatic Blood Flow Rate (QH) for Humans and Preclinical Animal Models Commonly Used in Drug Discovery
Source: Data from Davies and Morris (1993) and Kwon (2001).
Instead of measuring the velocity of drug disappearance at multiple concentrations to determine (Vmax/KM)T, some researchers instead measure only the pseudo-first order disappearance of drug in microsomes at a single concentration that is expected to be close to the unbound concentration of drug at efficacious doses. In this case, the term (Vmax/KM)T in Equation (10.10) is replaced with the value of the observed rate constant for drug disappearance (vide supra).
The value of Clint calculated from Equation (10.10) can be used to predict the overall hepatic clearance of a drug in vivo (ClH). If one assumes that the liver represents a “well-stirred compartment” in which the concentration of drug throughout the liver is in equilibrium with that in the bloodstream (referred to as the well-stirred model: Pang and Rowland, 1977), then the hepatic clearance depends on the intrinsic metabolic clearance, the rate of blood flow through the liver (QH) and the unbound fraction of drug in systemic circulation (fu) as follows:
(10.11) 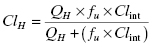
Of course, drug clearance, as described below, occurs both within the liver and in other extrahepatic locations, such as the blood stream, the kidneys, and other organs. Nevertheless, the liver is often the major site of metabolic clearance of drug molecules (vide infra).
10.1.8 Cytochrome P450 Inhibition
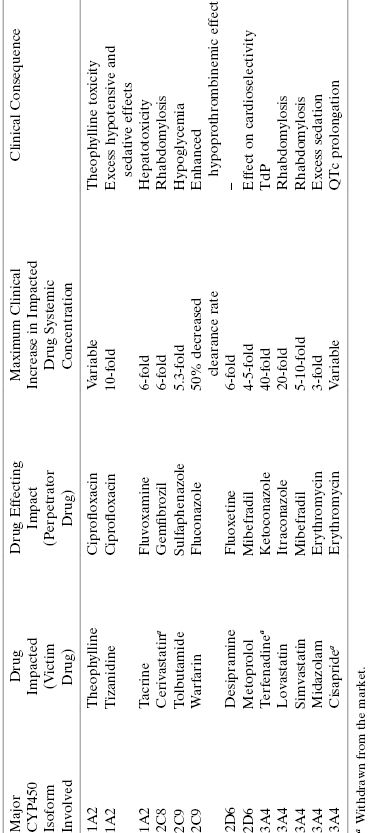
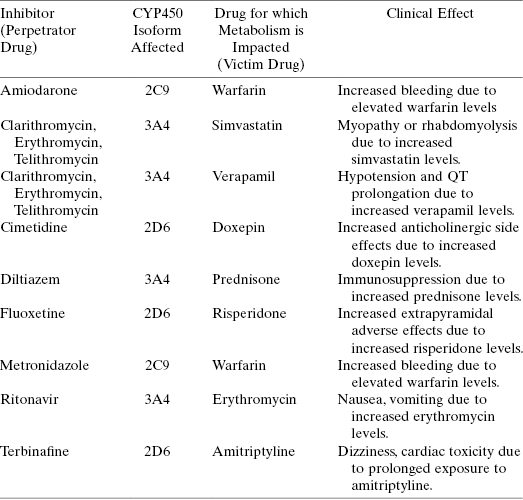
Although most drugs are acted upon by CYP450s as substrates, some drug molecules themselves and/or some reaction products of drug oxidation by CYP450s can also act as inhibitors of these enzymes. Inhibition of a CYP450 by a drug or a metabolite of a drug molecule can result in serious drug–drug interactions, as discussed earlier in this chapter. Table 10.7 provides some additional examples of drug–drug interactions associated with CYP450 inhibition and their potential clinical consequences. It is therefore critical to evaluate the potential for CYP450 inhibition early in a drug seeking campaign, so that any liabilities in this regard can be worked out through medicinal chemistry efforts in the hit-to-lead and lead optimization phases of discovery.
TABLE 10.7 Some Examples of Common Drug–Drug Interactions Due to CYP450 Inhibition
Source: Data adapted from Lynch and Price (2007) and Goshman et al. (1999).
The ability of test compounds to inhibit CYP450 isoforms is typically assessed with in vitro assays of enzyme catalysis, using either purified, recombinant CYP450s or microsomes or S9 fraction as enzyme sources. Today two detection methods are commonly used to follow CYP450 catalysis and inhibition. The first method utilizes fluorogenic substrates (i.e., substrates that yield fluorescent products when acted upon by the enzyme of interest) of specific CYP450 isozymes that can be used with isolated, recombinant enzymes. Table 10.8 lists specific, fluorgenic substrates that are commonly used for different CYP450 isozymes in testing compounds as inhibitors. In the absence of test compound one observes a linear increase in fluorescent product (i.e., metabolite) with time. In the presence of a fixed concentration of inhibitory compound, the slope of the fluorescence versus time plot is reduced by an amount proportional to the extent of inhibition by the compound. Measuring the change in velocity as a function of compound concentration allows one to construct a concentration-response plot and from this to define the IC50 for CYP450 inhibition by the compound (as described in Chapter 5). Simultaneous titration of substrate and inhibitory test compound allows one to define the mode of inhibition for the test compound and to thus determine the Ki value for CYP450 inhibition, in a similar manner to what was described in earlier chapters for general enzyme inhibition studies. Because one is measuring the production of a fluorescent species in these assays, the system is readily adaptable to high-throughput, robotic methods using 96- or 384-well plate formats. Hence, the fluorogenic substrate method can be easily used to screen large numbers of compounds and to perform full concentration-response and mode of inhibition analysis.
TABLE 10.8 Some Examples of Fluorgenic Substrates of CYP450 Isoforms Used for in vitro Study of CYP450 Inhibition by Test Compounds
Source: Data adapted from Stresser, (2004).
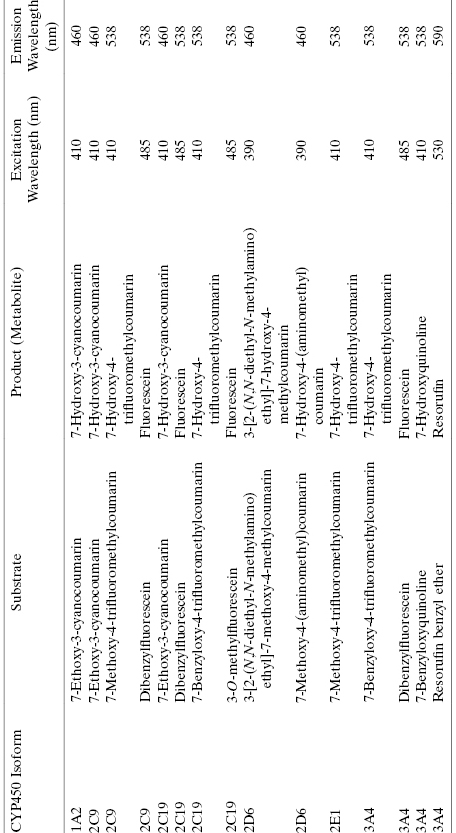
The second common assay method for CYP450 catalysis and inhibition utilizes LC/MS detection of substrate and product concentrations. Table 10.9 presents specific substrates for the common isoforms of CYP450 that are most germane to drug metabolism. Because these substrates are selectively utilized by specific isoforms, they can be used either with purified, recombinant enzymes or with microsomes or S9 fractions. Also listed in Table 10.9 are isoform-selective inhibitors that are commonly used as positive control compounds in assay validation and often are run as controls at the same time as test compounds of interest. A detailed description of the methodology for performing CYP450 assays with LC/MS detection has recently been presented by Yan and Caldwell (2004). Data analysis is typically performed in the same manner as described above for the fluorgenic substrate-based assays. From multiple measurements, at varying concentrations of test compound and substrate, IC50 and Ki values may be derived from this assay format.
TABLE 10.9 CYP450 Isoform-Selective Substrates and Inhibitors That Are Commonly Used in Assays of CYP450 Inhibition Using LC/MS detection
Source: Data adapted from Yan and Caldwell (2004).
The clinical issue that arises from inhibition of a CYP450 isoform is decreased clearance and therefore increased exposure of the patient to other drugs that are metabolized by the same CYP450 isoform. Let us say that compound I is a reversible, competitive inhibitor of a CYP450 that is responsible for the majority of hepatic metabolism of another drug. In the presence of a competitive inhibitor, Equation (10.8) now becomes the following (Wienkers and Heath, 2005):
The ratio of clearance with and without the competitive inhibitor I therefore becomes, after canceling terms, the following:

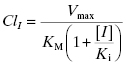
The overall exposure of the patient to drug during a dosing interval is best measured by the area under the plasma concentration versus time curve (AUC; vide infra) and this parameter is likewise affected by the competitive inhibitor:
Thus the exposure of a patient to a drug is increased by the presence of a competitive inhibitor in proportion to the [I]/Ki value, as summarized in Table 10.10. As can be seen from this table, at high enough doses of I, the AUC for the “victim drug” can increase significantly, potentially to concentrations at which adverse side effects may occur (Wienkers and Heath, 2005). Equations (10.12)–(10.14) are simple equations based on the the competition between substrate drug and competitive inhibitor. They do not adequately account for the fact that only a fraction of a particular drug’s metabolism may be mediated by the inhibited CYP450 isoform and also do not account for the fact that only the free fraction of dosed drug (and not that bound to plasma proteins; vide supra) contributes to hepatic inhibition of CYP450 isoform(s). The equations presented here suffice to make the didactic point; more complete equations that account for plasma protein binding and fractional CYP450 isoform metabolism can be found in the literature (see, e.g., Mao et al., 2011).
TABLE 10.10 Relationship between [I]/Ki and Increased Exposure (as Measured by AUC) for a Drug in the Presence of a Competitive Inhibitor of the CYP450 Isoform Responsible for Metabolism of the Drug
(Data Based on Equation (10.14))
| [I]/Ki | AUCi/AUC |
|---|---|
| 0.01 | 1.01 |
| 0.03 | 1.03 |
| 0.10 | 1.10 |
| 0.30 | 1.30 |
| 1.00 | 2.00 |
| 3.00 | 4.00 |
| 10.00 | 11.00 |
| 30.00 | 31.00 |
| 100.00 | 101.00 |
As mentioned earlier in this chapter, drug–drug interactions can be a significant issue for patents; this is especially true for cancer patients, both because of the myriad of other drugs that patients are typically taking and also because many existing cancer drugs display some degree of CYP450 inhibition. Table 10.11 summarizes some examples of current cancer therapeutics that also act as inhibitiors of certain CYP450 isoforms. Given the likelihood that new therapeutic agents entering the clinic will be used in combination with existing therapies, the potential for drug–drug interactions is multiplied if the new therapy also demonstrates CYP450 inhibition. This is why it is paramount that one identifies issues of CYP450 inhibition and begins to address these through medicinal chemistry as early as possible in drug discovery campaigns.
TABLE 10.11 Examples of Anticancer Drugs That Inhibit CYP450 Isoforms
Source: Data adapted from Scripture and Figg (2006).
| Drug | CYP450 Isoform Inhibited | Primary CYP450 Isoform Involved in Metabolism of the Drug |
|---|---|---|
| Anastrazole | 1A2, 2C8, 2C9, 3A4 | 3A4 |
| Corticosteroids (dexamethasone, methylprednisone, prednisone) | 3A4 | 3A4 |
| Cytarabine | 3A4 | 3A4 |
| Gefitinib | 2C19, 2D6 | 3A4 |
| Imatinib-mesylate | 2C9, 2D6, 3A4 | 3A4 |
| Ketoconazole | 3A4, 2C9 | |
| Letrozole | 2A6, 2C19 | 2A6, 3A4 |
| Tamoxifen | 3A4 | 1A2, 2A6, 2B6, 2D6, 2E1, 3A4 |
| Vinblastine | 2D6 | 3A4 |
| Vincristine | 2D6 | 3A4 |
| Vinorelbine | 2D6 | 3A4 |
An issue for drug–drug intereactions that is particularly problematic is time-dependent inhibition (Chapter 6) and mechanism-based inactivation (Chapter 9) of CYP450s. As we have seen in Chapters 6 and 8, time-dependent inhibition refers to situations in which the affinity of an inhibitor for an enzyme increases over time. Often, this is the result of a compound-binding induced conformational change of the enzyme that leads to better molecular interactions between the inhibitor and the binding pocket components, hence much greater affinity relative to the initial encounter complex. Induced conformational changes of this type can lead to changes in affinity from starting points of high micromolar to final affinities in the nanomolar or even picomolar range. The critical issue raised by this phenomenon is that conventional in vitro assays of CYP450 activity can miss potent inhibition by a test compound if sufficient time is not incorporated into the assay for the slow conformational transition to occur (Copeland, 2000; see also Chapters 6 and 8).
A second, common mechanism of time-dependent inhibition of CYP450s occurs when the test compound is not itself an inhibitor but rather a substrate of a CYP450 isoform. In some cases the product of the CYP450 reaction is a potent, reversible inhibitor of that CYP450 isoform or of some other CYP450 isofrom. In the former case, time-dependent inhibition of the purified, recombinant CYP450 would be observed and would occur only after significant reaction turnover. In the latter case, inhibition would only be realized in assays using microsomes or other hepatocyte fractions that contain the full complement of CYP450 isozymes.
Mechanism-based inactivation of an enzyme refers to a situation in which the compound being tested is a substrate of the enzyme and the product of enzymatic action on that substrate is a covalent modifier (i.e., an irreversible inhibitor) of the enzyme (Chapter 9). In this case the irreversible inactivator is produced in situ as a result of the enzymatic reaction on the test compound. Mechanism-based inactivation of a CYP450 is a particularly dangerous situation because it results in permanent inactivation of the CYP450 enzyme, hence permanent inactivation of all metabolic processes performed by that isozyme; recovery of CYP450 activity is then limited by the rate of new enzyme biosynthesis by the organism. This can have disastrous and difficult-to-predict consequences for patient safety, as the impact of CYP450 inactivation can extend well beyond the pharmacokinetic lifetime of the drug in the patient.
To test for the occurrence of time-dependent inhibition or mechanism-based inactivation, one can modify the standard CY450 assay format to include a preincubation of the compound with the enzyme and with the redox cofactor NADPH prior to initiation of reaction by addition of substrate. If time-dependent inhibition or mechanism-based inactivation occurs, one should observe an apparent increase in inhibition with preincubation compared to that seen without preincubation. Proper analysis of these forms of inhibition/inactivation require one to vary the compound concentration, the preincubation period, and the enzyme substrate. Details of the correct analysis of both time-dependent inhibition and mechanism-based inactivation of enzymes can be found in Chapters 6, 8, and 9; specific guidelines for dealing with these issues in the context of drug–drug interaction studies are detailed in Bjornsson et al. (2003) and Grimm et al. (2009).
As with reversible inhibitors, mechanism-based inactivators of CYP450s can lead to increased patient exposure to other drugs that would otherwise have been metabolized by the inactivated isoform. Using the equations for mechanism-based inactivation that were presented in Chapter 9, we can derive an equation for the increase in AUC expected for a “victim drug” in the presence of a mechanism-based inactivation, accounting for fractional metabolism by the inactivated isoform and plasma protein binding of the inactivator (Wang et al., 2004):
(10.15) 
where fm is the fraction of drug metabolism caused by the affected CYP450 isoform, [I]U is the concentration of unbound drug, kdeg is a rate constant that reflects the natural rate of CYP450 protein degradation (the value of kdeg for CYP450 3A4 has been empirically defined for rat and humans to be 8.25 × 10⁻⁴ and 3.21 × 10⁻⁴ min−1, respectively; Wong et al., 2010), and kinact and KI are defined as in Chapter 9.
Any form of CYP450 inhibition carries some risk of drug–drug interactions. Obviously, the in vitro assays described in this section provide surrogates for measuring true drug–drug interactions in vivo, and not surprisingly, not every compound that displays CYP450 inhibition in vitro will translate into a meaningful drug–drug interaction issue in vivo. There are, for example, many drugs in clinical use today that demonstrate mechanism-based inactivation of CYP450 isoforms in vitro (see Zhou et al., 2004, for a good perspective on this issue). Recent studies suggest that improved predictive power may be attained by using cryopreserved hepatocytes, rather than microsomes, in the presence of plasma proteins to evaluate CYP450 inhibition and mechanism-based inactivation (Chen et al., 2011). Generally, one finds that kinact/KI values for mechanism-based inactivation of CYP450s is ca. 4- to 13-fold lower in hepatocytes than in microsomes, presumably due to the presence of an intact cell membrane and efflux pumps in the former system (Chen et al., 2011; Mao et al., 2011). Additionally, the relative risk of drug–drug interaction in vivo also depends on factors such as drug dose, hepatic clearance, other pharmacological features of the inhibitor and the mechanistic details of inhibition. Simple, rapidly reversible inhibition by the parent drug or by the product of CYP450-mediated inhibition carries the least risk because of the rapidly reversible nature of inhibition in the context of an open system (see Chapter 8) such as the liver. Time dependent inhibition that results in high affinity, long residence time inhibition is more problematic because of the more durable nature of the inhibiton. Finally, mechanism-based inactivation of CYP450s carries the greatest relative risk for drug–drug interactions because of the irreversible nature of the inactivation process, leaving new CYP450 protein synthesis as the only means available to the body for overcoming inactivation. Unfortunately the drug metabolism literature often confuses these different mechanisms of inhibition and, for example, it is common to find the terms time dependent inhibition and mechanism-based inactivation used interchangeably. Such common misconceptions do not adequately distinguish the relative risks of drugs that display some form of CYP450 inhibition. The reader is thus cautioned to be wary of data and conclusions that indiscriminately lump all CYP450 inhibition into the broad category of drug–drug interaction risk.
Ultimately, what defines the risk of drug–drug interaction is the decrease in clearance or increased AUC seen for a victim drug when coadministered with a CYP450 inhibitor of any mechanism. The FDA has categorized the relative risk for drug–drug interaction as strong, moderate, or weak, depending on the level of clearance declination or AUC elevation observed; these categories are summarized in Table 10.12.
TABLE 10.12 FDA Guidelines for Relative Risk of Drug–Drug Interaction Based on Observed Decreases in Clearance or Increases in AUC for Victim Drugs
Source: www.fda.gov/drugs.developmentapprovalprocess/developmentresources/druginteractionslabeling.
| Category of Relative Risk | Observed Changes in Clearance or AUC |
|---|---|
| Strong inhibitor | ≥5-fold increase in AUC or >80% decrease in clearance of victim drug |
| Moderate inhibitor | ≥2 but <5-fold increase in AUC or 50–80% decrease in clearance of victim drug |
| Weak inhibitor | ≥1.25 but <2-fold increase in AUC or 20–50% decrease in clearance of victim drug |
Stay updated, free articles. Join our Telegram channel

Full access? Get Clinical Tree


