CHAPTER 20
Vancomycin
DENISE E. RICCOBONO, PharmD
MARICELLE O. MONTEAGUDO-CHU, PharmD, BCPS
Vancomycin is a glycopeptide antibiotic, approved by the FDA in 1958, which is slowly bactericidal against most gram-positive organisms. It is active against Staphylococci (including penicillin-and oxacillin-resistant strains), Streptococci, Enterococci, and other gram-positive organisms. It exerts its bactericidal effect by complexing with the D-alanyl-D-alanine portion of the peptide precursor units on the outer surface of the cell membrane and interferes with cell wall synthesis.
During the first few decades of clinical use, vancomycin demonstrated consistent activity against gram-positive bacteria and became the drug of choice to treat most methicillin-resistant Staphylococcus aureus (MRSA) infections. However, due to the emergence and increased prevalence of vancomycin-resistant Enterococci (VRE), vancomycin intermediate (VISA) and resistant S. aureus (VRSA), and heterogenous VISA (hVISA), our confidence in vancomycin as a reliable bactericidal agent has decreased, motivating a renewed interest in appropriate utilization and optimal dosing of vancomycin.1-3
DOSING
Due to limited pharmacokinetic studies done when vancomycin was first approved in the late 1950s, it appears that the original intravenous dosing of 1,000 mg every 12 hours or 500 mg every 6 hours was derived arbitrarily. Also, the serum therapeutic ranges accepted for vancomycin of 5–10 mg/L were originally established as guidelines for dosage adjustments in patients with renal failure and was not validated by clinical outcomes. Because vancomycin was thought to be a time-dependent killer and sensitive vancomycin MICs (minimum inhibitory concentration) were ≤4 mg/L, these values were considered acceptable.2,3
It is more recently recommended that weight-based dosing be used to dose vancomycin, especially in more moderate/severe infections, and that dosing intervals be adjusted according to renal function.1 Depending on severity of infection, doses for patients with normal renal function range from 10–15 mg/kg administered intravenously every 8–12 hours. In clinical practice, doses are derived using weight-based dosing via dosing nomograms or by pharmacokinetic calculations. For the purpose of this chapter, we will be discussing vancomycin pharmacokinetic calculations for the adult patient.
PHARMACOKINETICS/PHARMACODYNAMICS
Vancomycin is poorly absorbed from the gastrointestinal tract so it is only given intravenously when treating systemic infections (exception: treatment of Clostridium difficile–associated colitis with oral vancomycin). Vancomycin serum concentration-time profile has been described using one-, two-, and three-compartment pharmacokinetic models. The half-life of the first distributive phase is approximately 0.4 hours where as the half-life of the second distributive phase is about 1.6 hours. Plasma protein binding varies and ranges from 30–55 percent.1,3,4 The volume of distribution is variable and depends on many things such as fluid status, disease state, and age; range is from 0.4–1.0 L/kg.5-8 The elimination half-life is approximately 6 hours, and can be prolonged up to 7 days in patients with renal failure. Approximately 70–90 percent of the drug is excreted unchanged in the kidney by glomerular filtration. The remainder is excreted by tubular secretion and nonrenal routes.1,3
Pharmacokinetic and pharmacodynamic studies have concluded that maximizing the area under the curve/MIC (AUC/MIC) ratio when dosing vancomycin gives optimal efficacy for treating S. aureus infections. An AUC/MIC ratio of ≥400 has been advocated as a target to achieve clinical effectiveness with vancomycin against S. aureus.1,9 A higher target value may be necessary with higher bacterial density at site of infection and may vary depending on site of infection.1,10
The susceptibility breakpoint of vancomycin for S. aureus, set by the Clinical and Laboratory Standards Institute (CLSI), is 2 mg/L, meaning that all S. aureus isolates with MICs of 2 mg/L or less are susceptible to vancomycin, and MICs above 2 are intermediate or resistant. Despite these breakpoints, some reports have suggested that patients infected with S. aureus isolates with vancomycin MICs of 1–2 mg/L are less likely to have treatment success with vancomycin compared with those who have lower MICs.1,11-16 Studies have also suggested that low vancomycin serum trough levels (<10 mg/L) may predict therapeutic failure and even have the potential to contribute to the emergence of hVISA and VISA.1,13,17 For these reasons, it is recommended by current guidelines that vancomycin trough concentrations should be maintained above 10 mg/L and, for complicated infections, 15–20 mg/L.1 Trough concentrations in this range should be able to achieve AUC/MIC ratio of ≥400 if the MIC ≤1 mg/L. When vancomycin MIC for S. aureus is ≥1.5 mg/L, treatment with an alternative agent (other than vancomycin) may be necessary.
PHARMACOKINETIC CALCULATIONS
Vancomycin pharmacokinetics are complex and although they are best described by a two- or three-compartment model, in the clinical setting it is more practical (due to limited sampling) to dose and monitor vancomycin using one-compartment model kinetics.
Challenges associated with calculating population pharmacokinetics include the following18:
1. selecting the best dosing weight
2. estimating the vancomycin clearance from creatinine clearance (CrCl)
3. determining the appropriate weight to estimate CrCl
4. estimating appropriate CrCl in patients with diminished muscle mass and the elderly (e.g., SCr <0.7)
5. determining volume of distribution which can be highly variable
CLEARANCE
Vancomycin is eliminated primarily in the kidney via glomerular filtration, and its clearance is correlated with the patient’s CrCl. In multiple studies, the vancomycin clearance has been shown to be approximately 70–90 percent of CrCl.3,4,6,7 The first step in calculating a vancomycin dose is to calculate the patient’s weight parameters and estimate the patient’s CrCl. Then, estimate the patient’s vancomycin clearance (Clvanco).

For the purposes of this chapter, persons whose total body weight is >120 percent above their ideal body weight, adjusted body weight (ABW) will be used to calculate CrCl. If total body weight is less than ideal body weight, use total body weight instead of ideal body weight for the calculation.
![]()
where ABW = adjusted body weight (kg) and TBW = total body weight (kg).
Equation 320: CrCl (mL/min) using Cockcroft Gault (CG):
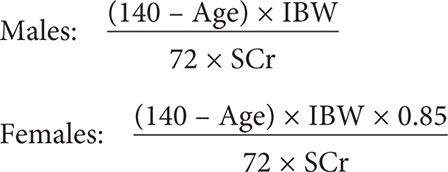
where SCr = serum creatinine (mg/dL).
Equation 4: CLvanco = (70% to 90%) × CrCL
where

Certain patients have low creatinine excretion for age and body weight due to low muscle mass or muscle atrophy. Normal SCr is approximately >0.7 mg/dL. In these patients whose SCr is below normal, SCr maybe falsely low and if it is used to calculate CrCl using CG, it can give an artificially high CrCl. Those who are likely to have falsely low SCr include persons who are malnourished (albumin <3.0 g/dL), bedbound (such as ventilator patients or paraplegics), elderly (≥65 years), and those on chronic steroids or those with certain chronic diseases (such as muscular wasting diseases).2,20 In clinical practice, practitioners frequently round up the SCr to a normal SCr of 0.8 or 1.0 mg/dL. In certain patients, rounding the SCr up to 1.0 mg/dL may result in an underestimation of the patients CrCl and can lead to administration of a suboptimal dose (underdosing). Underdosing can be potentially dangerous in critically ill or septic patients. For patients fitting the previous descriptions, the authors of this chapter recommend increasing the SCr to 0.8 mg/dL, and in the elderly ≥65 years, to increase SCr to 1.0 mg/dL (for purposes of calculating CrCl using CG). In these patients, it is important to monitor renal function closely and to obtain vancomycin serum levels. A patient whose normal SCr is 0.4 may be in renal failure or may be dehydrated if their SCr suddenly increases to 1.0, for example.
VOLUME OF DISTRIBUTION
Vancomycin’s volume of distribution (Vd) ranges from 0.4 to 1.0 L/kg; however, Vd is variable and depends on many patient factors. Assessing Vd is often the most difficult step. Independent factors shown to affect Vd are gender, age, and weight. Females, elderly, and obese patients are known to have a higher vancomycin Vd per IBW.5 Other factors such as fluid status (dehydration vs. fluid overload), disease state (e.g., hematologic malignancy), or illness severity (critically ill, septic shock) also affect the distribution of vancomycin.21-24 Vancomycin Vd as high as 1.68 L/kg has been described in critically ill ICU patients.22
When calculating vancomycin population Vd, a number of methods can be utilized. Some use-specific formulas (see the following examples) and others use an average of 0.7 L/kg. The patient’s total body weight is used for the calculation, unless otherwise specified. For the purpose of this chapter, we will use the Vd formula by Matzke (median value) seen in the following chart. If the patient’s fluid status is known to be abnormal (dehydration or fluid overload), instead of using any equation, we will use either the low or high end of the Vd range (0.4–1.0 L/kg), because equations do not take volume status into account.

Date from Matzke GR et al.6
Ducharme and colleagues5 provide the following calculations:

where EBW = excess body weight (kg); (EBW = TBW – IBW).
The following equation comes from Rushing and Ambrose.25
Vd(L) = 0.17(age) + 0.22(TBW) + 15
ELIMINATION RATE CONSTANT AND ELIMINATION HALF-LIFE
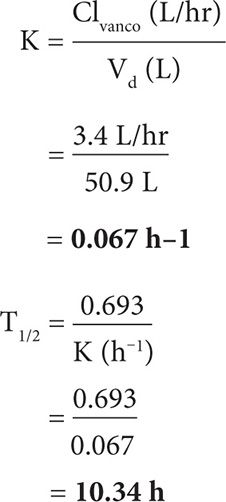
After calculating the CrCl, Clvanco, and Vd, the next step is to calculate the elimination rate constant (K) and elimination half-life (T½). Vancomycin dosing interval usually approximates the T½.

where K = elimination rate constant (h-1) and Vd = volume of distribution (L).

where T½ = elimination half-life (h).
STEADY STATE
Steady state is the point at which the rate of drug administration is equal to the rate of drug elimination and the concentration of drug is constant. This time is the most optimal for obtaining vancomycin levels. It is based on the drug’s half-life and occurs after approximately 4–5 half-lives.
Vancomycin levels should be obtained at steady state. Vancomycin peak levels should be obtained 1 hour or more after the dose has finished infusing in order to allow adequate time for drug distribution, and trough levels should be obtained approximately 0–30 minutes before the next dose.
LOADING DOSE
Administration of a vancomycin loading dose is an important step in trying to achieve a serum concentration that approaches the steady-state maximum concentration. It ensures that we achieve an adequate AUC on day 1 of therapy.2 Attaining steady state is especially important for those patients who have a large volume of distribution or who have a diminished CrCl and long T½. The target peak or initial plasma concentration (C°) is 30–40 mg/L.
![]()
where LD = loading dose (mg) and C° = initial plasma concentration (mg/L).
Alternatively, in clinical practice many people use 25–30 mg/kg loading doses in critically ill patients.1
MAINTENANCE DOSE
After calculating a loading dose, the next step is to calculate a maintenance dose that will give you an approximate peak and trough that you desire (when at steady state). In general, you will want your vancomycin peak to be between 25–40 mg/L and your trough to be 10–20 mg/L. For complicated, severe, or deep-seated infections, it is recommended to aim for a trough of 15–20 mg/L.

where CSSmax = maximum concentration at steady state (mg/L); Dose = dose in mg*; t′ = infusion time in hours; and τ = dosing interval in hours. *When calculating doses, it is best to round to the nearest 250 mg, and rounding up is preferred.
![]()
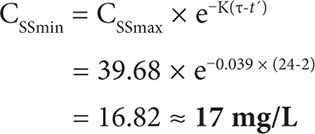
where CSSmin = minimum concentration at steady state (mg/L).
Vancomycin is administered intravenously and is compatible in normal saline (0.9% sodium chloride) and dextrose 5% water (D5W). If vancomycin is administered too quickly or if it is too concentrated, it is known to cause a histamine-like reaction known as red-man syndrome and may also cause thrombophlebitis. If long-term therapy is required or if higher concentrations are used, it is necessary for the patient to have a central line. Usual concentrations approximate 5 mg/mL and historically have been 1,000 mg in 100 mL infused over 1 hour, but vary per institution. At the author’s institution, 500 mg per 100 mL infused over 1 hour; 750 mg per 150 mL infused over 1.5 hours; 1,000–1,500 mg in 250 mL infused over 2 hours; and >1,500 mg in 500 mL infused over ≥3 hours.
CASE STUDIES
CASE 1
AJ is a 56-year-old female who is brought into the ER by EMS with shortness of breath, chest pain, and cough × 7 days. She went to her PMD a few days ago for this problem and was started on levofloxacin, however it was not helping and she was feeling worse. In the ER her temperature was 104º F and her WBC was 17,000 cells/mm3. CXR shows right lower lobe infiltrates. AJ has hypertension, diabetes, and hepatitis C (with moderate ascites). ER attending wants to start the patient on vancomycin (along with other antibiotics) and asks you for a dose.
Height: 5′3″
Weight: 130 lbs
SCr: 1.2 mg/dL
Step 1: Calculate CrCl and vancomycin clearance.

Because patient’s weight is <120 percent IBW, use IBW for calculating CrCl.

Note: To convert from mL/min to L/hr, multiply by 0.06.
Calculate vancomycin clearance (mean = 80%).

Step 2: Calculate Vd.
Multiple formulas can be used to calculate Vd, however, none of them take fluid status into consideration. Because we know that fluid accumulation can affect Vd, and this patient has ascites (increased volume status), it may be more appropriate to choose a larger Vd of 0.9 L/kg in this example.
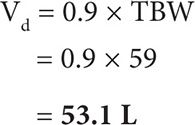
Step 3: Calculate K and T½.
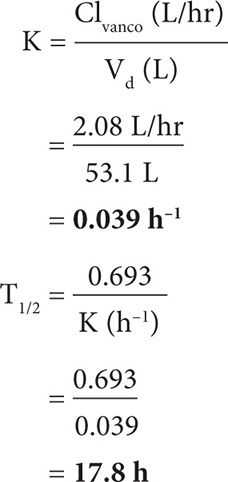
Step 4: Calculate a loading dose.
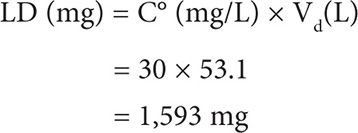
Round to 1,750 mg given as a one-time dose.
Step 5: Calculate a maintenance dose.
Based on population parameters, pick a dose that you think the patient will need and then plug it into MD formula, adjusting as necessary. For patient AJ, because we are treating pneumonia, we are aiming to achieve a vancomycin trough of 15–20 mg/L. We will start out trying a dose of 1,250 mg (infused over 2 hours) given every 24 hours.
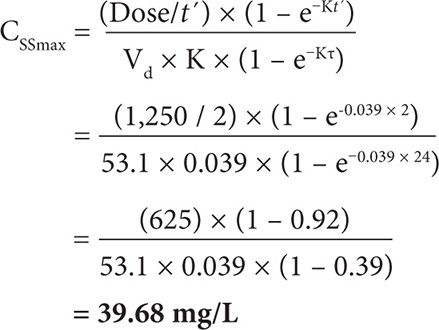
So if we start this patient on 1,250 mg vancomycin given every 24 hours, we can expect approximately a peak of 40 mg/L and a trough of 17 mg/L, which is within our target range.
CASE 2
CK is a 35-year-old male who lives in a nursing home and is admitted to the hospital for altered mental status and fever and was started on pipericillin/tazobactam for empiric treatment of a urinary tract infection. On day 2 the urine culture came back positive for gram-positive cocci. Repeat blood cultures remained negative. Patient has a PMH of paraplegia s/p gun wound three years ago. PMD wants to start the patient on vancomycin until the cultures are finalized and asks you for a dose.
Height: 5′10″
Weight: 145 lbs
SCr: 0.4 mg/dL
Albumin: 2.5 g/dL
Step 1: Calculate CrCl and vancomycin clearance.

Because patient’s weight is <IBW, use TBW for calculating CrCl. With a SCr <0.7 mg/dL for a bedbound patient with an albumin of 2.5 g/dL, round up the SCr to 0.8 mg/dL to compensate for the low muscle mass.

Note: To convert from mL/min to L/hr, multiply by 0.06.
Calculate vancomycin clearance: (mean = 80%).

Step 2: Calculate Vd.
Derived from Matzke’s calculations:
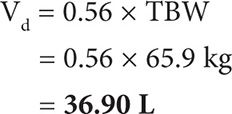
Step 3: Calculate K and T½.
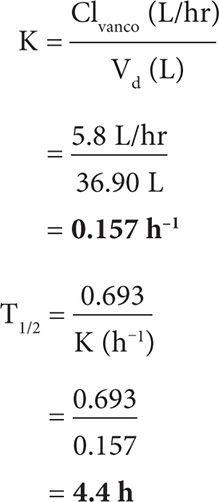
Step 4: Calculate a loading dose.
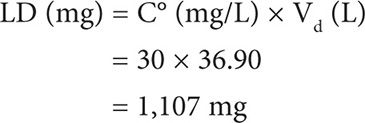
Round to 1,250 mg given as a one-time dose.
Step 5: Calculate a maintenance dose.
Based on population parameters, pick a dose that you think the patient will need and then plug it into the MD formula, adjusting as necessary. For patient CK, because we are treating a complicated UTI, we are aiming to achieve a vancomycin trough of approximately 10–15 mg/L. We will start out trying a dose of 1,000 mg (infused over 2 hour) given every 8 hour.
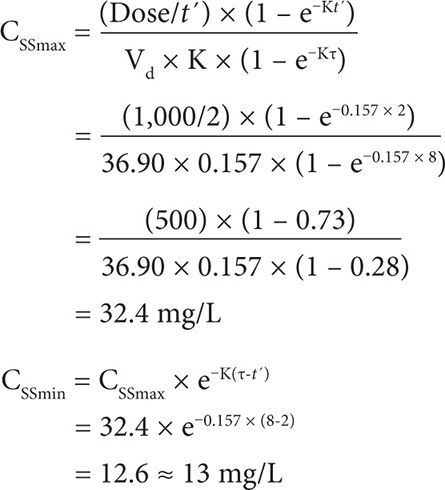
So if we start this patient on 1,000 mg vancomycin given every 8 hours, we can expect approximately a peak of 32 mg/L and a trough of 13 mg/L, which is within the target range.
CASE 3
BA is a 48-year-old male who lives in a nursing home and is admitted to the hospital for fever, chills, and worsening left leg cellulitis. Blood cultures drawn in the nursing home the day before were positive for gram-positive cocci in clusters. In the ER his temperature was 101°F and his WBC was 20,000 cells/mm3. Patient has a PMH of diabetes, hypertension, CAD, and CVA. The ID consultant wants to start the patient on vancomycin and asks you for a dose.
Height: 5′8″
Weight: 200 lbs
SCr: 1.4 mg/dL
Step 1: Calculate CrCl and vancomycin clearance.

Because patient’s weight is >120 percent IBW, use ABW for calculating CrCl.
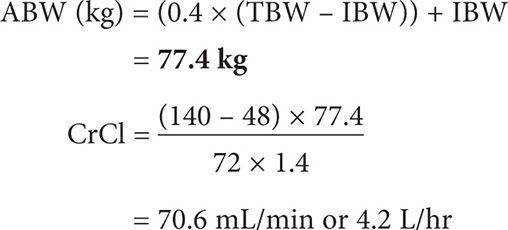
Note: To convert from mL/min to L/hr, multiply by 0.06.
Calculate vancomycin clearance (median = 80%).
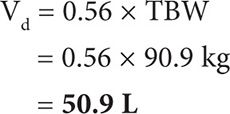
Step 2: Calculate Vd.
Derived from Matzke’s calculations:
Step 3: Calculate K and T½.
Step 4: Calculate a loading dose.
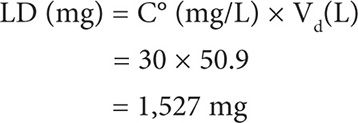
Round to 1,500 mg given as a one-time dose.
Step 5: Calculate a maintenance dose.
Based on population parameters, pick a dose that you think the patient will need and then plug into MD formula. Adjust as necessary. For patient BA, because we are treating severe cellulitis with bacteremia in a diabetic patient (decreased tissue perfusion of vancomycin), we are aiming to achieve a vancomycin trough of approximately 15–20 mg/L. We will start out trying a dose of 1,000 mg (infused over 2 hours) given every 12 hours.
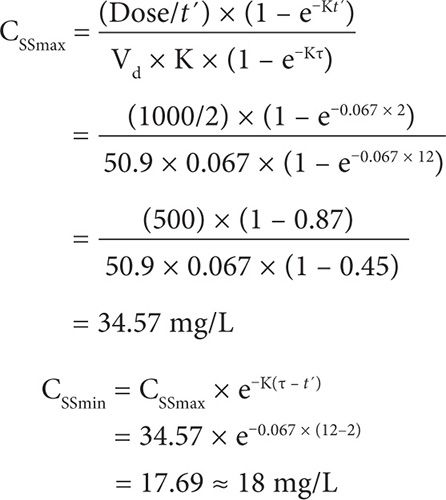
So if we start this patient on 1,000 mg vancomycin given every 12 hours, we can expect a peak of approximately 35 mg/L and a trough of 18 mg/L, which is within our target range.
PATIENT-SPECIFIC PHARMACOKINETICS

where
C1 = observed peak
C2 = observed trough
Δ t = difference in time between C1 and C2 within the same dosing interval
τ = dosing interval
t′ = infusion time
t2 = time between peak drawn and the end of the infusion
t3 = time between trough drawn and true trough
![]()
where Cpeak = true peak (end of vanco infusion).
![]()
where Ctrough = true trough.

Stay updated, free articles. Join our Telegram channel

Full access? Get Clinical Tree


