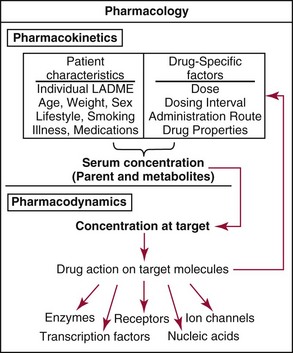
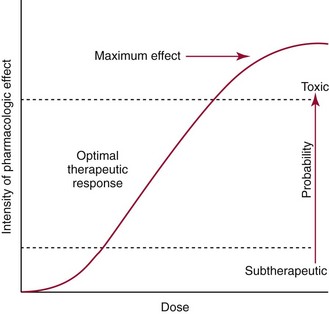
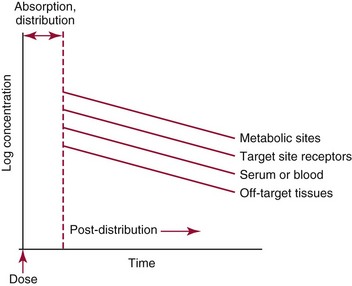
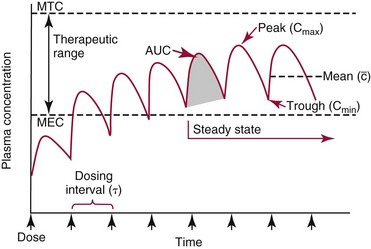
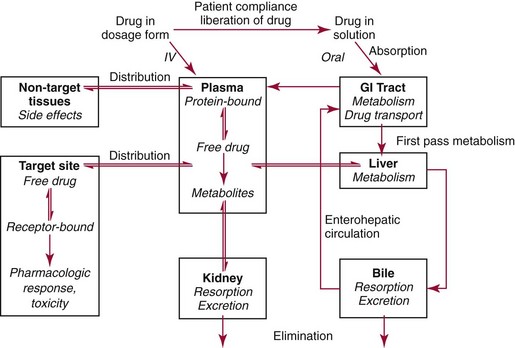
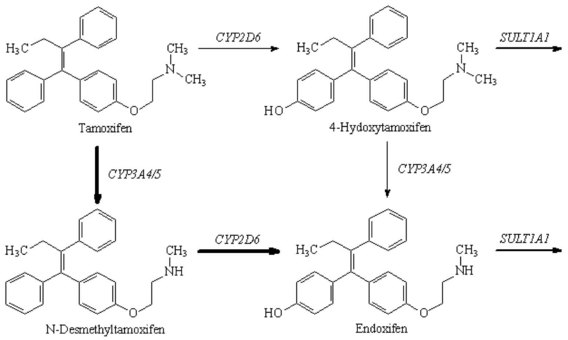
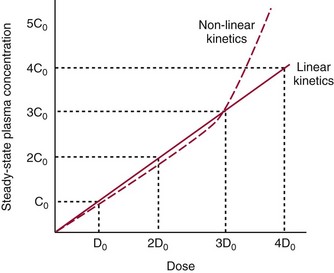
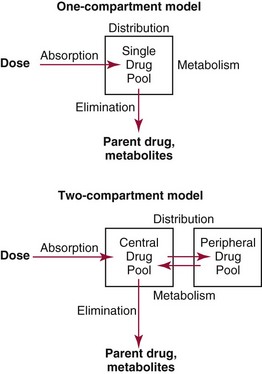
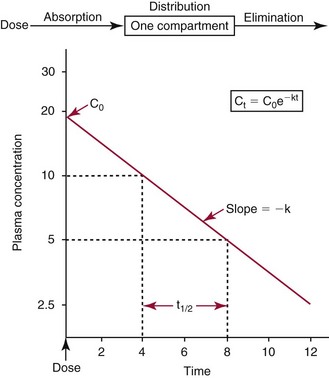
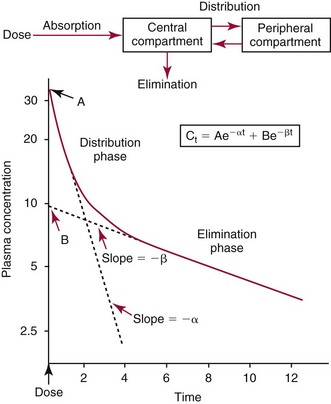
Chapter 34 Christine L.H. Snozek, Ph.D., Gwendolyn A. McMillin, Ph.D., D.A.B.C.C.(C.C.,T.C.) and Thomas P. Moyer, Ph.D. Physicians have long recognized the limitations of empirical drug dosing, such as standard or fixed dose regimens, and have responded with their clinical judgment and knowledge of basic pharmacology to individualize each patient’s drug dosage. Approximately 40 years ago, quantification of drugs in blood or serum, known as therapeutic drug monitoring, became a standard of practice in cardiology, infectious diseases, neurology, and psychiatry, and more recently in transplantation, to facilitate dose adjustments to attain optimal drug response. Therapeutic drug monitoring offered the physician a scientific rather than empirical approach to selecting a drug regimen to optimize therapy. Now known as therapeutic drug management (TDM), this multidiscipline clinical activity facilitates selection of the drug to which the patient responds best, as well as the optimal dose, and allows assessment of therapeutic compliance and efficacy. It also facilitates detection of drug-drug interactions and is the basis for defining drug-induced toxicity. Laboratory testing to support TDM may include (1) detection of risk factors (e.g., pharmacogenomics; see Chapter 43) that qualify or disqualify a person for a particular therapy, based on the likelihood of predictable pharmacokinetics, toxicity, and response; and (2) quantification of drug and/or drug metabolite concentrations in a biological fluid to assess pharmacokinetics or biomarkers indicative of response. The medical professionals involved in TDM include the ordering physician, the clinical laboratorian (the chemical pathologist, the clinical chemist), the clinical pharmacologist, the pharmacist, and the nurse who handles medication delivery and monitoring. Knowledge of the impact of genetics on drug disposition developed rapidly in the late 1990s and continues to develop in the 2000s. This knowledge field as it relates to drug disposition has become known as pharmacogenomics (PG). TDM and PG are highly interactive disciplines used in conjunction to elucidate the overall pharmacokinetic status of an individual patient. Although the basic concepts of PG are outlined elsewhere in this text (see Chapter 43), the specific aspects of the discipline that relate to the interpretation of TDM results are explained in this chapter. Reviews by O’Kane142 and Weinshilboum208 and the Internet Website offered by Flockhart63 are good sources of additional information. This chapter focuses on the role of the laboratory in the discipline of drug monitoring. Excellent descriptions of the roles of the physician and the consulting pharmacologist are presented in Melmon and Morrelli’s Basic Principles in Therapeutics,129 Goodman and Gilman’s The Pharmacological Basis of Therapeutics,30 Burton and colleagues’ Applied Pharmacokinetics and Pharmacodynamics: Principles of Therapeutic Drug Monitoring,34 and Mandell and colleagues’ Principles and Practice of Infectious Diseases.122 The Physicians’ Desk Reference (PDR), published annually by Medical Economics of Montvale, New Jersey, is also an excellent source of dosing guidance and pharmacokinetic information. Pharmacodynamics describes response to drugs (what the drug does to the body) and encompasses the processes of interaction of pharmacologically active substances with target sites, and the biochemical and physiologic consequences that lead to therapeutic or adverse effects.54 For many drugs, the ultimate effect or mechanism of action at the molecular concentration is understood poorly, if at all. However, effects at the cellular or organ system concentration or in the whole body are relatively well understood and usually can be related to the dose of the drug. Figure 34-1 illustrates the conceptual relationship between pharmacodynamics and pharmacokinetics. The former relates drug concentration at the site of action to the observed magnitude of the effect (desirable or undesirable). Pharmacokinetics, on the other hand, relates dose, dosing interval, and route of administration (regimen) to drug concentration in the blood over time. For more complete discussions of these basic concepts, the reader is encouraged to review standard textbooks of pharmacology.30,129,167 Toxicology is the subdiscipline of pharmacology concerned with adverse effects of chemicals on living systems. Toxic effects and mechanisms of action may be different from therapeutic effects and mechanisms for the same drug. Similarly, at the high dose of drugs at which toxic effects may be produced, rate processes are frequently altered compared with those at therapeutic doses. For these reasons, the terms toxicodynamics and toxicokinetics are now applied to these special situations. The mechanism of action of a drug is the biochemical or physical process that occurs at the site of action to produce the pharmacologic effect. Drug action is usually mediated through a receptor. Cellular enzymes and structural or transport proteins are important examples of drug receptors. Nonprotein macromolecules may also bind drugs, resulting in altered cellular functions controlled by membrane permeability or DNA transcription. Some drugs are chemically similar to important natural endogenous substances and may compete for binding sites. Other drugs may block formation, release, uptake, or transport of essential substances. And some may produce an effect by interacting with relatively small molecules to form complexes that actively bind to receptors. These and other examples of receptor binding are more completely discussed in pharmacology texts.30,129,167 Although the exact molecular interactions that describe the mechanism of action remain obscure for many drugs, theoretical models have been developed to explain them. One concept postulates that a drug binds to intracellular macromolecular receptors through ionic and hydrogen bonds and van der Waals forces. This theoretical model further postulates that if the drug-receptor complex is sufficiently stable and is able to modify the target system, an observable pharmacologic response will occur. As Figure 34-2 illustrates, the response is dose dependent until a maximum effect is reached. The plateau may be due to saturation at the receptor or overload of a transport or clearance process. Years of relating blood concentrations to drug effects have demonstrated the clinical utility of drug concentration information. Nevertheless one must always keep in mind that a serum drug concentration does not necessarily equal the concentration at the receptor; it merely reflects it. However, for pharmacokinetic studies, it is assumed that changes in drug concentration in blood (or serum) versus time are proportional to changes in local concentrations at the receptor site or in body tissue. This assumption is sometimes called the property of kinetic homogeneity and is applicable to all pharmacokinetic models in postabsorptive and postdistributive phases of the time course. Figure 34-3 illustrates that property for a hypothetical compound. Parallel concentrations (log C) are expected in blood at the receptor and in tissue as time passes. Concepts depicted in Figure 34-3 are hypothetical; the absolute concentration of a drug in various tissues is highly variable from drug to drug. The property of kinetic homogeneity is an important assumption in TDM because it is the basis on which all therapeutic and toxic concentration reference values are established. Measurable concentration ranges collectively define a therapeutic range (Figure 34-4) that represents the relationship between minimum effective concentration (MEC) and minimum toxic concentration (MTC). In the optimal dosing cycle, the trough blood concentration (the lowest concentration achieved just before the next dose) should not fall below the MEC, and the peak blood concentration (the highest concentration achieved within the dosing cycle) should not rise higher than the MTC. This is usually achieved by administering the drug once every half-life, denoted by τ in Figure 34-4. Multiple dosing regimens should achieve steady-state serum drug concentrations consistently greater than the MEC and less than the MTC within the therapeutic range. Steady state is the point at which the body concentration of the drug is in equilibrium with the rate of dose administered and the rate of elimination. Blood concentrations greater than the MTC put patients at risk for toxicity; concentrations less than the MEC put them at risk for the disorder that the drug is supposed to treat. MTC and MEC are useful guidelines in therapy; this concept is incorporated into tables presented later in this chapter summarizing specific drug data. Doses must be planned to achieve therapeutic concentrations, and these must be monitored to guide dose adjustment if necessary. The smaller the difference between MEC and MTC, the smaller the therapeutic index and the more likely TDM will be necessary. The key concept to remember is that MEC and MTC define the therapeutic range for most drugs. In contrast to the concept of reference intervals in clinical chemistry, no protocol has been generally accepted for establishing the therapeutic range of a drug. For some therapeutic agents, the onset of toxicity may occur before maximal clinical response; for others, there may exist a threshold above which no further clinical improvement is seen, but which is not associated with adverse effects. The therapeutic range, therefore, represents the range of drug concentrations within which the probability of the desired clinical response is relatively high, and the probability of unacceptable toxicity or failure to achieve further clinical benefit is relatively low. Pharmacokinetics is the mathematical description of the physiologic disposition of xenobiotics (drugs, poisons, etc.) or endogenous chemicals. The key processes involved in drug disposition include liberation, absorption, distribution, metabolism, and excretion, commonly referred to by the acronym LADME. These processes are affected by several factors specific to the individual receiving the drug, including disease state, comedication, and demographic elements such as age, weight, and gender (Box 34-1). Such factors contribute to interindividual and intraindividual variability in both drug concentration and pharmacologic response, as summarized in Figure 34-5. The processes of drug absorption, distribution, metabolism, and excretion are discussed in the following sections. Many drugs bind to one or more plasma proteins, most notably albumin, globulins such as α1-acid glycoprotein (AAG), and lipoproteins. In general, acidic drugs associate primarily with albumin, whereas basic drugs preferentially bind globulins and lipoproteins. An equilibrium exists between the amount of drug that is protein-bound and the amount free, that is, not bound to protein; disturbances in serum proteins related to pathologic (e.g., stress response, malnutrition) and physiologic (e.g., pregnancy, aging) settings can shift the balance of this equilibrium. Free drug is more readily accessible to cell membranes, drug receptors, and elimination mechanisms; thus the free fraction is considered the active component of the drug responsible for its biological effects. Changes in equilibrium between free and bound drug can greatly affect the physiologic response to that compound. Serum free drug concentrations have been estimated using ultrafiltration or ultracentrifugation techniques; measurement in oral fluid (saliva) has been proposed as an alternative to ultrafiltration but is unacceptable for most compounds.47 Metabolism is the process by which the body alters the chemical structure of a compound, whether endogenous or exogenous. In the context of drug therapy, metabolism is typically thought to enhance excretion of xenobiotics, most commonly by increasing water solubility. It is important to note that this does not necessarily coincide with deactivation or detoxification of the drug. Acetaminophen hepatotoxicity, for example, is the result of a minor metabolite (N-acetyl-p-benzoquinone imine) rather than the parent compound. Many drug metabolites are themselves active; an excellent example of this is seen with tamoxifen, a selective estrogen receptor modulator used in breast cancer therapy (Figure 34-6). Not only is tamoxifen active, but three of its metabolites display equal (N-desmethyltamoxifen) or greater (4-hydroxytamoxifen and endoxifen) anticancer activity compared with the parent drug.71 Some therapeutics [e.g., acetylsalicylate (aspirin), codeine, tamoxifen] are delivered as inactive or low-activity compounds, called prodrugs, which require metabolism by the body to exert the desired physiologic effect. Active metabolites must be considered when the clinical effect of a medication is assessed. Most drug metabolism in humans is the result of enzymatic activity; metabolic enzymes are expressed ubiquitously in tissues and blood components, but the greatest preponderance by far is found in hepatocytes. Hepatic metabolism varies with age: in neonates and very young infants (<1 year), the liver is immature and metabolic activity is slow. The metabolic rate accelerates as a child ages, reaching a peak around puberty and declining thereafter. Age-specific differences in dosing are often necessary to accommodate this variability in hepatic metabolism. In contrast, the current understanding of extrahepatic metabolism is poor, although undeniably important for certain settings (e.g., intestinal modification of ingested agents, lung detoxification of inhaled compounds).146 Tissue-specific metabolism may also play a role in interindividual differences in response to drug therapy.67 Metabolism can be described using similar mathematical models (e.g., Michaelis-Menten kinetics) to those applied to other enzymatic processes; readers are referred to Chapter 15 for a discussion of enzyme kinetics, although a brief description of first-order and zero-order processes is appropriate here. Most drugs exhibit first-order metabolism, that is, the rate of their metabolism is proportional to the drug concentration. This occurs when the available metabolic capacity exceeds the amount of drug present; thus the rate of biotransformation primarily depends on how rapidly drug molecules associate with enzyme active sites. Compounds displaying first-order metabolism show a log-linear association of concentration versus time, meaning that a given fraction of drug is metabolized per unit time. This forms the basis for a half-life (i.e., the time required to remove 50% of the drug present), as will be discussed in the following sections. Several agents (e.g., ethanol, salicylate, phenytoin, theophylline) do not follow first-order kinetics. Physiologically relevant concentrations of these drugs approach or exceed normal metabolic capacity; thus the availability of enzyme to bind substrate becomes the rate-limiting factor. This situation, where the rate of metabolism is independent of drug concentration, is termed zero-order or nonlinear kinetics (Figure 34-7). The most familiar example of zero-order drug kinetics is the oft quoted clearance estimate for alcoholic beverages: roughly one drink is eliminated per hour, regardless of the number of drinks consumed. Thus, in contrast to first-order metabolism of a set fraction of drug per unit time, zero-order kinetics affects a given concentration of drug per unit time. Although comparatively few drugs display nonlinear behavior at therapeutic concentrations, many will convert to zero-order kinetics in overdoses where available metabolic capacity becomes overwhelmed. An important factor to consider with zero-order behavior is that small dose increases create disproportionately large elevations in serum concentrations because of lack of excess metabolic capacity to accommodate additional drug entering the system. The most important enzymes in phase I metabolism are the cytochrome P450 (CYP) family, with just a few CYP isoenzymes accounting for biotransformation of the vast majority of current pharmaceuticals. Those isoenzymes (CYP2D6, CYP3A4/5, and CYP2C9/10) account for less than half the mass of CYP proteins expressed in the liver176; thus there is ample opportunity for substrate competition for enzyme binding sites. Coadministration of drugs or “herbal” products that are metabolized by the same CYPs creates the potential for exceeding available enzymatic capacity, resulting in decreased metabolism of all substrates of that enzyme, whether exogenous or endogenous. Such drug-drug interactions can often be managed by adjusting the dose of one or both compounds, so long as the physician is aware of the interaction. Drug-metabolizing enzymes are subject to a great deal of interindividual variability, both at the concentration of genetic polymorphisms and at transcriptional or post-translational concentrations. Pharmacogenetics studies the effects of genetic variation in CYPs and other metabolic enzymes; this topic is covered extensively in Chapter 43 and thus will not be discussed here. At the environmental concentration, metabolic activity can be induced or inhibited by a wide variety of drugs, herbal products, and foods. Induction refers to an increase in metabolic activity, typically as a result of enhanced expression of genes encoding drug-metabolizing enzymes. An example of this is the upregulation of CYP3A4 by the herbal product St. John’s Wort; use of this product has been linked to accelerated metabolism of other CYP3A4 substrates including oral contraceptives and immunosuppressive drugs, leading to unintended pregnancies and transplant rejection.123 Intentional induction of enzymes can be performed therapeutically, as with the use of phenobarbital to induce expression of the glucuronide transferase UGT1A1, an enzyme whose reduced activity results in hyperbilirubinemia (i.e., Gilbert or Crigler-Najjar syndrome).163 Inhibition of metabolic activity is more common than enzyme induction. Inhibition can occur by simple substrate competition, where more than one compound must compete for a limited number of enzyme binding sites. This slows the metabolic rate of both substrates, although the difference in metabolism may be more apparent for one of the involved drugs, particularly if one compound has stronger affinity for the enzyme or is present in greater concentration. Other forms of inhibition (e.g., noncompetitive, uncompetitive) directly affect the inherent enzymatic function of a given molecule by binding to the active site or elsewhere on the protein, thus preventing normal metabolic reactions. Mechanisms of enzyme inhibition are discussed in detail in Chapter 15. Many compounds found in therapeutic drugs (e.g., antiretrovirals, antifungals), herbal products (e.g., saw palmetto, Ginkgo biloba), and common foods (e.g., garlic, green tea) have been reported to inhibit metabolic enzymes. The site of inhibition can be important. For example, grapefruit juice potently inhibits CYP3A4 in intestinal cells.81 Reduced metabolism in the gut actually increases bioavailability with less influence on elimination; this can greatly affect CYP3A4 substrates with variable absorption, such as the immunosuppressive drug cyclosporine. Several algorithms are available to predict potential drug-drug interactions, using current information on metabolic enzyme (mainly CYP) inhibitors, inducers, and substrates.55,68,74 Clearance can also be measured directly for a particular drug. This requires multiple samples from the same patient and is infrequently done, except for therapeutic agents with a narrow window between efficacy and toxicity. An example of this is the alkylating agent busulfan, used in high doses to ablate bone marrow precursor cells prior to hematopoietic stem cell transplant. Given the delicate balance between effective ablation (leading to successful transplant engraftment) and excessive treatment (leading to serious complications such as veno-occlusive disease of the liver), serial measurements of busulfan are used clinically to assess exposure to the drug and to individualize subsequent doses.126 Urine can be a useful matrix for drug testing; it is readily collected in a noninvasive manner, is relatively poor in protein and other analytical interferences, and generally shows higher drug concentrations because of the ability of the kidneys to concentrate compounds filtered from the blood. For these reasons, it is the most common matrix for drugs of abuse testing and other toxicologic applications (see Chapter 35). However, it is important to note that the correlation between urine drug concentrations and serum concentrations is poor at best. This is the result of wide variability in several factors that can affect renal drug elimination, including patient hydration status, urine pH, and circadian fluctuations in renal function. Although it may be possible to normalize urine drug concentrations somewhat with 24-hour urine samples and correction to a marker of renal function such as creatinine, in practice urine is rarely used for TDM purposes. In select exceptions such as assessing patient compliance in pain clinics,137 samples are obtained frequently, serum concentrations are poorly related to therapeutic efficacy, and risk of drug diversion or misuse is relatively high. The concept of physiologic compartments is used to envision the systemic distribution of a drug. A compartment is not a true corollary to a particular organ or fluid; rather, each compartment can be thought of as a representation of those regions of the body (e.g., fluids, various tissues) to which a compound partitions with similar affinity. To clarify this, contrast two dissimilar therapeutic agents: one, a drug such as ibuprofen that remains preferentially in the plasma, and the other, a drug like digoxin that distributes extensively into lipid-rich organs. For the former, an administered dose distributes throughout the systemic circulation with minimal partitioning into tissues; thus, only the pool of drug in the blood needs to be considered when factors such as clearance rate are estimated. Such a compound is well described by a one-compartment model (Figure 34-8), where the compartment in this example is roughly analogous to the systemic circulation. Alternatively, digoxin exhibits extensive tissue distribution. After absorption of an administered dose, this agent too will rapidly spread throughout the vasculature (the first compartment). However, because of its lipophilic nature, the drug will undergo a second, typically slower process of partitioning into various organs. This step requires passive or active transport into the tissue, thus its kinetics (e.g., rates of entry into, and departure from, tissues) differs from the initial distribution into the bloodstream. This is modeled with a second compartment, approximating the tissue stores of the compound. Because the only fraction of drug available for transport to sites of metabolism and elimination (e.g., liver and kidneys) is in the circulatory system, removal of distributed drug requires re-entry from the secondary “tissue” compartment back into the “blood” compartment (see Figure 34-8). Thus, the presence of a tissue-bound store of drug can greatly increase the amount of time required to fully eliminate a compound. Note that a drug that distributes to tissue can also be modeled reasonably accurately using a single compartment, so long as the drug exhibits similar kinetics in the tissues and fluids involved; the compartments are not true corollaries to regions of the body, merely representations of the number of distinct pools of drug. Drug concentration following first-order elimination decreases in a log-linear fashion, as is shown graphically in Figure 34-9. The slope of the line describing the decline is the elimination constant, k, which is a measure of overall elimination that includes loss of drug into urine or feces, loss due to metabolism, and so on. The elimination constant is related to half-life according to the following formula: In a two-compartment model, the kinetics of distribution and elimination are distinct from one another, in contrast to the simpler one-compartment model. As shown in Figure 34-10, the initial plasma concentration of drug declines rapidly as the compound equilibrates between the two compartments. This is termed the distribution phase. As equilibrium between the two compartments is approached, the dominant kinetic mechanism becomes the elimination of drug from the plasma pool. This is termed the elimination phase. In general, the elimination process is slowed by the need for drug to leave the tissue compartment before it can be cleared from the body. The slopes fitted to the two phases reflect the distribution (α) and elimination (β) constants, which in turn determine corresponding half-lives for each phase. The distribution half-life is commonly called the alpha half-life, while the elimination half-life is the beta half-life. Calculation of concentration following a single dose incorporates both phases, as is evident in the following equation: As seen in Figure 34-4, drugs administered at regular intervals will accumulate to a point termed steady state, that is, where the amount of drug entering the systemic circulation is in balance with the amount being eliminated. Each dose still produces a peak (Cmax) and a trough (Cmin), but once steady state is reached, each subsequent dose should provide an identical profile of drug concentration versus time. For the purposes of this discussion, the dosing interval (τ) will be assumed to equal the half-life, although this is not universally true in practice. The ability to detect noncompliance is a major asset of consistent use of TDM. The World Health Organization estimates that only half of patients on long-term drug therapy comply with the prescribed regimen; noncompliance may be a result of taking the medication erratically, too often, too infrequently, or not at all. The cost of medication noncompliance is estimated at more than $100 billion in the United States alone.59 Patients at particular risk include the elderly, who frequently must manage several drug regimens for comorbidities; those with conditions prone to reducing ability or will to comply (e.g., severe depression); and individuals whose conditions include asymptomatic periods, wherein patients feel better and forget or do not feel the need to continue treatment. Without routine TDM, noncompliance with therapy may remain unnoticed until symptoms resume (e.g., renewed seizure activity in an epileptic individual) or the treatment fails (e.g., rejection of a transplanted organ). A wide variety of analytical techniques are available to facilitate TDM, including numerous permutations of immunoassay methods such as enzyme multiplied immunoassay technique (EMIT), fluorescent polarization immunoassay (FPIA), cloned enzyme donor immunoassay (CEDIA), and chromatographic techniques such as gas chromatography–mass spectrometry (GC-MS), liquid chromatography–mass spectrometry/mass spectrometry (LC-MS/MS), and high performance liquid chromatography–ultraviolet (HPLC-UV). These methods are discussed in Chapters 13 and 16. Immunoassays provide rapid results and ready automation; chromatographic techniques improve specificity and limits of detection, although at a lower throughput. Unfortunately, commercial immunoassays are not available for many of the newer-generation drugs. LC-MS/MS is progressively replacing other HPLC-based methods; it displays greater selectivity and fewer analytical interferences, allowing development of multianalyte assays with higher throughput and less influence from metabolites or other potentially coeluting compounds. The choice of analytical method typically depends on the availability of resources (e.g., technologist expertise, laboratory funding) and the clinical demand for turnaround. Finally, one further issue of clinical and analytical relevance to TDM is the format in which concentration units are expressed. Measured therapeutic drug concentrations are often expressed in units of micrograms per milliliter (µg/mL) or milligrams per liter (mg/L). However, it is recognized that use of the abbreviation µ could adversely affect patient safety.29 For example, in prescribing medication, a handwritten “µg” can be mistaken for mg (milligram), resulting in a thousand-fold overdose of drug, which clearly has the potential to harm a patient. As part of the National Patient Safety Goals initiative, the U.S. Joint Commission (formerly the Joint Commission on Accreditation of Healthcare Organizations) has identified common abbreviations that might be misinterpreted and therefore should not be used in healthcare, especially when medication is prescribed.2 Of relevance to the clinical laboratory is the use of µg as the abbreviation for microgram. Although µg is not currently on the list of abbreviations to be avoided, it is among a group of notations that are reviewed yearly and considered for inclusion on the “Do Not Use” list.1,2,29 Institutions accredited by the Joint Commission now use “mcg” rather than µg when prescribing medication. Some clinical laboratories have likewise chosen to use mcg in reporting concentrations, although other laboratories continue to use µg in laboratory reports, as this practice does not pose the same risks as those inherent in prescribing medication. The Joint Commission states that the “Do Not Use” list of abbreviations does not currently apply to preprogrammed health information technology systems such as laboratory information systems, electronic medical records, or computerized provider order entry systems.1 Complicating the issue, many national and international organizations [e.g., the Unified Code for Units of Measure (http://unitsofmeasure.org/) and the American Medical Association Manual of Style (http://www.amamanualofstyle.com/)] recommend or mandate the use of µ as the symbol for “micro.” It should be noted that if concentrations are reported in units of mg/L, this obviates any problem with the use of µg/mL without affecting the numeric value. Drug concentrations in this chapter are provided as mg/L (equivalent to µg/mL) or µg/L (equivalent to ng/mL) unless conventionally reported in molar units.
Therapeutic Drugs and Their Management
Definitions
Basic Concepts
Mechanism of Action
Pharmacokinetics
Distribution
Metabolism
Excretion
Pharmacokinetic Models
Compartmental Models
Steady State
Clinical and Analytical Considerations
Clinical Utility
Analytical Concerns
![]()
Stay updated, free articles. Join our Telegram channel

Full access? Get Clinical Tree


Basicmedical Key
Fastest Basicmedical Insight Engine