Chapter 1
The Practice of Pharmacometrics
1.1 Introduction
In the course of the development and clinical use of pharmaceutical products, many questions arise that require quantitative answers regarding issues of safety and efficacy, dose selection, and study design and interpretation. The analytical tools available to researchers and clinicians in part define the questions that can be answered. If a useful tool is available, it must have been invented, and there must be a skilled person on hand with the knowledge to use the tool. As we practice the science of pharmacometrics, we employ computer programs as tools to work with mathematical and statistical models to address diverse questions in the pharmaceutical sciences. The pharmacometric toolkit involves both theoretical modeling constructs as well as analysis software. The would-be analyst must learn the theory and the use of computer software, with its attendant syntax, data format and content requirements, numerical analysis methods, and output of results. Nonlinear mixed effects models have been the primary analysis framework for population-based pharmacometric modeling, and NONMEM (Beal et al. 1989–2011) has been the gold-standard software package for the implementation of these methods. The use of NONMEM in practice requires the development of procedures for efficient and quality-controlled dataset assembly, analysis, model building, hypothesis testing, and model evaluation, as will be discussed in some detail in later chapters of this text.
As pharmacometric tools have developed, the efficiency of use and breadth of applications have also increased. Though these tools have become somewhat easier to use through the development of software packages with graphical user interfaces and ancillary software products such as Perl Speaks NONMEM™ (Lindbom et al. 2004, 2005), PLT Tools (PLTSoft 2013), and MIfuns (Knebel et al. 2008), the learning curve for new pharmacometricians is still quite substantial. This introductory text is written to help with that learning curve for students of these methods.
Perhaps, the key question in regard to the use of a particular drug product is what dosing regimen (i.e., dose and frequency) is safe and effective for use in a patient population, or more specifically, for an individual patient. In the hands of a trained researcher or clinician, pharmacometric analysis can contribute arguably better insight than any other tool available to answer this question. The development of NONMEM and subsequent programs has dramatically enhanced the ability to evaluate sparse data; to pool data for analysis from different studies, subjects, and experimental conditions; and to simulate new circumstances of drug product use.
In traditional pharmacokinetic (PK) studies, a sufficient number of samples must be collected for the PK analysis to be performed on an individual subject basis, whether that analysis is simply the computation of noncompartmental parameters or it is the estimation of the parameters of a PK model through nonlinear regression or other numerical analysis techniques. Data are considered sparse when an insufficient number of samples are collected in an individual to perform the relevant PK analysis for the individual.
The analysis of sparse data was a prime motivating factor for the development of nonlinear mixed effect model approaches. Those patients from whom it is most difficult to obtain data are frequently the ones for whom the appropriate dose selection is most critical. Neonates and the critically ill are patient groups that are likely to differ in PK disposition from the typical healthy adult volunteers in whom most PK data are obtained. Yet, obtaining enough data for pharmacokinetic modeling on an individual patient basis may be particularly difficult in these patient groups.
Traditional therapeutic drug monitoring (TDM), with dose assessment and adjustment following the collection of one or more drug concentrations, is a simplistic approach to sparse data analysis. TDM methods generally assume a particular, previously identified underlying PK model and are not useful for developing such models. Whether a TDM assessment is made through numerical computations or by use of a nomogram, the approaches are generally limited to answering a single question, and frequently have specific assumptions about the time of the sample collection, the dosing interval of the collection, or simplifying assumptions regarding the underlying model. These approaches are efficient and clinically beneficial in application to individual patient care, but they have very limited flexibility to answer other questions related to patient care that might be better answered with more thorough pharmacometric analysis or to make use of data that might not adhere to the assumptions of the method.
The ability to develop nonlinear mixed effects models of PK data when only a few observations were collected from individuals is a significant contribution to the toolkit of the pharmacometrician. These methods were first formalized and made available through the work of Dr. Lewis Sheiner and Dr. Stuart Beal. These brilliantly creative men have provided the foundation of the field of pharmacometrics as a legacy.
1.2 Applications of Sparse Data Analysis
We can consider two broad approaches for the use of sparse PK data. The first is, like the TDM methods described above, to obtain the best description possible for the PKs of a drug in an individual patient. To do so, we assume a prior model with its typical population values and parameter variances and use the patient’s observed sparse samples to develop Bayesian estimates of the most likely PK model parameters for this patient. An assessment of the need for dose adjustment is made possible by this knowledge of the most likely estimates of the PK parameters for an individual patient. The patient’s data and the prior model are then used to estimate a patient-specific model. The patient-specific model can be used to predict concentrations at different doses to optimize the dosage regimen for the individual. This approach represents a clinical opportunity that is not limited by the simplifying assumptions and requirements of a particular TDM approach. The substantial level of training that is required for a clinical pharmacist or physician to be able to use these tools has severely limited their application in practice. However, improved TDM software based on population PK models and Bayesian analysis continue to be developed to facilitate the knowledge gained from sparse information and to make it more accessible to the clinician (BestDose 2013). Pharmacy school curricula should increase the teaching and use of such tools to improve the ability of clinical pharmacists to individualize therapy and improve patient outcomes.
The second and perhaps most broadly used application of sparse data analysis has occurred in the drug development environment when sparse data from many individuals are pooled for the purpose of population PK model development. Such data may be pooled with or without some subjects contributing full-profile data. Combining sparse concentration–time data from many individuals means the burden of sample collection on each patient is reduced in terms of the number of needle sticks for blood draws, total blood volume collected, and perhaps in the number of clinic visits for PK sample collection. Inclusion of sparse sampling is now commonplace, as recommended by FDA, during the conduct of Phase 3 trials and provides PK data in the patients for whom the drug is intended (Guidance 1999).
Including PK data from many patients lends strength to models that attempt to account for differences in PK model parameters between individuals. Covariates, or observable patient characteristics that correlate with PK parameters, are sought to account for a portion of the differences in parameters between individuals. The greater variety and number of patients included in Phase 3 studies give broader range to the covariates observed and enhance the relevance of the PK findings for future applications of the models in other patients. The ability to analyze sparse data allows this enrichment of covariates without the additional cost required to collect and analyze the large number of samples needed for a traditional PK analysis in each individual.
Although the previous comments considering the role of sparse data analysis were made in the context of PK, these observations equally pertain to pharmacodynamics (PD), which is the study of the effects of drugs. The study of pharmacometrics includes PK, PD, and models that link these in some fashion (i.e., PK/PD models).
A very significant advantage of population approaches in pharmacometric analyses is the ability to pool data from different trials into a single analysis dataset and enrich the data for analysis beyond that which is attained from any single trial. Pooling data in this way enhances the applicability of the resulting models. Through population analysis of pooled study data, we are often able to perform analyses that would not otherwise be feasible. For instance, pooling data from Phase 1, 2, and 3 studies allow the researcher to model data following administration of the broad range of doses included in Phase 1 with the richness of covariates encountered in phases 2 and 3 to develop a more robust dataset for a broader understanding of the properties of a drug.
The development of population PK and PD models during new drug development has become routine. These models serve as a repository of knowledge about the properties of the drug. Depending upon the development plan and the issues that were studied in phase 1, some issues, such as the effect of renal impairment and drug interactions, may be assessed with sparse PK samples from Phase 3 clinical trials. Phase 1 studies may give more conclusive results regarding specific study objectives but from a far smaller group that is less representative of the treatment population. In Phase 3 data, a screening approach can be used to assess whether additional Phase 1 trials are needed to address certain regulatory and clinical PK questions.
Population models may be further used to address important development and regulatory related questions. The knowledge and understanding that may result from a model-based analysis can give insight into new study designs or conditions that can be explored through computer simulations. There is a significant move toward simulating clinical trials before actual study conduct in order to improve the probability of successful outcome through optimization of the trial design (Gobburu 2010).
Simulations can also be used to gain information about drug use in special populations such as patients with renal or hepatic impairment or the elderly. For example, dabigatran etexilate mesylate is labeled to be administered at a dose of 75 mg twice daily in patients with severe renal impairment (creatinine clearance of 15–30 mL/min). This dose was not studied in this patient population but instead resulted from conclusions based on simulations from the population PK model results (Hariharan and Madabushi 2012).
1.3 Impact of Pharmacometrics
The impact of pharmacometrics on regulatory and corporate decision making has been considerable. Pivotal regulatory approval decisions have been made based on pharmacometric modeling and simulation for Toradol®, Remifentanil®, Netrecor®, and Neurontin® (Gobburu 2010). According to an internal FDA survey of 42 NDAs submitted between 2000 and 2004, pharmacometric analysis contributed to both pivotal approval decisions and establishing the product label (Bhattaram et al. 2005). According to this survey, pharmacometric analyses have most commonly influenced language regarding product labeling; however, in 14 of the 42 new drug applications (NDAs) reviewed, pivotal approval decisions were made in part based on the pharmacometrics component of the application. For example, as the result of pharmacometric efforts, a two-step dosing regimen was included in the pediatric section of the product label for busulfan, though this regimen was not tested in a clinical trial. Pharmacometric analysis also influenced language regarding the initial dose recommendation in the label of pasireotide injection for the treatment of Cushing’s disease (FDA Briefing Document, Pasireotide 2012).
The number and importance of regulatory decisions made by Food and Drug Administration (FDA) which rely on pharmacometric approaches continues to expand. In a survey of 198 submissions during 2000–2008, pharmacometric analyses influenced drug approval and labeling decisions for more than 60% of submissions, with increasing numbers of submissions and in more therapeutic areas in the later years (Lee et al. 2011). The importance of pharmacometric contributions at the U.S. FDA is also evidenced by the elevation of the Staff of Pharmacometrics to the level of a Division, which occurred in February 2009.
Clinical pharmacology reviewers at the FDA use a question-based review process to review the content of the Clinical Pharmacology summary (Section 2.7.2) of the NDA submission. Questions important to the PK characteristics of a new drug, the influence of intrinsic and extrinsic factors, and the exposure–response relationships for safety and efficacy are included, and the data presented in the NDA are used to answer these questions or to reveal gaps in knowledge. This process is at the heart of an evidence-based review and includes the opportunity for a pharmacometrics review. Pharmacometricians involved in the development of a new drug product need to be able to anticipate the important regulatory questions and provide adequate, quantitative data to address those issues. Such results need to be presented clearly and completely, without ambiguous language, and without errors in the writing, data summaries, or graphical presentations to achieve the appropriate impact.
Pharmacometrics is making a significant impact on corporate development decisions as well, where the support for pharmacometrics in many companies has grown from the ad hoc “clean-up and recovery” applications of the past to planned support for many drug programs (Stone et al. 2010). The majority of pharmacometric modeling activity in the corporate environment takes place in the clinical phases of development. Internal corporate decision making has been influenced by pharmacometrics activities in dose selection and dose modifications, study design, go/no-go decisions, and formulation decisions. Additionally, there has been research and expanding support for areas of decision analysis approaches such as decision models, economic models, comparator models, and utility index applications. New applications such as these will likely move the impact of pharmacometrics forward, beyond the PK and PD modeling support of product labeling. In a recent Pharmaceutical Research and Manufacturers of America (PhRMA) survey on model-based drug development, three companies estimated the financial benefit of pharmacometric activities in 2008 as cost avoidance of $1–5 million, $11–25 million, and $26–100 million (Stone et al. 2010).
Pharmacometric approaches are used to analyze PK and PD data from clinical trials to construct pharmacostatistical models that quantify PK, safety, and efficacy measures and relationships. Pharmacostatistical models differ from the traditional statistics used in drug approval that are historically and routinely performed by statisticians in industry and at FDA for the pivotal assessments of safety and efficacy. There are important differences in the approaches, though there is much benefit to be gained by the groups working together for the efficient and informed development of drug products.
1.4 Clinical Example
A recent publication details the development of a population PK model for propofol in morbidly obese children and adolescents (Diepstraten et al. 2012), and serves as an example of several important aspects and advantages of the population PK approach. Propofol is commonly used for induction and maintenance of anesthesia in adults and children, but children have demonstrated a higher clearance of propofol than adults on a weight-adjusted basis (Schuttler and Ihmsen 2000).
This study was performed with frequent blood collection for measurement of propofol concentrations in each individual patient, so a traditional PK analysis would have been possible in these patients using a two-stage approach. To use a two-stage approach, one would estimate all the parameters of the model in each patient individually, and then compute the means and variances of the parameters across the individuals. This two-stage method has been shown to inflate the random effects (i.e., the variances and covariances of the parameter estimates) (Sheiner and Beal 1980, 1981, 1983; Steimer et al. 1984; Population PK Guidance 1999). The authors chose to use a population PK approach; however, since one advantage of the population approach is the ability to appropriately model the variance of model parameters across patients.
The population model approach allows the development of a model that accounts for the differences in model parameters between subjects. A covariate model can be developed that explains the intersubject variance in parameters based on a measurable covariate and a random-effect parameter. The random-effect parameter accounts for the portion of the parameter variance that is not explained by the covariate. This method is less biased for the estimates of the variance model than the two-stage approach.
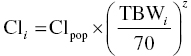
In the propofol example, the authors considered age, total body weight (TBW), lean body weight (LBW), and body mass index (BMI) as predictors, or covariates, of the PK model parameters clearance and volume of the central compartment. Different functional forms were explored to describe the relationship between covariates and model parameters. For example, the relationship between TBW and clearance (Cl) was evaluated with flexible allometric scaling function. The model was expressed as:
< div class='tao-gold-member'>