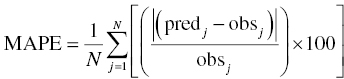
Chapter 8 Much has been written about the appropriateness of the terminology used to denote those activities performed after establishing a model that convey a sense of the appropriateness of the model for its intended use. Terms such as model evaluation, model qualification, and model validation, among others, have been used. Yano et al. define the goal of model evaluation as the objective assessment of the predictive ability of a model for domain-specific quantities of interest or to determine whether model deficiencies have a noticeable effect on substantive inferences (Yano et al. 2001). The FDA’s Population PK Guidance devotes several pages to the description of several methods of model validation, including internal and external validation through predictive performance assessment, objective function mapping and leverage analysis, visual (and numerical) predictive checks, and posterior predictive checks (FDA 1999). In this chapter, we will discuss the typical aims and methodology for these and other techniques for what will be referred to herein globally as model evaluation. Internal validation methods require careful upfront planning and should ideally be specified at the time of analysis plan development to avoid concerns over biased findings. With internal validation techniques, a portion of the analysis dataset is randomly selected and set aside prior to model development (sometimes referred to as the test or the validation dataset). Model development then proceeds with the remainder of the data (usually about 70–80% of the original dataset or original number of subjects, termed the index or development dataset). Once a final model has been established with the model development dataset, the model is used to predict the observations in the validation dataset. With this methodology, the theory is that if the model is an appropriate characterization of the data, the predictions of the randomly selected validation data will be relatively unbiased and precise. Clearly, the procedure for selecting the validation data subset requires careful planning. If the validation subset is not representative of the remainder of the data, no matter how appropriate or predictive the model, this procedure will fail to validate the model. Several factors should therefore be considered in selecting the validation subset. First and foremost, when selecting a portion of the data for a validation subset, the random procedure should select data at the subject level; that is, all of the data for a particular subject should be either included or set aside. Secondly, the design of the study(ies) that comprise the analysis dataset should be considered, and if substantial differences in design exist within or between studies, the random selection procedure should be stratified so as to maintain similar proportions of the different types of data in each subset. This is particularly important as it relates to the sampling strategy(ies) employed. If a portion of the data was collected according to a sparse sampling strategy and a portion followed a richer sampling design, one could imagine that the internal validation procedure may fail if all of the sparsely sampled data were randomly selected for the development dataset and all of the full-profile data were randomly selected for the validation dataset. Finally, when drafting the analysis plan, it may also be advisable to plan for stratifying the subset selection based on particular covariate factors expected to be important (if any) in explaining intersubject variability in PK or pharmacodynamics (PD). Alternatively, after the model validation subset is selected, the characteristics of the subset can be compared to those of the model development subset; if major differences are found, the random selection process could be repeated until the datasets are found similar. The predictive performance assessment that is completed following the selection of data for internal validation is described in Section 8.4. External validation procedures are similar to internal validation procedures in that a portion of the data are used to develop the model and then the model is applied to a separate dataset for prediction purposes. As such, the term external validation can be applied to any number of specific procedures that involve using a separate and distinct set of data in which model predictions are compared to observed data in order to assess model performance. The essential difference between internal and external validation procedures lies in the dataset used for prediction of the model. With external validation, the validation dataset typically arises from data that were collected from a study separate from the one(s) used for model development. The very idea of using the data from a different study to validate a model may generate some rational concerns in that there may be some uncontrollable factor that differs between the two studies, which would render the validation results negative and yet not necessarily be an indication of model inappropriateness. While this is a valid concern, if the predictive performance of the model is good based on an external validation procedure, one would have increased confidence that the model may adequately predict the results of another new study as yet to be performed. As with internal validation procedures, the choice of the study or dataset to be used for the validation dataset should be made carefully, considering differences in study design, sampling, and patient population characteristics. Of practical interest may be the advantage to utilizing an external validation technique when study timelines are delayed for a particular study including PK or PD sampling and of interest for predictive purposes. In this way, model development efforts can proceed with other available data, and the delayed study can still be utilized for external validation of the model. The predictive performance assessment that is completed following the selection of data for external validation is described in Section 8.4. Sheiner and Beal proposed methods for assessing the predictive performance of models using easily calculated statistics (Sheiner and Beal 1981). By comparing the model-based predictions to the observed values (in the validation dataset), one can assess and summarize both the bias and precision of the model across all of the data. A typical measure of bias involves calculating the prediction error (PE j ) using the following formula: where pred j = the jth predicted value and obs j = the jth observed value. It is readily apparent that such PEs will have either a positive or negative sign, indicating that the prediction is greater or less than the observation, respectively. Typically, the MPE, or mean prediction error, is reported as a measure of the overall bias in the model-based predictions (i.e., how biased do the predictions tend to be and in what direction?), which involves taking the mean of the PEs calculated for each observation in the dataset. Similar to the interpretation of the PEs themselves, a positive MPE would indicate a tendency to overpredict the observations, on average, while a negative MPE would indicate a tendency to underpredict the values in the dataset, on average. Note also that the PE can be calculated for the population (typical value) predictions from the model as well as for the individual predictions (accounting for between-subject variability). The reporting of such statistics should always indicate which predicted value (population or individual) is used in the calculation. There are at least two different methods to essentially remove the sign from the PEs, thereby gaining an understanding of the precision of the predictions through the magnitude of the typical deviation (i.e., how far off do the predictions tend to be?). One statistic that is very easily calculated from the PEs is the absolute prediction errors (APEs). Absolute prediction errors address the precision or accuracy of the model-based predictions and can be calculated based on the population or individual predictions, similar to the PEs. To calculate the APE, one would simply take the absolute value of the PE, as follows: As with the PEs, taking the mean of all of the APEs in the dataset (the mean APE) provides an indication of how accurate or precise the predictions from the model are on average. Another method for removing the sign from the PEs involves taking the square of each PE, prior to computing the mean. The mean of the squared PEs is often referred to, logically, as the mean squared error (MSE) and is computed as follows: A related statistic sometimes computed to address precision is the root mean square error (RMSE), calculated as follows: The RMSE may be more easily interpreted than the MSE, since it is expressed in the units of the predictions and observations. Furthermore, such statistics are often reported in percentage units. If one wishes to express the accuracy or precision of predictions as a percentage, it should be clearly stated whether the PEs are expressed as a percentage relative to the observed value or relative to the predicted value, as examples of both are found in practice. The following equation illustrates the calculation of the mean APE as a percentage of the observations: The interpretation of such statistics may be facilitated by expression as a percentage (i.e., if the MAPE % based on population predictions is equal to 21% and based on individual predictions is equal to 13%, we would say that, on average, typical value model predictions tend to be within 21% of the observed values and individual predictions [accounting for between-subject variability] tend to be within 13% of the observed values). When used in practice to compare models, a priori criteria for each statistic (say, < ±10% for MPE, <25% for MAPE) can be specified in the analysis plan to determine the appropriateness or validity of the model. Then, if the calculated statistic based on the internal or external validation exceeds the prespecified criteria, further model refinement may be warranted. On the other hand, if the calculated statistics based on the (internal or external) validation data do not exceed the prespecified criteria, we may consider the model fit for purpose based on the validation procedure. The calculation of standardized PEs is also described in the FDA Guidance for Industry, Population Pharmacokinetics (FDA 1999). The standardization of such PEs has been proposed to take into account both the variability in the predictions as well as the correlation that exists between PEs arising from the same individual. The reader is referred to Vozeh et al. for a detailed description of this standardization approach (Vozeh et al. 1990). The weighted residuals (WRES) provided by NONMEM obtained using the first-order approximation and those obtained using the first-order conditional estimation approximation (CWRES) are standardized PEs, which are commonly used and take into account the correlation of the observations within an individual. Several alternatives to the standardized PEs have been proposed, and much work has been done to explore and compare the statistical properties of these metrics. In 2006, Mentré and Escolano proposed a criterion and test for a new metric called prediction discrepancies (pd), which are based on the whole predictive distribution (obtained via simulation) as a means of evaluating nonlinear mixed effect model performance (Mentré and Escolano 2006). The pd for each observation is defined as the percentile of the observation in the whole marginal predictive distribution under the null hypothesis that the model is appropriate. If the model is valid, these pd should be uniformly distributed over [0, 1], an assumption that can be tested using a Kolmogorov–Smirnov test. Furthermore, these pd can be plotted versus various independent variables to identify whether trends are present, which might be indicative of deficiencies in the model. Mentré and Escolano show that these pd exhibit better statistical performance than the standardized PEs. However, since pd did not take into account the correlation of the observations within an individual, subsequent work by Brendel and colleagues proposed the decorrelation of this metric through the calculation of normalized prediction distribution errors, or npde, a statistic shown to have even better properties than the pd (Brendel et al. 2006). The npde, as with most of the other metrics described, can be used for either internal or external validation, depending on whether computed on the dataset used to build the model (internal validation) or on an external dataset. Furthermore, following the decorrelation and if the model is valid, the npde are shown to follow a N(0, 1) distribution, which can be tested in several ways. First, to test whether the mean is significantly different from 0, a Wilcoxon signed-rank test can be performed; second, to test whether the variance is significantly different from 1, a Fisher test for variance can be used; and, finally, to test whether the distribution is significantly different from a normal distribution, a Shapiro–Wilk test can be performed. In their work, Brendel et al. discussed several techniques for external model evaluation methodologies, differentiating their recommendations for methodology selection based on the intended use of the model (Brendel et al. 2006). Among the techniques they explored are those based on PEs or variations of same (deemed appropriate if the aim of the model is simulation), population parameter estimates or hyperparameters (parameters of a prior distribution) which are preferred when the goal is to compare two populations, and objective function-based methods (found useful during model building). In 2008, Comets and colleagues described an add-on package for the open-source statistical package R, designed to compute npde, thus facilitating the use of this metric (Comets et al. 2008). In NONMEM version 7.1.2 and later, npde can be simply requested in the $TABLE file output using the variable NPDE. Brendel, Comets, Laffont, and Mentré published a simulation-based comparison in 2010 of the statistical properties of npde, pd, standardized prediction errors (SPE), numerical predictive check (NPC), and decorrelated NPC (NPCdec) for the external evaluation of a population pharmacokinetic (PK) analysis (Brendel et al. 2010). The authors recommend the use of npde over SPE for external model evaluation (and therefore for internal model evaluation) since npde do not depend on an approximation of the model and have good statistical properties. Moreover, the authors considered interpretation of npde to be less subjective compared to NPC, as NPC does not account for within-subject correlation. The exact binomial test applied to NPCdec was proposed as an alternative to computing a statistic, but the choice of the prediction interval(s) to study remains an issue for the modeler. Objective function mapping, sometimes also referred to as likelihood profiling or log-likelihood profiling, is a technique that aims to assess whether or not a global minimum was obtained with respect to each model parameter during model convergence. In addition, objective function mapping procedures are commonly used to obtain nonasymptotic confidence intervals (CI) around model parameters. With objective function mapping, for each estimated parameter of the model (elements of θ, Ω, and ∑
Introduction to Model Evaluation
8.1 Introduction
8.2 Internal Validation
8.3 External Validation
8.4 Predictive Performance Assessment
8.5 Objective Function Mapping
![]()
Stay updated, free articles. Join our Telegram channel

Full access? Get Clinical Tree


