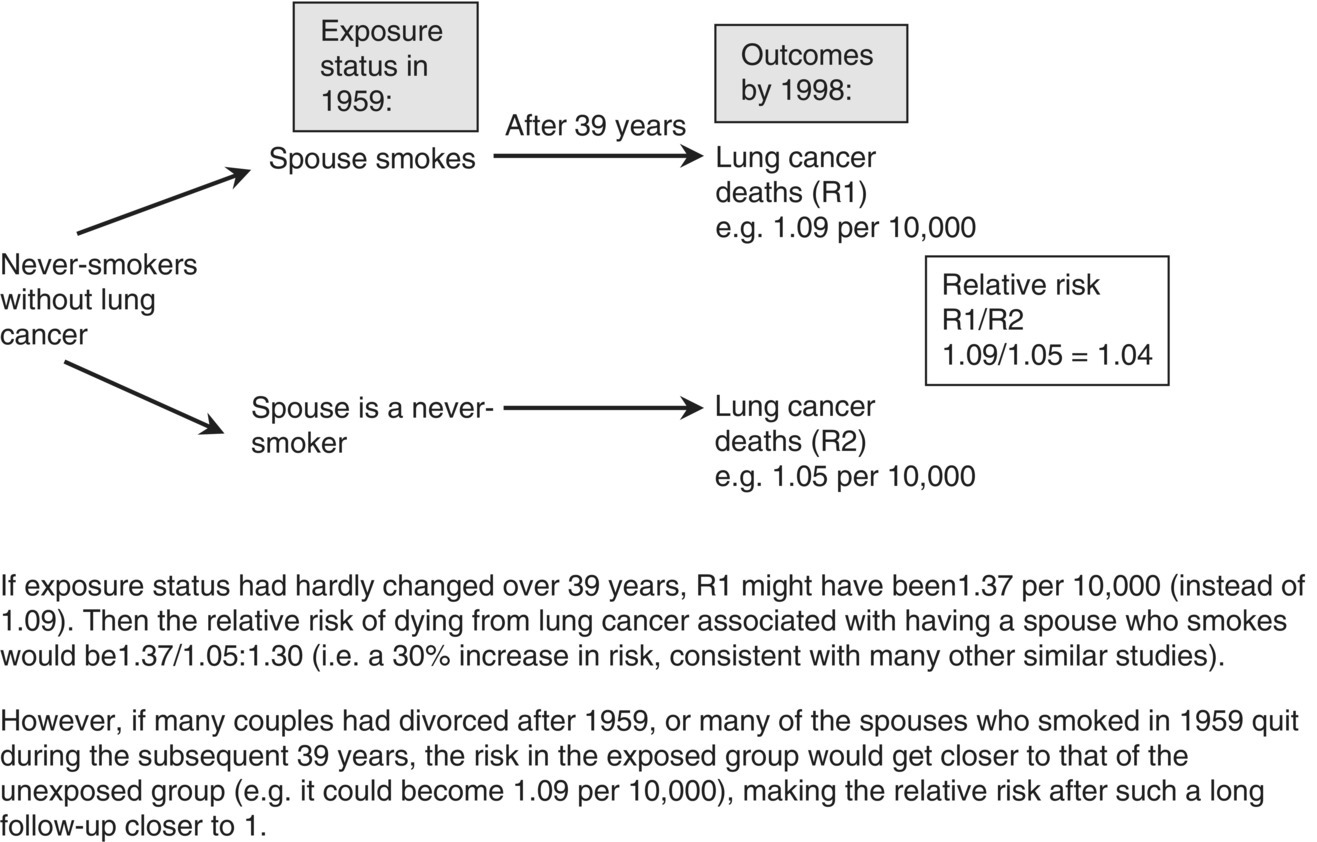
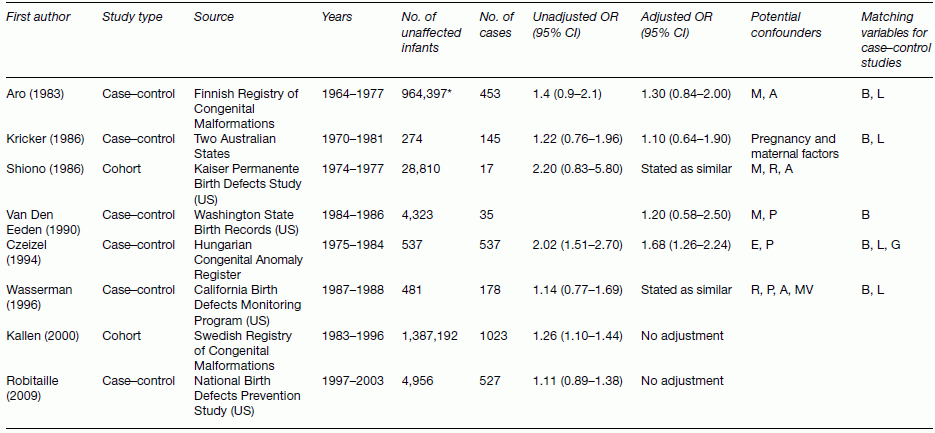
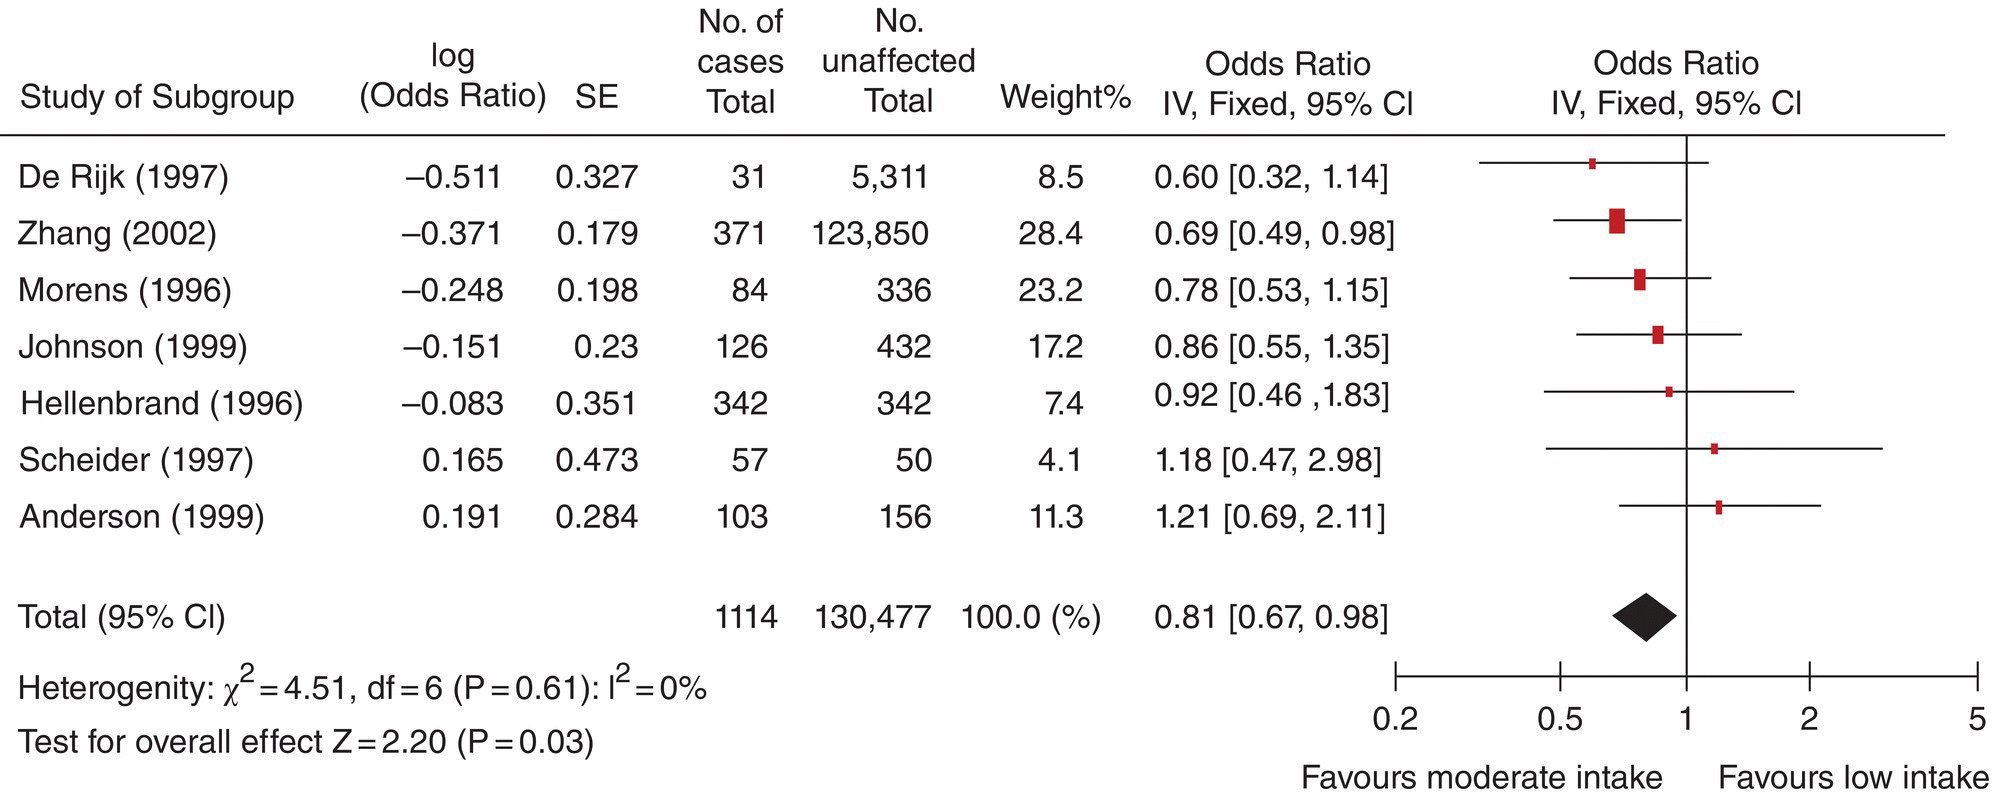
Chapter 10 Chapters 5–8 provide an overview of the design and analysis of individual observational studies. Systematic reviews combine results from several published or unpublished studies, and are generally considered to provide more reliable evidence of an association than an individual study. Further reading on systematic reviews can be found elsewhere [1–6]. No two observational studies are identical in design and conduct, even if they have the same primary research objective. No single study should be used to change public health or clinical practice unless sufficiently large and conclusive. Ideally, there should be supporting evidence from two or more independent studies, in which the results are consistent. There are many occasions when results from different studies conflict, and the reasons must be investigated. An example of inconsistent study results is illustrated in Table 10.1, which shows the key features and results from three observational studies examining the association between exposure to environmental tobacco smoke (passive smoking) among female never-smokers and the risk of lung cancer. The approach used here can be applied generally, that is, attempting to identify sources of bias and confounding, issues over study design and conduct, and biological plausibility. Table 10.1 Key design features and the main result from three observational studies of the association between passive smoking and the risk of lung cancer among female never-smokers. * Exposed to passive smoke versus unexposed. The results cover all possible outcomes; one shows a clear positive association (i.e. exposure is associated with increased risk) [7], another suggests a protective effect (exposure associated with decreased risk) [8], and the third shows no evidence of an association in either direction [9]. Such discordant results may seem easily possible if the studies involved are small, but in this instance all three were relatively large (i.e. many participants and/or many cases of lung cancer). The results from the Japanese study were as expected [7]. One key feature of causality is biological plausibility (see Box 2.6). The causal link between active smoking and lung cancer is well established, and exposure to environmental tobacco smoke involves breathing in the same carcinogenic substances as active smoking. Another key feature is dose–response; smoking 20 cigarettes per day will have a higher risk than smoking 10, which in turn has a higher risk than smoking 5, and so on. Because it is generally accepted that there is no low level of exposure at which there is no excess risk of cancer, even smoking a single cigarette each day should be associated with some increased risk, compared with never-smokers, and evidence suggests that passive smoking could be equivalent to smoking about half a cigarette per day [10]. Therefore, there are robust scientific reasons for the association observed in the Japanese study. The study from China [8] indicated that exposure to passive smoke reduced the risk of lung cancer by 30%, an odds ratio (OR) of 0.70 (Table 10.1). The 95% confidence interval (CI) excludes the no effect value 1.0, and the p-value, which was not reported in the publication, is estimated to be 0.005 or 0.02 if the upper limit was 0.94 rounded to 0.9 (using Box 6.8). Because this is statistically significant, it can be concluded that the effect was unlikely to be due to chance, if basing the interpretation on the p-value alone. However, no one would seriously claim that passive smoking could actually reduce the risk of lung cancer. In the study, heating and cooking practices increased lung cancer risk, which could have been exacerbated by a lack of ventilation (the women lived in northern China, which is very cold in winter). So it is possible that an association between passive smoking and lung cancer was blurred by other, more important risk factors. There is also the possibility that the effect was a chance finding in this particular study; a p-value of 0.005 means that an OR of 0.70 (or more extreme) could occur just by chance in 5 in 1000 studies of a similar size. This could, therefore, be one of those five studies. These hypotheses are, of course, unconfirmed. The study from the US [9] requires more careful consideration. It was based on a subset of participants (in California), within a larger national cohort study, conducted in 25 US states. Initially, there seems to be nothing unusual about the study design or conduct, and in many situations, the large sample size (177 + 25,942) and long follow-up (39 years) would be considered as strengths. However, in this particular example, it is likely that after such a long follow-up, the exposure status has changed. Figure 10.1 shows how using only baseline exposure information could lead to a diluted effect. The exposure was whether women who were never-smokers did or did not live with a smoker, but this was ascertained at the start of the study (1959), and compared with the incidence of lung cancer over the subsequent 39 years. Because California had a high smoking quit rate, many women who were classified as ‘exposed’ at baseline were likely to have become unexposed later on (because their husbands quit smoking), and their risk of lung cancer should decrease to that of the original unexposed group. In the published results, 63% of ever smoking husbands were current smokers in 1959, compared with only 26% in 1998. A further consideration is that California had one of the highest divorce rates in the US, so women who were initially classified as exposed could have separated from their husband who smoked, and therefore no longer be exposed. These two features of the long follow-up could work together to explain why there was no apparent increased risk associated with exposure to environmental tobacco smoke, in contrast to most other studies. However, it is also worth noting that the 95% CI was 0.66–1.33, so the upper limit allows for the possibility of an excess risk. Figure 10.1 Illustration of how changes in the exposure status could lead to an underestimated relative risk (using the study in Ref. [9]). Interpreting and making conclusions about the results of a study can be relatively straightforward if they match the study hypotheses and are consistent with other studies and evidence. However, the example in Figure 10.1 shows that there are situations where this is not the case even when the study designs appear to be sufficiently reliable. It is important, to investigate such anomalies in study results, and attempt to find possible explanations. This can be done by further analyses of the data and by using evidence obtained elsewhere. Study results that seem to be inconsistent are a primary reason to perform a systematic review. In the case of the example such a review was conducted for 37 studies, which showed a clear and statistically significant excess risk of 24% (relative risk 1.24, 95% CI 1.13–1.36, p < 0.001) [11, 12]. This result was considered in the context of biological plausibility, other evidence, and with allowance for bias and confounding before concluding a causal association. Large studies usually provide more robust results, allowing unambiguous conclusions to be made. In small studies, it can be difficult to detect an association, if one exists, and statistical significance is often not achieved (the p-value is ≥ 0.05). This means that a real effect could be missed and there may be uncertainty over whether an observed result is real or due to chance. The limitations of small studies could be largely overcome by combining them in a single analysis. This is one of the main purposes of a systematic review. Systematic reviews are different from review articles, which are often narratives, based on selected papers, and may therefore reflect the personal professional interests of the author. Review articles may incorporate a bias towards the positive (or negative) studies, and reviews tend to describe the features of each paper, without trying to combine the quantitative results. A valid assessment of several studies together needs to be conducted in a systematic and unbiased way. Systematic reviews are generally considered to provide a better level of evidence than an individual study, and there are several reasons for undertaking them (Box 10.1). Systematic reviews are a formal methodological approach to obtaining, analysing, and interpreting all the available reports on a particular topic. In an era of evidence-based health, where health professionals are encouraged to identify sources of evidence for their work, and to keep abreast of new developments, systematic reviews are valuable summaries of the evidence. A review is only as good as the studies on which it is based. If an area has been investigated mainly using small, poorly designed studies, a review of these may not be a substitute for a single large well-designed study. A typical systematic review process is outlined in Box 10.2. The summary data (i.e. effect sizes) can be extracted from the published papers. Alternatively, the raw data might be requested from the authors; Individual Patient Data (IPD) meta-analysis. Data is sent to a central depository, essentially forming a single large dataset, with a variable that identifies each original study. One of the main advantages of IPD meta-analyses is that having the raw data allows subgroup analyses to be examined more reliably than using summary data from publications. Systematic reviews can take from just a few weeks up to 2 or more years to complete, depending on how many studies there are and the type of meta-analysis to be conducted. Those based on IPD can be lengthy and require dedicated resources, because the raw data needs to be collected from each research group, collated, and checked before conducting the statistical analyses and writing the report. Systematic reviews usually focus on studies that compare two or more groups of study participants, and can also be used to combine studies of a prognostic marker. The considerations when examining a review are: A first step is to summarise the key features of the studies in a table. This is illustrated in Table 10.2 using an example to be covered on page 209. Three important aspects are study design, study size, and which confounding factors were allowed for. Table 10.2 Studies examining the effect of maternal smoking on the risk of limb reduction defects (missing or deformed limbs, including missing, fused, or extra fingers or toes) [13]. * Could have other defects. Confounding or matching factors abbreviations: M (maternal age), A (maternal alcohol use), R (race/ethnicity), P (parity or gravidity), E (maternal or paternal education), MV (periconceptional multivitamin supplementation including folic acid), B (birth month or year), L (location or study centre), G (infant gender). NB: for Wasserman (1996), two factors were used to match controls to cases, but no factors were adjusted for in the statistical analysis. Figure 10.2 shows a typical meta-analysis plot (a forest plot), associated with a review of vitamin E and Parkinson’s disease (Box 10.3) [14]. For plots like these, studies are usually listed in alphabetical order, according to the first author’s surname, or by year of publication. However, it is more useful to order the studies by the magnitude of the effect size, making it easier to see how many studies lie below and above the no effect value, and the variation in effect sizes including possible outliers. Forest plots like the one shown in Figure 10.2 can be created using freely available software, RevMan [15]. Figure 10.2 Example of a forest plot from a meta-analysis: observational studies investigating the association between dietary vitamin E intake and Parkinson’s disease (Box 10.3). The figure was obtained using RevMan. SE, standard error; cases, with Parkinson’s disease; unaffected, without Parkinson’s disease. Data from Ref. [14].
Systematic reviews and meta-analyses
10.1 Dealing with inconsistent study findings


10.2 Systematic combination of studies
10.3 What is a systematic review?
10.4 Interpreting systematic reviews


Stay updated, free articles. Join our Telegram channel

Full access? Get Clinical Tree


