(8.1)
where
 is the heat of mixing,
  is the entropy of mixing, and T is the absolute temperature. Usually, the entropy increases after mixing. Therefore, if
  , then
  , and the mixing reaction can occur spontaneously from a thermodynamic point of view. On the other hand, if
  depends on the temperature. If the temperature is adequately controlled to make the enthalpy term larger than the entropy term, then
 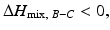 and if the heat of mixing between elements A and C is positive, i.e.,
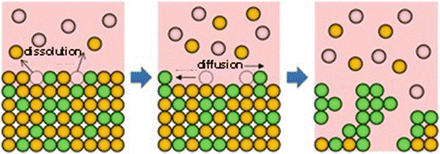
Fig. 8.1
Schematic of the dealloying method using a metallic melt, where atom B (orange) dissolves into a melt composed of C atoms (pink) and the remaining atom A (yellowish green) self-organizes into a porous structure by surface diffusion
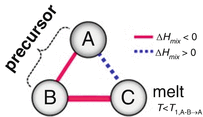
Fig. 8.2
Triangle relationship of the enthalpies of mixing among elements A, B, and C for dealloying in a metallic melt
8.2 Porous α-Ti and β-Ti Alloy Prepared by Dealloying with a Metallic Melt
8.2.1 α-Ti [8]
The values of heat of mixing between various elements are tabulated in Table 8.1, which include some RE (rare earth) metal candidates. Here, A = Ti and candidates for the other suitable elements appropriate to the triangle relationship described by Fig. 8.2 are selected from the table to be B = Cu and C = Mg. As shown in Fig. 8.3a, the Ti–Cu binary system includes a solid solution and intermetallic compounds; thus, this binary system can be used for the precursor. It is confirmed from the related phase diagrams [20] shown in Fig. 8.3b, c that Mg alloys with Cu (Fig. 8.3b), which is expected to dissolve from the precursor, while on the other hand, Mg separates from the Ti element over wide composition and temperature ranges (Fig. 8.3c). The nominal composition of the precursor is determined to be Ti30Cu70 at%. The ingot is prepared by arc-melting high-purity Ti (99.99 mass%) and Cu (99.99 mass%) metals in an argon atmosphere. Thin ribbons of the Ti–Cu alloy about 10 mm wide and 30 μm thick were prepared by the melt-spinning method. The x-ray diffraction (XRD) pattern of the ribbon is a broad halo pattern (not shown), which is a characteristic of an amorphous structure; however, it has been confirmed that the dealloying reaction does not depend so much on the precursor structure, and crystalline alloy structures are also acceptable. About 10 g of Mg (99.9 mass%) was inductively heated in a carbon crucible under an argon atmosphere to create a pure liquid. The Mg melt must be maintained at a temperature less than 1,233 K, which is the lowest liquid temperature of the Ti57Cu43 (at%) alloy (see Fig. 8.3a), to avoid mixing the Ti–Cu alloy system with a titanium concentration from 30 at% to 100 at% together with the melt in a liquid state. Here, we set the melt temperature at 973 K and the dipping time to 5 s. Figure 8.4 shows (a) a scanning electron microscopy (SEM) image of a polished cross section of the ribbon precursor dipped in the Mg melt and (b) the XRD pattern of the bulk precursor dipped in the Mg melt under nearly the same conditions as the ribbon precursor shown in (a). It is recognized that the Ti30Cu70 alloy precursor became a nanocomposite consisted of hcp-Ti regions of about 200 nm in size surrounded by hcp-Mg regions after dipping in the Mg melt, which can be confirmed by the XRD pattern shown in Fig. 8.4b. The nanocomposite was dipped in a nitric acid aqueous solution to remove the Mg phase, and then the bending fracture surface was evaluated by SEM-energy dispersive x-ray spectroscopy (SEM-EDX). The results in Fig. 8.5 show that the nanocomposite became a porous structure of pure Ti consisting of hcp-Ti particles of ~200 nm size partially bonded together, and no Mg phase was detected even around the central part of the fracture surface. Evidently, the nitric acid aqueous solution penetrated from the surface of the sample and dissolved all traces of Mg phase inside the material. In other words, the original Ti/Mg nanocomposite was a completely bicontinuous structure, as schematically shown in Fig. 8.6a, in comparison with the isolated structure shown in Fig. 8.6b, and all pores remaining after the removal of Mg are connected to the outside of the sample. Figure 8.7 shows a transmission electron microscopy (TEM) image and a selected area electron diffraction pattern of the nanoporous Ti. The presence of Ti particles of a diameter of about 200 nm without grain boundaries indicates that the particles are single crystals. Thus, the porous structure was formed by partially connected Ti single crystals. Based on the same reaction design, open-cell-type nanoporous metals were formed from base metals such as Fe, Cr [10], Nb [11], and even a metalloid of Si [21], confirming the universality of this reaction design of dealloying in a metallic melt. Figure 8.8 shows SEM images of the fracture surfaces of these various nanoporous base metals, and the insets demonstrate the triangle relationships used in the preparation of each nanoporous metal.
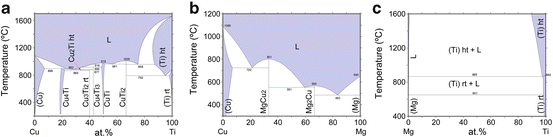
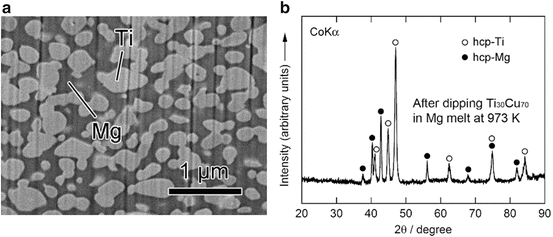
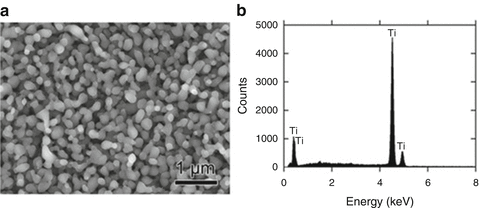
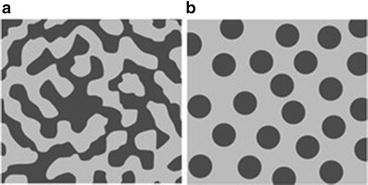
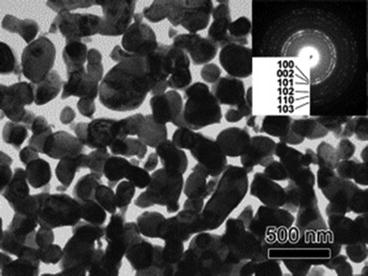
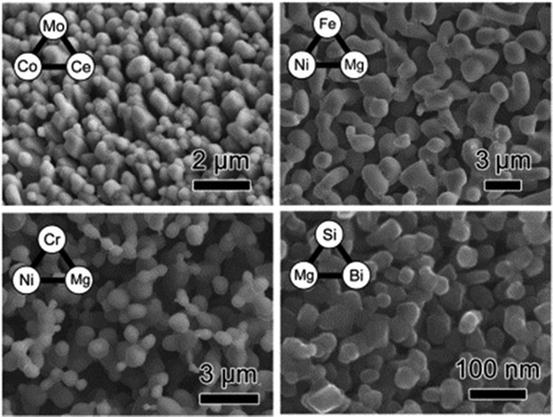
Table 8.1
Enthalpies of mixing (kJ/mol) among A = Ti, B = Ni, and C = Mg, Ca, and Ce (rare earth), where A, B, and C satisfy the triangle relationship shown in Fig. 8.2
A | B | C | ||||
|---|---|---|---|---|---|---|
Ti | Cu | Ni | Mg | Ca | Ce | |
Ti | −9 | −35 | +16 | +43 | +18 | |
Cu | −3 | −13 | −21 | |||
Ni | −4 | −7 | −28 | |||
Fig. 8.3
Binary phase diagrams for Ti–Cu (a), Cu–Mg (b), and Mg–Ti (c)
Fig. 8.4
Scanning electron microscope (SEM) image of a polished surface of Ti30Cu70 (at%) alloy dipped in a Mg melt at 973 K for 5 s (a) and a corresponding XRD pattern from the surface (b) (Reprinted from Ref. [8], Copyright 2011, with permission from Elsevier)
Fig. 8.5
SEM image of the bending fracture surface of porous Ti prepared by dipping the Ti30Cu70 (at%) alloy into a Mg melt followed by leaching the Mg phases in a nitric acid aqueous solution (a) and the EDX result obtained from the central part of the fracture surface (b) (Reprinted from Ref. [8], Copyright 2011, with permission from Elsevier)
Fig. 8.6
Schematic of typical composite structures: bicontinuous (a) and isolated (b)
Fig. 8.7
Transmission electron microscope (TEM) image of porous Ti with its corresponding electron diffraction pattern in the inset (Reprinted from Ref. [8], Copyright 2011, with permission from Elsevier)
Fig. 8.8
SEM images of the fracture surfaces of porous base metals, Mo, Fe, Cr, and Si together with the corresponding triangle relationship of the enthalpies of mixing used for the preparation
Here, we summarize the preparation procedures for nanoporous metals and nanocomposites by dealloying in a metallic melt, as they are schematically shown in Fig. 8.9:
For preparing nanocomposites, the 4th step of the process is not required.
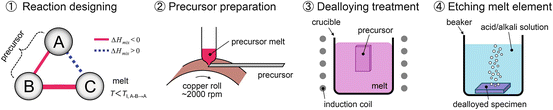
1.
Selection of A–B–C elements, which satisfy the triangle relationship of the heats of mixing (tables of values of heat of mixing and equilibrium phase diagrams can be used)
2.
Preparation of the A–B alloy precursor
3.
Selective dissolution of element B from the A–B precursor into the C metal melt (formation of the porous structure)
4.
Removal of the C element by etching with an acid or alkaline solution (the remaining A component must be inert in the solution)
Fig. 8.9
Schematic of the process of porous metal preparation using dealloying within a metallic melt
8.2.2 β-Ti Alloy [9]
In the above section, we outlined the newly proposed concept of dealloying where a metallic melt is used as the dealloying medium. By employing three metal elements that satisfy the triangle relationship of the heats of mixing shown in Fig. 8.2 and also referring to the equilibrium phase diagram database, we confirmed that dealloying actually occurs using a metallic melt, and an open-cell-type nanoporous Ti was successfully prepared, which has never been achieved by conventional dealloying in an aqueous solution. In the next step, we apply our dealloying method for preparing open-cell-type nanoporous metal alloys. To realize this application, the triangle relationship is extended wherein the role of element A in Fig. 8.2 is expanded to incorporate additional elements A′, A″, …, which are similar to element A in terms of their values of heat of mixing with B and C. Based on this strategy, we expect the formation of nanoporous A-A′-A″… alloys under the appropriate dealloying conditions. Here, we demonstrate the preparation of a β-type nanoporous Ti alloy by extending the preparation method for nanoporous Ti described previously. Generally, Ti has a hcp crystal structure at room temperature but has a bcc structure as a high temperature phase. By adding bcc stabilizers, a Ti alloy having a bcc structure, namely, the β-type Ti alloy, can be obtained even at room temperature. Among the potential bcc stabilizers, if those elements which are similar to Ti in terms of its heat of mixing with Cu and Mg are employed as the additional elements in the Ti–Cu precursor, these bcc stabilizers will not dissolve into the Mg melt during dealloying treatment and would thus remain, forming the β-Ti alloy phase with a nanoporous structure. Among these bcc stabilizers, we selected Cr and also Zr as a neutral element for the additional elements because similar to Ti, Cr and Zr can mix with Cu but separate from Mg. These elements satisfy the triangle relationship of the values of heat of mixing shown in Fig. 8.10. A pseudo-binary alloy with a composition of (Ti0.847Zr0.055Cr0.098)20Cu80 (at%) was employed as the precursor. The dissolving component, Cu, is added to the remaining component, Ti84.7Zr5.5Cr9.8 (at%) alloy, which is reported to form the β-Ti alloy at room temperature [22]. Using this precursor, the dealloying reaction in the Mg melt was investigated.
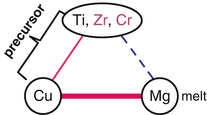
Fig. 8.10
Triangle relationship of the enthalpies of mixing among Ti, Zr, Cr, Cu, and Mg
Figure 8.11a (top) shows XRD patterns of the 40 μm thick (Ti0.847Zr0.055Cr0.098)20Cu80 melt-spun ribbon precursor. The phases present in the as-spun ribbon precursor were a mixture of crystalline Cu and Cu3Ti. Figure 8.11a (bottom) and 8.11b shows XRD patterns and a back-scattering SEM image from a cross section of the (Ti0.847Zr0.056Cr0.098)20Cu80 alloy dealloyed in the Mg melt at 973 K for 15 min, respectively. The XRD measurement was performed with the bulk sample prepared under the same conditions as the melt-spun ribbon to enhance the accuracy. These analyses reveal that the precursor composed of Cu and Cu3Ti phases transformed into a nanocomposite of α-Mg and β-Ti composed of regions about 500 nm in size by dealloying the Cu element in the Mg melt. Figure 8.12 shows (a) bending fracture surface, (b) enlarged surface, (c) EDX spectrum, and (d) TEM image with the electron diffraction pattern in the inset for the porous Ti-based alloy prepared by etching α-Mg from the β-Ti/α-Mg composite using a 3 mol/l nitric acid solution for 30 min followed by washing/drying.
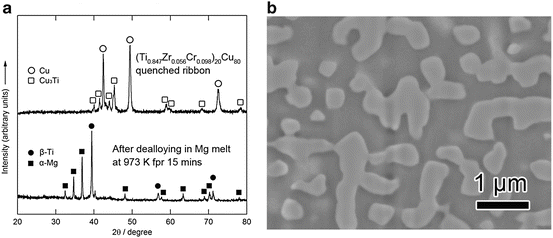
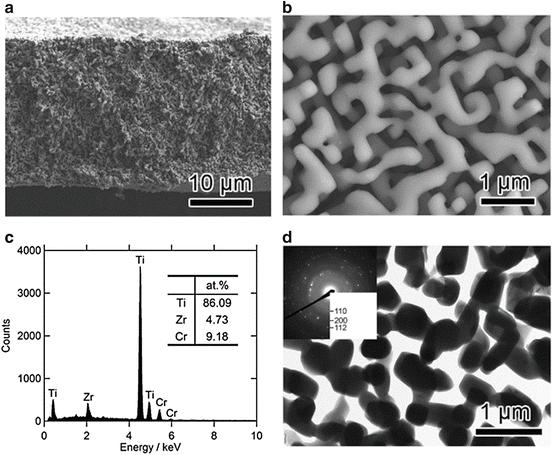
Fig. 8.11
XRD patterns of (Ti0.847Zr0.055Cr0.098)20Cu80 (at%), as melt spun (top) and dealloyed in a Mg melt at 973 K for 15 min (bottom) (a), and SEM image of the polished surface of the dealloyed sample (b) (Reprinted from Ref. [9], Copyright 2011, with permission from Elsevier)
Fig. 8.12


SEM image of the fracture surface of the porous β-Ti alloy (low magnification (a) and high magnification (b)), EDX spectrum obtained from the surface (c), and TEM image of the porous β-Ti alloy together with the electron diffraction pattern in the inset (d) (Reprinted from Ref. [9], Copyright 2011, with permission from Elsevier)
Stay updated, free articles. Join our Telegram channel
Full access? Get Clinical Tree
