Definite—One primary, two secondary, or one secondary plus two tertiary features
Probable—One secondary, plus one tertiary or three tertiary features
Suspect—One secondary, or two tertiary features
Primary features
Facial angiofibromasa
Multiple ungual fibromasa
Cortical tuber (histologically confirmed)
Subependymal nodule or giant cell astrocytomas (histologically confirmed)
Multiple calcified subchondral nodules protruding into the ventricle (radiographic evidence)
Multiple retinal astrocytomasa
Secondary features
Affected first-degree relative
Cardiac rhabdomyolysis (radiographic or histologic confirmation)
Other retinal hamartoma or achromic patcha
Cerebral tubers (radiographic confirmation)
Noncalcified subependymal nodules (radiographically confirmed)
Shagreen patcha
Forehead plaquea
Pulmonary lymphangiomyomatosis (histologic confirmation)
Renal angiolipoma (radiographic or histologic confirmation)
Renal cysts (histologic confirmation)
Tertiary features
Hypomelanotic maculesa
“Confetti” skin lesionsa
Renal cysts (radiographic evidence)
Randomly distributed in a multiparous in the deciduous and/or permanent teeth
Hamartomatous rectal polyps (histologic confirmation)
Bone cysts (radiographic evidence)
Pulmonary lymphangiomyomatosis (radiographic evidence)
Cerebral white matter “migration tracts” or heterotopias (radiographic evidence)
Gingival fibromasa
Hamartoma of other organs (histologic confirmation)
Infantile spasms
Incidence and Prevalence
SEGAs (subependymal giant cell tumors) typically occur in the first or second decade of life, predominately, yet not exclusively in patients with TS (tuberous sclerosis). Reports of neo- and prenatal diagnoses illustrate the developmental nature of these tumors [2–5]. Most SEGAs are related to tuberous sclerosis, occurring in approximately 1 per 5,000–10,000 births [6]. Although most SEGAs are associated with TS, the incidence of SEGA is only 5–10 % among patients with TS [7]. A small portion of SEGAs occur without clinical or genetic evidence of TS, or as “forme fruste” of the disorder displaying some characteristics [8]. Tuberous sclerosis occurs across all ethnicities and in both male and female, worldwide estimates are of 1–2 million affected individuals [6].
Genetics and Oncogenesis
Tuberous sclerosis is an autosomal dominant genetic disorder with high penetrance and variable expressivity. The majority of cases are due to de novo mutations, although inherited somatic mutations and gonadal mosaicism may also occur [9]. Somatic mosaicism may result in limited expression of TS. In cases of both spontaneous mutation and gonadal or somatic mosaicism, parental genetic testing may be normal. In cases of gonadal mosaicism, the possibility of transmission to future offspring remains, albeit at an unquantifiable rate. A variety of mutations of within two genes have been identified, TSC1 (chromosome 9) and TSC2 (chromosome 16), both effectors of the mTOR (mechanistic Target of Rapamycin) pathway. Identified aberrations, including mutation and deletion, lead to loss or attenuation of function. Sporadic SEGAs occurring without clinical or genetic evidence of TSC (tuberous sclerosis complex) may be due to dual somatic mutations of TSC1 or TSC2 [10, 11].
The TOR complexes influence many aspects of eukaryote physiology—largely via growth regulation, cell growth, proliferation, and survival (Fig. 10.1) [12]. The mTOR signaling pathway detects and integrates a variety of environmental conditions to regulate growth and homeostasis. Aberrations of the mTOR pathway have been implicated in a wide array of pathological processes including oncogenesis, obesity, type II diabetes, and neurodegenerative conditions. mTOR has been identified as an atypical serinine/threonine protein kinase belonging to the phosphoinositide 3-kinase (PI3K)-related kinase family. Interacting with other proteins, mTOR forms two complexes: mTOR complex 1 (mTORC1) and mTOR complex 2 (mTORC2). These complexes each have independent effectors and effects, as well as differing sensitivities to rapamycin and its analogs [13].
Fig. 10.1
Overview of mTOR1 and mTOR2 interactions and effectors.
TSC1 (hamartin) and TSC2 (tuberin) form a heterodimer that is a key upstream regulator of mTORC1, functioning as a guanosine triphosphate (GTPase)-activating protein (GAP) for Ras homolog enriched in the brain (Rheb) (Fig. 10.2). The GTP-bound form of Rheb interacts directly with mTORC1, significantly enhancing its kinase activity [13]. TSC1/2 as a Rheb GTPase-activating protein negatively regulates mTORC1 by converting Rheb to its inactive GDP-bound state [14]. TSC1/2 integrates multiple upstream signals that attenuate mTORC1 including growth factors via PI3k and Ras pathways. The effector kinases of these pathways (Akt/PKB, ERK1/2, RSK1) directly phosphorylate the TSC1/2 dimer to inactivate it, resultantly activating mTORC1 [15]. Cytokines, such as TNFα, may also activate TORC1 by phosphorylation of TSC1/2 via Iκβ kinase β (IKKβ) [16]. The Wnt pathway, a regulator of diverse cellular processes including differentiation, proliferation, and polarity, also modulates mTOR. By inhibiting glycogen synthase kinase 3b, phosphorylation of TSC2 is reduced leading to activation of mTORC1 [17].
Fig. 10.2
TSC1/2 complex interactions via a Rheb GTPase mediator leading to mTORC1 activation.
Hypoxia, mediated via transcriptional regulation of DNA damage response 1 (REDD1), activates TSC2 function [18]. mTORC1 is activated by DNA damage through a p53-mediated mechanism. The induction of TSC2 and Pten results in downregulation of PI3K-mTORC1 [19], and also, through induction of Sestrin1/2, activates AMPK [20]. Phosphatidic acid also activates mTORC1 [21].
mTORC1 may also be activated by amino acids (leucine and arginine), which are also required for activation of mTORC1 by some growth factors [22]. The mechanism of mTORC1 activation remains poorly understood, although it has been shown to involve the Rag GTPases and translocation of mTORC1 to the lysosomal surface [23].
Cellular processes regulated by mTORC1 include protein synthesis, lipid synthesis, energy metabolism, cell fate determination, autophagy, and cytoskeletal organization [13]. The role of the mTOR pathway in oncogenesis is evinced by mutations identified in human cancers and cancer syndromes. The loss of p53, a common observation in human cancers, promotes mTORC1 activation. Upstream from mTORC1 and mTORC2, components of the PI3K pathway are also often mutated in human tumors. Several human cancer syndromes, including TS and neurofibromatosis type I, are defined by mutations in upstream signaling components of mTOR complexes. Dysregulation of translation and protein synthesis downstream of mTORC1 by interaction with initiation factor 4E-binding proteins (4E-BP1/eIF4E) likely plays a significant role in tumorigenesis by promoting cell cycle progression [24]. Another hallmark of proliferating cancer cells, lipid synthesis is regulated by mTOR-PI3K activation of the lipogenic factor SREBP1, which requires mTORC1 signaling [25].
A complex, TSC1-TSC2 (hamartin-tuberin), via GTPase-activating protein acts as a negative regulator of mTORC1, a controller of anabolic processes. Multiple factors and cellular signaling pathways are integrated, leading to phosphorylation events, and resultantly mTORC1 activity [26]. Dysregulated mTOR activity subsequently results in abnormal cellular division and differentiation across tissue types and abnormal cellular enlargement is seen, as is the case in SEGAs.
Clinical Presentation
SEGAs usually present with signs and symptoms of cerebrospinal fluid obstruction due to the encroachment of the foramen of Monro either uni- or bilaterally. The onset of symptoms is usually insidious, with progressive headache, cognitive impairment, lethargy and finally, if unrecognized, coma and death. Occasionally, precipitous neurological decline or death due to acute hydrocephalus or intratumoral hemorrhage may occur [27–31]. Clinical history and findings suggestive of tuberous sclerosis may be present; epilepsy and other systemic manifestations may also lead to the diagnosis. SEGAs usually become symptomatic within the first two decades of life.
The diagnosis of TSC is based on clinical examination and confirmed with genetic testing. Cutaneous findings include hypomelanotic macules, facial angiofibromas, and shagreen patches. Oral lesions may include ungula or gingival fibromas. The three hallmark pathologies of TSC in the central nervous system (CNS) are cortical tubers, subependymal nodules, and SEGAs. Functional impairment of effected individuals may be due to seizures, intellectual disability, and/or developmental delay. Renal manifestation may include angiomyolipomas (AML), cysts, and renal cell carcinoma. Cardiac conditions, including rhabdomyoma and arrhythmias may be present. Pulmonary involvement is restricted to lymphangioleiomyomatosis (LAM). Consensus clinical diagnostic criteria (Table 10.1) were developed prior to reliable genetic testing and allow for stratification as definite, probable, or suspect TSC [32]. Patients with somatic TSC2 mutations, as a group, are most severely affected. Somatic mutations of TSC1 are less affected [33]. Patients with genetic mosaicism may have localized, minimal, or no clinical evidence of TSC.
Radiographic Characteristics
Location is of primary consideration in the radiologic suspicion of SEGA. Given that the vast majority of these tumors arise within the lateral ventricle in the caudothalamic groove, medial to the posterior caudate nucleus, SEGA should be strongly considered in the differential diagnosis of tumors in this region [34]. Growth on serial neuroimaging differentiates SEGAs from subependymal nodules. The radiologic identification of SEGA may be made on ultrasound (in neonates, and rarely prenates), computed tomography (CT), and magnetic resonance imaging (MRI) [4, 35] (Figs. 10.3 and 10.4).
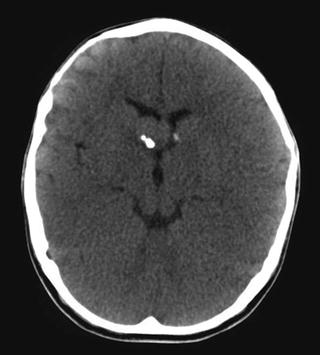
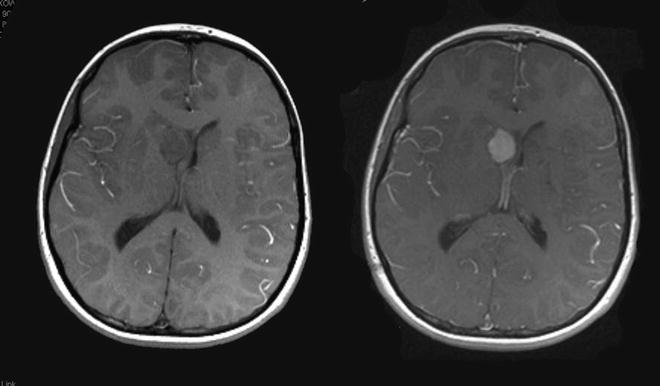
Fig. 10.3
Noncontrast CT scan, 3-year-old with TSC2 mutation. A SEGA is seen on the right, note calcification at the thalamocaudate groove.
Fig. 10.4
Pre- and postgadolinium T1-weighted axial MRI, 9-year-old with TSC1 mutation. A SEGA is seen on the right, dense contrast enhancement is seen.
CT may show uni- or bilateral hyper-dense foci of calcification medial to the genu of the internal capsule (Fig. 10.3). In cases associated with TS, multiple calcifications and subependymal nodules (candle guttering) may be seen along the caudothalamic groove [36]. Ventriculomegaly may be identified unilaterally or bilaterally [37].
MRI characteristics mirror the heterogeneous pathology of SEGAs, with mixed signal intensities on T1- and T2-weighted imaging. SEGAs are usually hypo- and isointense on T1-weighted imaging, and iso- to hyperintense on T2-weighted imaging. Dense contrast enhancement is usually present, although it may occur in a heterogeneous pattern [38]. Calcified portions of the tumor, usually near the base of the tumor, typically appear hypodense on T2-weighted imaging (Fig. 10.4).
Pathology
The origin of almost all SEGAs is the wall of the lateral ventricle, from the region of the posterior caudate/basal ganglia, just medial to the genu of the internal capsule with projection into the frontal horn or body of the lateral ventricle. A focus of dense calcification is often present at the base of the tumor. They are well circumscribed, lobulated, angiomatous, and slow growing. Tumor-related cysts may be present. Malignant transformation is uncommon [39]. SEGAs in other locations have been reported, including the cerebral cortex [40], pineal region [41], and retina [42–44].
Histologically, SEGAs may display a wide range of astrocytic, glial, and neuronal differentiation. Three cell types predominate: small spindle cells, gemistocytic astrocytes, and giant cell with ganglionic features (Fig. 10.5). Mitotic index is usually low and necrosis is an uncommon finding. Nucleoli are usually distinct in all of the cell types and a finely granular chromatin pattern is common. SEGAs may display features associated with malignant potential, pleomorphism, mitotic figures, necrosis, and vascularity; however, true malignant behavior is exceedingly rare [39, 45]. (Table 10.2).
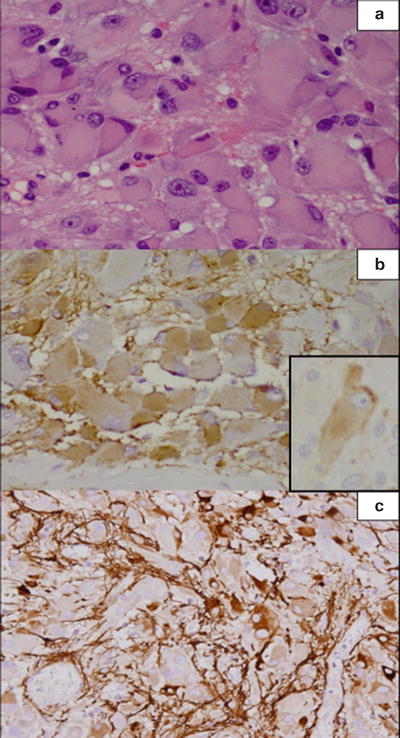
Fig. 10.5
Subependymal giant cell astrocytoma shows large mostly polygonal cells with abundant cytoplasm and often vesicular eccentric nucleus with prominent nucleolus (a). The tumor cells share features of glial cells and are immunoreactive for glial fibrillary acidic protein (b, c) but also have neuronal features and are immunopositive for synaptophysin (inset).
Table 10.2
Pathology of subependymal giant cell tumors.
Histology |
Low mitotic index |
Necrosis uncommon |
Calcifications common |
Differentiation all multiple lineages—astrocytic, glial, and neuronal |
Cell types—gemistocytic astrocytes and giant cell with ganglionic features |
Immunohistochemistry |
S-100 and GFAP variably reactive |
Neuronal markers—neurofilament, MAP2, class III Beta tubulin |
Neurosecretory substances (serotonin, Beta endorphin, somatostatin) |
Immunohistochemical staining is variably reactive for S-100 and GFAP—a reflection of the mixed astrocytic/glial composition and heterogeneity of the tumor. Neuronal markers including cytoskeletal components (neurofilaments, MAP2, class III Beta tubulin) and neurosecretory substances (serotonin, Beta endorphin, somatostatin) may also be positive [46]. The presence of both glial and neuronal markers within tumor cells supports the possibility that the originating cells of SEGAs have the potential to differentiate along glioneuronal in addition to neuroendocrine lineage, and to a greater degree than other mixed glioneuronal neoplasms [46]. Reported occurrence of SEGAs in the retina [42–44], with Mueller cell origin capable of dedifferentiation into pluripotent progenitor cell as their putative source, illustrates the potential mechanism of a common progenitor producing multiple cell types.
Treatment Options
The optimal treatment of SEGAs and other TSC-related conditions is an area of intense basic, translational, and clinical research. Recognition of the benign nature of these tumors, along with the potential for long life-expectancy mandates that treatment strategies not only result in long-term disease-free or progression-free survival, but also consider potential long-term complications and cost [47].
Observation
Surgery
Various approaches for resection of SEGAs including craniotomy by transcallosal and transcortical approaches have been the reported. Early operative case series noted significant morbidity and mortality [51–53]. Contemporary series, however, with the aid of microdissection, stereotactic techniques, and modern pediatric neuroanesthetic techniques have significantly improved upon the results of these historical benchmarks [54]. A high rate of gross total resection, with little or no permanent neurological morbidity, can be expected at high-volume surgery centers [55–57]. Tumor recurrence after radiographically confirmed gross or radical subtotal resection is infrequent.
The preferred surgical approach depends upon a number of factors, ventricular size, prior surgery, and surgeon experience. Generally, smaller ventricular size favors a transcallosal approach. Significant ventriculomegally and the presence of an existing frontal resection cavity (i.e., from cortical tuber resection) may favor a transcortical approach. Additionally, success of a purely endoscopic approach via a single frontal burr hole has been reported and may be appropriate for some SEGAs [58].
Medical Therapy
SEGAs are slow-growing tumors with low, if any, potential for malignant transformation [39, 59, 60]. Conventional cytotoxic compounds do not have a role in their treatment. However, targeted medical therapy directed specifically at the implicated signal transduction pathways has emerged as a potentially effective and safe strategy to control SEGAs and other manifestations of TS. Progress in this area was initiated literally with the unearthing of rapamycin.
The discovery of the macrolide compound rapamycin began with a “bioprospecting” expedition to Easter Island (“Rapa Nui” in the native language). A soil sample obtained from the site included the bacterium Streptomyces hygroscopicus, from which a secondary metabolite with strong antiproliferative properties was obtained—rapamycin [61]. Eventually, the antifungal properties of rapamycin led to the discovery of its molecular targets—TOR1 and TOR2. Acting to suppress T-function, rapamycin was used in post-transplant patients as an immunosuppressant.
The mechanism of rapamycin and related compounds, known as rapalogs, upon the mTOR pathway is complicated; however, it is known to form a gain-of-function complex with FKBP12, a 12-kDa intracellular protein. This rapamycin-FKBP12 complex inhibits mTOR as component of mTORC1—although the molecular mechanism of this inhibition has not been elucidated. Current theories include impaired structural integrity of mTORC1 [62] and allosteric reduction of the complex’s kinase domain activity [63].
The first rapalog approved in the USA was Temsirolimus for advanced renal cell carcinoma. In 2012 Everolimus was approved by the Food and Drug Administration for the treatment of pediatric and adult patients with TSC who have SEGA that requires therapeutic intervention but cannot be curatively resected [12]. Case reports, clinical series and clinical trials, including a multicenter, placebo-controlled trial [64–68], have demonstrated ≥50 % volumetric reduction of SEGAs among treated patients. Notably, some trials have also demonstrated a meaningful reduction in seizure frequency during treatment [67, 69]. Common side effects include stomatitis, oral ulceration, and impaired wound healing [66, 70]. Metabolic side effects include hypercholesterolemia, hyperlipidemia, and hyperglycemia [71].
Stay updated, free articles. Join our Telegram channel

Full access? Get Clinical Tree


