Fig. 3.1
Examples of FISH applications in molecular neuropathology: (a–c) 1p evaluation, 1p red, 1q green: (a) Maintenance of 1p (2:2 signals), (b) 1p loss (1:2 signals), (c) relative deletions/superloss (4:6). (d, e) RTK genes evaluation: (d) high level amplification of EGFR (red: EGFR, blue: CEP7), (e) mosaic heterogeneity with mutually exclusive amplifications of EGFR (red), PDGFRA (green), and MET (yellow) in subclones within a GBM. All panels: nuclei are counterstained with DAPI.
Gene amplification testing is most commonly applied for EGFR, although the other two most commonly amplified receptor tyrosine kinase (RTK) genes platelet-derived growth factor receptor alpha (PDGFRA) and mesenchymal–epithelial transition factor (MET) RTK gene are gaining increasing attention, partly due to the increasing clinical availability of kinase inhibitors against these targets [5]. Also, while EGFR amplification is generally limited to adult GBMs, PDGFRA amplification is common in lower grade and pediatric gliomas [6]. Typically, RTK gene amplifications involve the majority of cells within a given tumor and with high levels of amplification. However, tumors with scattered amplified cells, which represent a minority of the tumor, are also encountered in clinical practice. This phenomenon is most commonly observed in MET-amplified GBMs, where cells with amplification can be rare and scattered throughout the tumor. Another recently described phenomenon is mosaic heterogeneity, where tumors are composed of subclones with mutually exclusive amplification of RTK genes [7–9]. Up to three coexisting subclones with amplifications of EGFR, MET, and PDGFRA within a single tumor have been described. More importantly, these studies have shown that during glioma progression, subclones have different propensities to infiltrate normal brain and genomic changes can vary widely among different parts of the same tumor [7]. In addition, studies have also shown that some GBM cells contain simultaneous amplification of different RTK genes. Although the significance of these findings is not clear, they emphasize the complexity of the disease and raise several challenging implications for molecular pathology and clinical practice. This also raises an important practical question: whether the molecular analysis should be focused on a single target or multiplexed, i.e., analyzing several targets, or even the whole genome. This issue is also discussed in the section on array comparative genomic hybridization (aCGH) below. While specific criteria may differ among laboratories, it is reasonable to suggest that the presence of any subpopulation with gene amplification should be reported. Lastly, FISH can be used to evaluate for translocations. The most typical indication would be for EWS gene rearrangement in small, round blue cell tumors when Ewing’s sarcoma/peripheral primitive neuroectodermal tumor (PNET) is in the differential.
The 1p/19q analysis can be performed by several techniques, most commonly by FISH, single nucleotide polymorphism (SNP) array, or PCR-based microsatellite LOH. However, FISH is the most commonly used assay and offers additional prognostic information compared to PCR LOH. Fluorescent test probes are commercially available and hybridize to so-called minimally deleted regions [10, 11]. The test probe localizes to 1p36 and a control/reference probe localizes on the opposite arm to 1q25. Target and control/reference probes for chromosome 19 localize to 19q13 and 19p13, respectively. One FFPE section cut at 4–5 μm is used for each chromosome. A few caveats apply for FISH 1p/19q. A normal copy-number LOH resulting from mitotic recombination would not be detected by FISH and could in theory result in false negatives [12]; however, this would be rare in 1p/19q co-deleted oligodendroglioma. More importantly, FISH cannot assess multiple markers to cover the entire arm of the chromosome. Therefore the observed loss might only represent a relatively small “probe-size” deletion on 1p or 19q. However, only the whole arm deletions are truly associated with a favorable prognosis. While the result would be read as positive technically, biologically this would represent a false-positive finding. Many tumors with these minimal deletions are in fact astrocytomas, rather than oligodendrogliomas, and are actually associated with a worse prognosis. GBMs in particular contain these minimal deletions, and a misdiagnosis of GBM with oligodendroglial component could be made based on a biologically false-positive finding. To avoid this pitfall, some laboratories avoid commercially available probes and choose home-brewed probes on 1p32 and 19q13.4, which are outside the minimal regions of deletion. Although the sensitivity is decreased, this strategy increases specificity of the assay.
The size of FISH probes, ~1 Mb, and staining with either a green or orange/red spectrum fluorescent dye, allows localization against the DAPI counterstained nucleus. As discussed above, four main patterns can be recognized: maintenance of 1p and 19q with two control probes and two target probes, absolute deletion with two control probes and one target probe, polysomy with several copies of target and control regions, and polysomy with deletion of target regions. This pattern known also as relative loss or superloss consists of four control signals and two target signals, for example. However, the ratio of signals can vary and show rations such as 6:3 or 8:4.
Multiple studies have confirmed high reproducibility between SNP/LOH analysis and FISH [13]. While SNP/LOH analysis has an advantage of analyzing multiple markers on chromosomal arms, FISH offers the ability of evaluating the tumor in situ, with small biopsies and without patient’s matched normal blood. With growing evidence of implications of polysomy, FISH seems to offer additional prognostic value compared to PCR LOH. There is a strong association between histology and 1p/19q loss. Tumors with classic oligodendroglial features have a higher likelihood of 1p/19q codeletion [14, 15]. It is important to keep in mind that there is no need to select the most oligo-like area when choosing the best section for 1p/19q analysis. It seems that 1p19q codeletion is a very early event in the tumor development, and therefore is present in both oligodendroglial and astrocytic components of an oligoastrocytoma. Another interesting association exists between tumor site and genetics, with frontal oligodendrogliomas having a significantly higher likelihood of 1p/19q loss than temporal lobe tumors [3].
Array Comparative Genomic Hybridization
DNA arrays provide a whole genome analysis of copy number changes. Many arrays offer both copy-number variant and SNP content for LOH analysis in a single array. Genomic DNA can be isolated from FFPE tissue after deparaffinization and protease digestion. A normal male/female DNA standard is usually used for comparison. However, the patient’s germline DNA from the peripheral blood can also be utilized. This is particularly useful for SNP analysis. The cancer arrays usually contain a high-resolution backbone with an average spacing approximately one oligo probe every 25–50 kb, which ideally avoid regions containing common copy-number variants (CNV) to minimize detection of benign CNVs. The probe density is usually higher: one every 5 kb in regions defined by International Standards of Cytogenomics Arrays (ISCA). Furthermore, some arrays contain an increased density of probes in known cancer-related genes with up to a single exon resolution, where the density of the probes can be up to one probe every 50 bp. This is particularly useful for genes with known specific deletions, duplications or mutations in cancer. One must keep in mind that although aCGH is a genome-wide technique, the distribution of probes highly depends on the purpose of the array. The design is specific for each clinical indication, and therefore laboratories performing aCGH testing for different clinical questions cannot use the same array for all of them. Although the backbones might be the same or very similar, DNA coverage distribution with highest probe density are significantly different based on whether the array was designed for autism, epilepsy, or cancer, for example.
While a simple PCR LOH does not provide a significant advantage, the aCGH + SNP arrays offer several advantages compared to FISH. The aCGH + SNP provides a whole genome view of the DNA (Fig. 3.2). The same reaction can be performed for all gliomas in the laboratory, regardless whether the diagnosis is GBM or oligodendroglioma, which decreases costs necessary for storing, optimizing, and running several different FISH probes. For example, in a small cell GBM variant where three separate FISH reactions, 1p, 19q, and EGFR, are needed, a single array can provide a definitive answer. In medulloblastoma, aCGH can be utilized for the subgroup classification since different subgroups carry characteristic chromosomal changes. In addition, the array provides information about other genomic changes in brain tumors such as PTEN, CDKN2A/p16, PDGFRA, NF1, and MET, which are not routinely tested. This information, while not utilized in current clinical care, will increasingly play a role for design of molecularly driven studies, including clinical trials. For example, clinical outcome predictions can be made by evaluating several loci of DNA rearrangements in medulloblastomas, where a number of FISH reactions could be replaced by a single aCGH [16]. If all potential targets are to be tested by FISH, the costs and labor intensity would be significantly higher than a single aCGH + SNP array. An additional advantage is the interpretation software which allows quick review of genomic changes and automated variant call. The software allows manually adjusting levels at which variants can be called and minimizes the possibility of false negatives. While the genome still has to be reviewed manually, the amount of time spent analyzing the array data seems to be equal or shorter in comparison with 1p/19q analysis, which is clearly the most labor-intensive assay in regard to data evaluation. A disadvantage of aCGH technique in comparison with FISH is that it might not be able to detect changes if only scattered infiltrating cells are present in the tissue [7] and might be challenging with small biopsies since approximately 1.5 μg of DNA is needed.
Fig. 3.2
Example of aCGH result in molecular neuropathology: view at chromosome 17 in a medulloblastoma shows a deletion of the short arm of the chromosome 17. This loss occurs in ~25–50 % of medulloblastoma. 17p loss has been associated with a poor survival in some studies suggesting that loss of a tumor suppressor gene located on 17p plays a role in the genesis or progression of medulloblastoma. A novel candidate gene, CTD nuclear envelope phosphatase 1 (CTDNEP1), was identified as a recurrent target of mutation in Group 3 and Group 4 medulloblastomas. CTDNEP1 is located on chromosome 17p13.1 in a hotspot of deletion and LOH.
Mutation Analysis
Mutation-Specific Antibodies
Until recently, the only way to analyze point mutations was by Sanger sequencing. A truly revolutionary event was the introduction of mutation-specific IDH1 R132H antibody into clinical practice. That was quickly followed by a novel BRAF V600E mutation-specific antibody [17–20]. The advantage of using a mutation-specific antibody is undisputable. The staining can be performed in a clinical immunohistochemistry laboratory on FFPE on standard 5 μm sections (Fig. 3.3). Provided the antibody is robust and validated as being highly sensitive and specific, detection is fast, inexpensive, reliable, and allows identification of single infiltrating tumor cells. In comparison with rather nonspecific antibodies such as p53, the mutant protein is not expected to be present in any reactive or inflammatory conditions that may lead to overexpression of nonspecific markers. As a consequence, tumor mutation-specific antibodies are of great value in distinguishing not only reactive astrocytes from tumor cells but also oligodendroglioma/oligoastrocytoma from their morphological mimickers [21]. Although there is strong correlation between IDH1 mutation and 1p/19q loss, the 1p/19q testing cannot be replaced by IDH1 antibody and several caveats must be noted. For IDH1, the antibody detects only one of several known mutations. While R132H is the most common mutation and represents ~90 % of IDH1 mutations, other mutations at that site will not be detected by the antibody. Furthermore, mutations of IDH2 at the residue R172 can also be found in gliomas, although rarely [22]. The R172 residue in IDH2 is the exact analogue of the R132 residue in IDH1. The residue is located in the active site of the enzyme and forms hydrogen bonds with the isocitrate substrate [23]. Therefore, IDH1 and IDH2 sequencing provides a definitive answer in IDH1 R132H antibody-negative tumors.
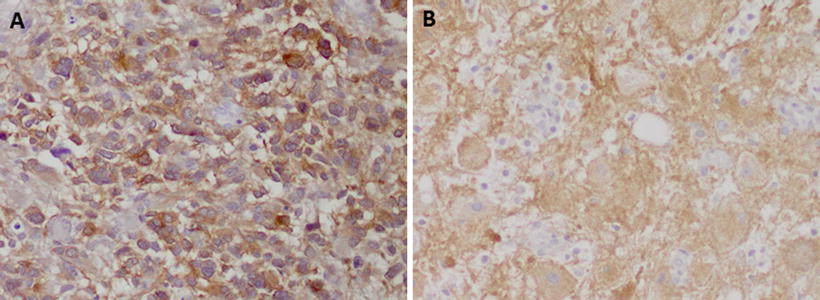
Fig. 3.3
Examples of utility of mutation specific antibodies in neuropathology: the immunohistochemistry with a specific antibody against (a) IDH1 R132H in a case of a diffuse astrocytoma and (b) BRAF V600E in a cerebellar ganglioglioma shows strong immunoreactivity specific for tumor cells. Reactive cells in the background are negative (b)
BRAF V600E antibody can be used for the same purpose. However, it is most useful in supratentorial tumors. Although BRAF alterations in pilocytic astrocytoma of the cerebellum are common, they are usually due to a tandem repeat producing a fusion BRAF:KIAA1549 gene [24, 25], which would not be detected by the antibody. BRAF V600E is present in supratentorial pilocytic astrocytoma and pilomyxoid astrocytoma, pleomorphic xanthoastrocytoma (PXA), ganglioglioma and dysembryoplastic neuroepithelial tumor [26]. The antibody could be particularly useful in distinguishing between a PXA and a GBM on a small biopsy, since BRAF V600E mutation would be highly unusual in a GBM, but they are common in PXA [27].
Another example of a clinically important antibody detecting a molecular aberration is INI1. The loss of protein expression in an embryonal brain tumor is virtually diagnostic of atypical teratoid-rhabdoid tumor (AT/RT), a highly aggressive neoplasm of early childhood. Immunohistochemistry for INI1 should be performed on every medulloblastoma or primitive embryonal tumor in childhood to avoid misdiagnosis of the AT/RT [28].
Sequencing
Until recently, Sanger sequencing represented the most common way to investigate mutations in brain tumors. Considering that many genes commonly mutated in gliomas such as TP53 and NF1 are large and can be altered by several different mutations and the predictive value is unknown, sequencing played a minimal role in clinical laboratories for brain tumors. One of the relevant applications is IDH1 and IDH2 sequencing for tumors negative for IDH1 R132H by immunohistochemistry, when the suspicion for less common mutations is high based on clinical presentation. NGS methods are still mostly used in research. However, they are being adopted by clinical laboratories, usually as focused cancer gene panels (Fig. 3.4). As the cost of sequencing continues to decline, and the methods themselves including data analysis become easier to manage in the clinical setting, they will likely become increasingly available for routine use. In the future, NGS will most likely cover tens to hundreds of cancer-specific genes. However it is only the matter of time before the whole exome or whole genome sequencing cost will not be that much different from a focused panel. Additionally, whole exome/genome sequencing will allow identification of gene rearrangements, which were previously unappreciated phenomena in gliomas [29].
Fig. 3.4
Example of the next-generation sequencing in molecular neuropathology: in oligodendroglioma, whole genome sequencing (Illumina platform) identifies mutation in the IDH1 (c. 395 C > T, p.R132H) gene. The majority of IDH1 mutations in gliomas are p.R132H. The example shown is in the form of the IGV browser view (Courtesy of Dr. Stephen Yip, BC Cancer Agency)
MGMT Testing
MGMT promoter methylation has been confirmed by several clinical studies as a biomarker in patients with gliomas. The MGMT gene is located on chromosome l0q26.34 and contains five exons, the first of which is noncoding. Transcription of the MGMT gene is initiated at a single site within a GC-rich, non-TATA box-containing promoter. Expression of the MGMT gene is epigenetically regulated by methylation-dependent silencing.
Stay updated, free articles. Join our Telegram channel

Full access? Get Clinical Tree


