(1)
Faculty of Life Sciences, Bar-Ilan University, Ramat-Gan, Israel
Keywords
Oxygen supply and NADHHypercapnia and hypocapniaBrain stimulationCortical spreading depressionEpilepsy and NADHHyperoxiaCarbon monoxideNADH and drugs7.1 Introduction
In Chap. 2, the basic concepts of tissue energy metabolism were presented. In this chapter (Chap. 7), the effects of various experimental perturbations, in animal models, on the redox state of NADH and other parameters are described in detail. The foundations for the use of NADH fluorescence as a marker of mitochondrial activity were presented in detail by Chance and Williams [1, 2] for isolated mitochondria in vitro (see Fig. 3.1). The “resting” state of the mitochondria in vitro was defined as “state 4,” where NADH was 99 % in the reduced form, and ADP was the rate-limiting substance. If ADP is added to a suspension of mitochondria, ATP synthesis will be stimulated, oxygen consumption will increase, and the rate-limiting factor will be the activity of the respiratory chain. During this state 3, or the “active state,” the NADH redox state will decrease or become more oxidized (about 50 %). When the “resting” mitochondria are deprived of oxygen, the activity of the mitochondria will stop and NADH will reach its maximum redox state (state 5).
A definitive description of the mitochondrial metabolic state has never been given for in vivo conditions. Therefore, we described the in vivo mitochondria conditions as recorded by NADH fluorescence in a representative tissue or organ, the brain. Although the range between minimal NADH (~0) and its maximal level was determined in vitro, it is almost impossible to determine in the intact brain or other organs in vivo. For example, state 2, with a substrate-free medium, could not be achieved in vivo because the tissue would cease activity and die. On the other hand, the maximal level of NADH (state 5) could be monitored in vivo under complete deprivation of oxygen by anoxia or complete ischemia.
We used changes in NADH levels monitored in vivo to create a new scale ranging from a maximal definite point to the minimal level recorded in vivo. Details of this approach have been published [3] and are discussed in the last section of this chapter. It is important to note that most of the published data on NADH monitoring have been accumulated in brain studies. Therefore, we present our data mainly relating to the brain, although results on other organs are presented as well (in Chap. 8). Here, we divided the list of published materials as follows: Table 7.1 lists all studies published by Avraham Mayevsky and his collaborators; the papers are classified according to the organ monitored and, for the brain, the type of perturbation used is shown. Table 7.2 lists papers, published by other groups, regarding monitoring the brain exposed to the various perturbations as shown in Table 7.1. Table 7.3 presents published material by other investigators on other organs wherein NADH was monitored and exposed to various perturbations.
Table 7.1
Classification of the various publications on NADH monitoring published by Mayevsky et al. (1972–2014)
Organ | References |
|---|---|
Review articles | |
Liver | |
Small intestine | |
Kidney | |
Testis | |
Urethra | |
Heart | |
Spinal cord | |
Brain monitoring | |
Hypothermia | |
Changes in intracranial pressure (ICP) Brain injury | |
Hemorrhage | |
Ischemia | |
Anoxia + hypoxia | |
Hypercapnia | |
Drugs including anesthetics | |
NO (nitric oxide) | |
CO (carbon monoxide) | |
Clinical research | |
Normobaric hyperoxia | |
Hyperbaric hyperoxia | |
Newborn and aging | |
Epilepsy | |
Cortical spreading depression (CSD) | |
Table 7.2
Papers showing effects of perturbations on brain NADH published by various investigators (not including Mayevsky et al.)
Anoxia | |
Hypoxia | |
Ischemia | |
Normobaric and hyperbaric hyperoxia | |
Hypo and Hypercapnia | |
CO (carbon monoxide) | [79] |
Direct cortical stimulation | |
Epilepsy | |
Cortical spreading depression (CSD) | |
Pharmacological agents including anesthetics | |
NO (nitric oxide) | [463] |
Hemorrhage | |
Effects of animal age | |
Hypothermia | |
Changes in ICP and brain injury |
Table 7.3
Effect of O2 delivery on NADH redox state measured in various intact organs by various investigators (not including Mayevsky et al.)
Anoxia–hypoxia | Drugs | Ischemia | Tissue activation | |
|---|---|---|---|---|
Heart | ||||
Liver | ||||
Kidney | ||||
Skeletal muscle | ||||
GI tract | [748] | |||
Spinal cord and PNS | ||||
General reviews |
7.2 Perturbation of Oxygen Supply In Vivo
7.2.1 Introduction
As described by Chance and Williams [1, 4], the complete depletion of O2 from the mitochondria inhibits oxidative phosphorylation and terminates ATP production. This situation destroys the normal function of the tissue, and cell death can ensue. In this book, we define anoxia as a complete deprivation of O2 caused by breathing 100 % N2. Hypoxia implies that the deprivation of O2 from the breathing mixture is partial and ranges between 21 % (normal air) and 0 % (anoxia). Ischemia is defined as a decrease in O2 supply caused by a decrease in blood flow to the monitored organ. The degree of ischemia can vary from a full absence of flow (complete ischemia) to various levels of blood flow (partial ischemia). Although oxygen deficiency is the main event in each of the three experimental conditions (anoxia, hypoxia, and ischemia), other physiological factors may differ. For example, microcirculatory blood flow is decreased under ischemia, but increases under brain hypoxia. Thus, changes in the tissue caused by other blood flow-related factors are not identical.
7.2.2 Anoxia and Hypoxia
The responses to hypoxia and anoxia are very similar; therefore, they are discussed together. According to the definition of Chance and Williams [1, 2], a shift toward state 5 involves an increase in NADH proportional to a decrease in O2 supply. Figure 7.1 demonstrates the response of the brain to hypoxia (a) and anoxia (b) published by Chance in the early days of NADH monitoring in vivo [5, 6]. In those days the fluorescence was measured and displayed without correction for hemodynamic artifacts, which was developed later in time. A clear increase in NADH fluorescence was recorded under the deprivation of oxygen. Similar responses of the brain and the kidney to anoxia are recorded in Fig. 7.1b.

Fig. 7.1
a Correlation between EEG and pyridine nucleotide reduction in the slow transition from aerobiosis to anoxia. Top trace includes measurements of inspired oxygen concentration according to the Pauling oximeter. (© Reprinted by permission from Macmillan Publishers Ltd [5].) b Simultaneous recordings of fluorescence changes in rat brain and rat kidney in a cycle of anoxia. Fluorescence increases are indicated in a downward direction. (© Prof. Britton Chance, reprinted with permission [6])
In 1972, when the UV-transmitting optical fibers became available, we applied the quartz fibers to the in vivo monitoring of NADH fluorescence in the brain. It was assumed that the response of NADH fluorescence to hypoxia or anoxia, induced in vivo, should be very similar to the response of isolated mitochondria that were investigated until those days. One of the early results is presented in Fig. 7.2. [7]. The rat was exposed to anoxia (100 % nitrogen), and as a result, the 450-nm fluorescence signal increased immediately, followed by cessation of spontaneous breathing (SB). At this stage, it was assumed that NADH level should be high and stable because of the lack of oxygen, but partial recovery of the fluorescence signal was noticed. This artifact was corrected by the subtraction of the 366-nm reflectance signal from the 450-nm fluorescence, and the corrected fluorescence was recorded. This correction improves the ability to correlate the changes in NADH with oxygen availability. During the anoxic episode the reflectance signal decreased significantly from the increase in blood volume as an autoregulatory response to the lack of oxygen. By exposing the rat to repetitive nitrogen cycles every 10 min, the response to anoxia (Fig. 7.2b) became significantly different as compared to the first cycle (Fig. 7.2a). The response of the reflectance signal that was minimal during the anoxic cycle led to the similarity between the uncorrected and corrected NADH fluorescence.

Fig. 7.2
a Typical response of rat brain and systemic blood pressure to a nitrogen cycle (#1/12). The corrected fluorescence trace is obtained by subtracting the reflectance change from the fluorescence change on a 1:1 basis. SB stop breathing, SN stop nitrogen, SBS start breathing spontaneously. b Typical response of rat brain and systemic blood pressure to a nitrogen cycle (#12/12). The corrected fluorescence trace is obtained by subtracting the reflectance change from the fluorescence change on a 1:1 basis. SB stop breathing, SN stop nitrogen, SBS start breathing spontaneously. (© Reprinted with kind permission of Springer Science + Business Media [7])
Figure 7.3 presents another interesting response of the brain to anoxia. NADH and the electrical activity of the brain were measured [8].

Fig. 7.3
Effects of anoxia on brain NADH fluorescence, 366-nm reflectance, EEG, and blood pressure. a Duration of anoxia was 70 s. b Duration of anoxia was 100 s. SB animal stopped breathing, SN stop nitrogen, AR short artificial respiration. (© Reprinted with permission from Elsevier [8])
In these experiments the rats were slightly anesthetized by Equithesin. Nitrogen was applied via a nasal mask. Figure 7.3a shows the effect of N2 on the NADH fluorescence, reflectance, EEG, and blood pressure. The top trace shows the reflectance which in all animals decreases during the N2 cycle. This decrease of reflectance was in two phases. The first decrease was small (in comparison to the second one) and occurred while the animal was breathing spontaneously. A second decrease occurred after the animal stopped breathing (SB). The recovery of the reflectance to the baseline occurred about 10 min after the rat started breathing again. The second trace from the top, the fluorescence, shows a large increase in NADH fluorescence during the first phase of the N2 cycle. To correct for hemodynamic artifacts induced by anoxia, we used the correction technique suggested by Jobsis et al. [9, 10] and Harbig et al. [11]. The reflectance signal at 366 nm was subtracted from the fluorescence signal at 450 nm at a 1:1 ratio. The difference between the fluorescence and reflectance signals is shown in the third trace, the ‘corrected’ fluorescence. After the cessation of respiration a large decrease in reflectance occurs; an apparent decrease in fluorescence (oxidation) is observed that is almost undetectable in the corrected trace. The small decrease shown in the corrected trace is caused by imperfection of the correction factor in this special animal. After the N2 administration had been discontinued (SN), artificial respiration (AR) was applied to induce spontaneous breathing. After the animal started breathing, a fast decrease of NADH was observed in the uncorrected fluorescence as well as in the corrected. The recovery of the NADH level to the baseline is very fast in comparison to the recovery of the reflectance. The EEG of both hemispheres reaches low amplitude when the NADH level reaches 80–90 % of the maximum increase during the N2 cycle. The response of the two hemispheres was identical. The recovery of the EEG follows the NADH recovery to the normoxic level. Figure 7.3b shows the response of the same animal to a longer N2 cycle. The animal was exposed to N2 for 100 s. The main differences between the two cycles are that after the recovery of the NADH to the normoxic level a further decrease in NADH occurred (third trace), and at this time the EEG was depressed and recovered to normal only later. This cycle of oxidation of NADH following the N2 cycle was observed in most animals after exposure to a long N2 cycle. The pattern of changes in reflectance, fluorescence, and the corrected traces were similar to those observed in the SD elicited by KCl (as shown also in Fig. 7.45).
To verify the technique of NADH fluorescence correction, we performed experiments in the isolated blood-free perfused brain [12].
As seen in Fig. 7.4, when the blood-free brain was exposed to the complete depletion of oxygen, the fluorescence (F) showed a clear increase–decrease cycle depending on the availability of O2. The reflectance trace (R) was not affected at all by the anoxic event shown in Fig. 7.4a. In the autoregulated blood-perfused organs, it is expected that the lack of O2 will trigger compensation mechanisms that may lead to an increase in the blood flow and volume or to a decrease in the R signal (Fig. 7.3a). The second event (Fig. 7.4b) demonstrates the spontaneously development of a spreading depression-like event as also demonstrated in Fig. 7.3b.
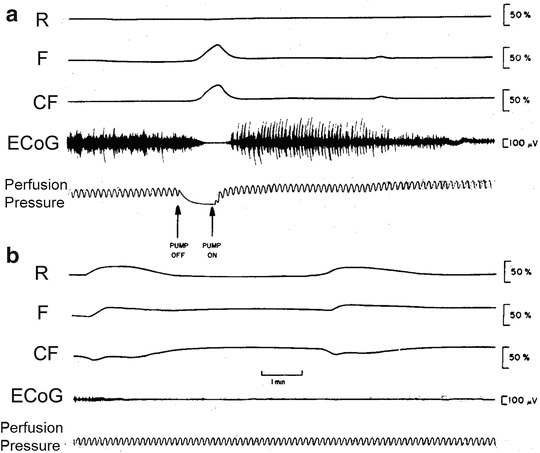
Fig. 7.4
Effects of a single anoxic episode on oxidation-reduction state of NADH and electrical activity in blood-free perfused rat brain (b is a continuation of a). Perfusion pressure was not calibrated and served as a qualitative parameter. (© Maney Publishing; reprinted with permission [12])
The mechanism of blood flow and volume under anoxia or hypoxia is not active in all tissues and therefore different responses of the R signal may be recorded in various organs.
Figure 7.5 shows the responses of a dog/puppy brain to graded hypoxia (a–c) as well as to brain anoxia (d) [13]. As is seen, the changes in the corrected fluorescence signals (CF), which represent the NADH redox state, were inversely correlated to the decrease in FiO2 levels (from 6 % to 0 % O2). In four records, the intensity of the decrease in the reflectance trace was also correlated with the level of hypoxia.

Fig. 7.5
NADH responses to graded hypoxia induced by exposing canine puppy to 6 %, 4 %, 2 %, and 0 % oxygen. (© American Physiological Society, reprinted with permission [13])
To understand better the response of the mitochondrial NADH to anoxia/hypoxia, it was necessary to monitor more physiological parameters from the same brain simultaneously, and Chap. 5 in this book is devoted to this subject. Here I am presenting the results obtained when the multiparametric monitoring system was used.
Figure 7.6 shows responses to anoxia recorded from three different rats [3]. The metabolic parameters measured were pO2 and NADH fluorescence (CF) together with an indirect measure of blood volume, the reflected light (R). Ionic activity was evaluated by the extracellular K+ level after correction for DC steady potential changes. The electrical activities measured were the electrocorticogram (ECoG) as well as two DC potentials situated near the K+ electrode (DCK+) and the light guide (DCF).

Fig. 7.6
a, b Metabolic (NADH, pO2) ionic (K+), and electrical (ECoG, DC) responses to anoxia measured in three rats. In the third animal (c), a spontaneous spreading depression wave developed, as seen in the ECoG trace, extracellular K+ levels, and metabolic responses. (© Reprinted with permission from Elsevier [3])
The normoxic–anoxic transition, although resulting in different changes in R and F, exhibited a very similar increase (25–30 %) in the NADH trace (CF), suggesting that the correction was quite good. From energy depletion, the ECoG was depressed and extracellular K+ accumulated; this continued until the recovery phase, when the pO2 showed an overshoot, probably the result of increased blood flow (autoregulation), and very symmetrical reoxidation of the NADH in animals A and B. In animal C, an undershoot in NADH was recorded (oxidation) caused by a wave of spreading depression that developed spontaneously during the anoxic cycle and which was also recorded in the extracellular K+ trace. A similar correlation between metabolic, ionic, and electrical activities under anoxia of hypoxia was also described by Zeuthen et al. [14].
The effects of complete deprivation of oxygen (anoxia) on the brain were detected when the animal was exposed to hypoxia (Fig. 7.7) [3]. The rat was exposed to 10 %, 5 %, or 100 % N2. The decrease in oxygen supplied to the rat resulted in a gradual decrease in brain pO2, as well as in an increase in NADH. The ECoG showed a clear response only to 100 % N2. This response corresponded to a slight increase in extracellular K+.

Fig. 7.7
Effects of hypoxia (10 % O2, 5 % O2) and anoxia (100 % N2) on metabolic, ionic, and electrical activities of rat brain. In this animal, oxygenation of brain responses to breathing air as compared to 95 % O2 is shown. (© Reprinted with permission from Elsevier [3])
The effect of a continuous graded hypoxia is presented in Fig. 7.8 [15]. The effects of graded hypoxia were studied in the rat brain by breathing the animal with various mixtures of O2:N2. Figure 7.8 shows a continuous record of a rat breathing 100 % O2 and gradually shifted to 100 % N2 (anoxia). The main changes in pO2 were found when the rat shifted from 100 % O2 to 21 % (air) and between 21 % and 10 % O2. Later on, only small changes in pO2 were recorded until reaching the 0 % level of oxygen achieved under anoxia. The NADH responses to the hypoxia were completely reversed, namely, the main changes were recorded in the low pO2 ranges. One may expect these types of responses because of the significant differences in the origin of the signal. The pO2 is summing up the blood and tissue pO2 in general, whereas the NADH is measured from an intracellular compartment, the mitochondria.

Fig. 7.8
Effects of graded hypoxia and anoxia on various parameters measured from rat. (© Reprinted with kind permission of Springer Science + Business Media [15])
The changes in K+ were very small until the anoxia phase, which led to a small increase, and started to recover after rebreathing the rat with 100 % O2. During anoxia, a spontaneous SD cycle started below the light guide and propagated through the entire field (labeled by small arrows). After returning the rat to 100 % O2, a large overshot in pO2 was recorded, interrupted by the SD cycle (a large decrease and recovery). The effect of the SD on the NADH is rather complicated because it started when the energy supply was very low (anoxia), and an artifact was introduced into the measurement when the general depolarization occurred. As a result of the large reflectance increase, the correction factor of 1:1 was not good enough and the corrected trace showed an “apparent oxidation.” During this period, the pO2 was 0, so one cannot expect a real oxidation.
The initiation of a spreading depression wave during hypoxia (2 % oxygen) is presented in Fig. 7.9 [16]. The response of the pO2 electrode was very small, probably the result of low sensitivity, but the NADH redox state shows a large increase simultaneously with a large decrease in the reflectance signal (R). When O2 was supplied to the rat, the pO2 showed the expected overshoot simultaneously with the oxidation of NADH. The extracellular K+ accumulated during the hypoxia, and very soon after O2 breathing recovered to the pre-hypoxic level.

Fig. 7.9
Effects of 2-min hypoxia (2 %) on the functional state of the brain. A spontaneous spreading depression developed at the recovery phase. (© Reprinted with permission from Elsevier [16])
During the recovery period, a secondary response to the hypoxia was recorded; namely, a spreading depression wave (SD) propagated in the cortex [15, 17–19]. The initiation of the wave occurs during hypoxia at a certain point in the cortex and is then propagated to the entire hemisphere, including the area below the multiprobe assembly. During the spreading depression, a large increase in extracellular K+ was recorded (from below 3 mM to about 14–15 mM) together with the negative shift in the DC steady potential near the K+ electrode (DCK+) and the light guide (DCF). The ECoG remained depressed after hypoxia because of the concomitant spreading depression that occurred. The recovery period from the SD includes active pumping of K+ into the cells, which led to greater oxidation of NADH (CF) to supply more ATP as needed.
Figure 7.10 shows the responses to a short hypoxia (2 % O2) and to a terminal hypoxia induced by the same level of hypoxia [16].

Fig. 7.10
Lethal effects of 2 % O2 given to rat as recorded in metabolic, ionic, and electrical activities. (© Reprinted with permission from Elsevier [16])
Exposure to 100 % oxygen after a short hypoxia (2 % O2) led to a complete recovery, but after the second longer O2 deprivation event, the rat died. Extracellular K+ accumulated at high levels (K+ e is off scale) and the negative shift in DC potential remained. The NADH level reached its maximal level simultaneously with the decrease in pO2.
During the large increase in K+ e the optical signals show significant change, which is related to the general depolarization that occurred. A large increase in the reflectance trace was recorded, leading to an apparent “oxidation” of NADH (pO2 = 0). The CF trace reached the same high level 2 min after the general depolarization.
7.2.3 Ischemia (Decreased Blood Flow)
Under partial or complete ischemia, blood flow to the monitored organ is decreased and, as a result, O2 delivery is limited or even abolished. The use of ischemia in animal models provides information relevant to critical clinical situations such as brain stroke or heart attack. The primary factor starting the pathological state is the decrease in O2 supply, making the tissue energy balance negative, and preventing the tissue from performing its function.
In the early 1960s, Chance et al. [6] tested the effect of irreversible ischemia on brain NADH using the decapitation model (Fig. 7.11a). According to Chance one would expect that breathing nitrogen would lead to a very rapid transition from aerobiosis to anaerobiosis, as it has already been pointed out in this symposium that breathing nitrogen would serve to deplete the blood of oxygen. As shown in Fig. 7.11a, about 8 s are required between the start of DPN reduction and the attainment of half-maximal reduction. In an attempt to observe the time for DPN reduction in ischemia, we have employed a decapitation technique with the mouse; the optical system is arranged so that the slight mechanical artifact occurring on decapitation would not disturb the fluorescence excitation.

Fig. 7.11
a Record of kinetics of fluorescence changes of mouse brain cortex in ischemia caused by decapitation. (© Prof. Britton Chance, reprinted with permission [6].) b Effect of innominate (I) occlusion under conditions of open and occluded left subclavian (S.C.) artery. F − R is the weighted difference between fluorescence (at 450 nm) and reflectance (at 366 nm). Upward deflections in this and succeeding traces indicate increase in detected light signaling and increase in the level of reduced NAD. Optical changes are presented as percentage of full-scale (F.S.) values, with zero being the light level with no light allowed to the photomultiplier detector and 100 % being the “resting” level of light previous to experimental manipulation. (© Reprinted with permission from Elsevier [20])
In 1976 Rosenthal et al. investigated the effects of ischemia on the corrected NADH signal in the brain of cats (Fig. 7.11b) [20].
Incomplete ischemia was characterized by an increased level of reduced NAD, but this NADH level was only transiently elevated and invariably returned toward baseline during the period of circulatory compromise. When the left subclavian was unobstructed, innominate occlusion produced a transiently increased level of NADH (upper trace). A second innominate occlusion produced a smaller increase in the NADH level, which reversed more quickly, and a third innominate occlusion (lower trace) resulted in a smaller increase in reduced NAD and a still faster turnaround toward baseline. The subclavian artery was then occluded, and the NADH level rose to a value greater than that recorded in the first ischemic episode. Even when both the innominate and subclavian arteries remained occluded, the NADH level did not remain elevated but slowly returned toward its baseline. This finding suggests that alternate pathways provided collateral perfusion of the neocortex and demonstrates the need for careful ligation of all possible ascending arteries to produce complete cortical ischemia.
Using the fiber-optic-based fluorometer, we measured, in 1976, the effect of decapitation on NADH and ECoG in the awake rat; a typical response is shown in Fig. 7.12a [21].

Fig. 7.12
a Metabolic, reflected light, and electrical responses to complete ischemia induced by decapitation. Upper three traces were measured from the right hemisphere and electrical activity from the two hemiospheres. R reflectance, F fluorescence, CF corrected fluorescence (F − R), ECoG electrocorticogram [21]. b Quantitative way used in analysis of analog signals recorded under decapitation. (© Reprinted with permission from Elsevier [22])
Later on we tested the effects of age on NADH redox state in the awake and anesthetized rat exposed to decapitation [22]. The NADH was monitored from the two hemispheres of the rat brain (see Fig. 6.16). Here we are presenting the four upper traces that were measured from the left hemisphere. The differences in the responses between the two hemispheres were insignificant in most cases. The 366-nm reflected light (R) shows a very small initial response to the decapitation (Fig. 7.12b). However, a very large secondary reflectance increase was recorded 1–2 min after ECoG = 0 when NADH reached its maximal level. The uncorrected (F) and corrected (CF) 450 nm fluorescence signals were similar to those described previously. To analyze the effects of age on the responses to decapitation, various parameters were measured and calculated from the analog signals (Fig. 7.12b).
The definitions for the various parameters are as follows:

T 0
Time (s) when electrical activity was very low and close to 0
T 1
Interval between decapitation and the point when corrected fluorescence started increasing
T 2
Time when the maximum level of NADH was reached after decapitation
T 3
Time when NADH reached a level that is half of its maximum increase (CFmax/2)
T 4
Time when a large increase of the reflectance was measured (SRI = secondary reflectance increase)
CFmax
Maximum percentage increase of NADH above baseline after decapitation
CFo
Percentage increase of NADH above baseline when ECoG = 0
Percentage of NADH increase when ECoG = 0 in proportion to the maximum increase measured in the same rat
CFN2
Percentage increase of NADH above baseline in nitrogen environment (anoxia)
Detailed discussion of the results appears in Zarchin and Mayevsky[22].
The same type of data analysis could be used in other models of ischemia such as blood vessel reversible occlusion.
From the data accumulated in various experiments, it was clear that under severe lack of oxygen a hemodynamic response was measured after reaching the maximal level of NADH. We named it “secondary reflectance increase” (SRI), which appears at time T 4 shown in Fig. 7.12b. The results calculated from the analog signals were presented in the original publication.
To investigate the mechanism behind this event, we applied the multiparametric monitoring approach [23]. The optical signals were correlated with the ionic and electrical activities after induction of the decapitation model of ischemia (Fig. 7.13).
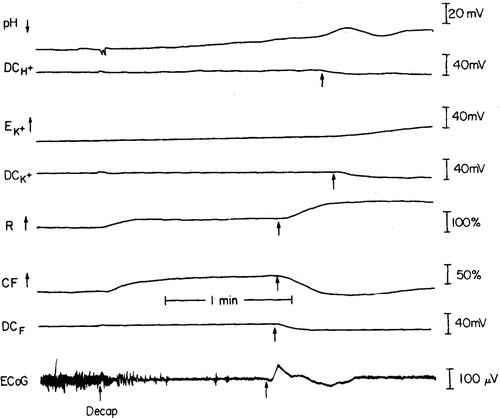
Fig. 7.13
Multiparametric responses to complete ischemia induced by decapitation. All abbreviations are explained in the text. (© American Physiological Society, reprinted with permission [23])
In this model, blood supply and oxygen delivery are terminated at once by decapitation. The initial effect of decapitation is the decreased level of oxygen in the tissue. The ECoG was the second parameter to respond and became isoelectric within 30 s. The pH showed a 30-s delay before becoming more acidic, probably from the accumulation of lactic acid. Extracellular K+ showed an initial increase after about 2 min and then reached its maximum level later on (not shown in Fig. 7.13). General depolarization of the cerebral cortex began in this gerbil after about 75 s, as indicated by the DC shift measured by the DC electrodes. This depolarization propagated through the entire cortex, as can be seen in the three DC electrodes: DCF, DCH+, and DCK+. The R trace showed a large increase during this depolarization event, preceded by the DC change near the light guide (DCF). This change in R, typical in complete ischemia, was described by us previously; we called it secondary reflectance increase (SRI). Although blood vessel occlusion effects have been described in the past, this is the first time that the effect of decapitation on the various parameters has been described. In our previous studies we showed the effects of decapitation on NADH fluorescence and reflectance as well as ECoG. The response of the reflectance trace was unexplained until now, and the origin of the SRI was also only a speculation previously.
General depolarization of the cortex occurred at the same time, shown by the DC negative shift and later on by the K+ (Fig. 7.13). We do not know why general depolarization caused a large increase in the reflected light signal. Two mechanisms could be involved: the change in absorption properties of the tissue caused by water and ion movement, or movement of the remaining blood from the vessels caused by depolarization effects on the wall of the vessels. Several reports (for details, see reference by Hansen and Olsen [24]) support the first possibility mentioned, namely, that during SD and ischemia a decrease in the extracellular space was found while the cells swelled.
The next step was to understand better the SRI event that developed under ischemia. We used the MPA monitoring system containing an oxygen electrode and exposed the gerbil to partial ischemia [25]. Figure 7.14a shows the response of a gerbil brain to 5-min unilateral carotid artery ligation. The level of ischemia developed was less as compared to bilateral carotid artery occlusion [25]. The pO2 trace shows an initial decrease followed by a slow recovery caused by the compensatory flow through the contralateral anterior cerebral artery. The same pattern of events is seen in the NADH redox state. Leakage of K+ from the cells in phase I of the insult was slower and smaller compared with that produced by bilateral occlusion. As soon as the large and rapid increase in EK+ occurred, the SRI was recorded in the reflectance trace simultaneously with a sharp decrease in pO2. The effect of partial ischemia on ECoG activity was also smaller and recovery was faster. Figure 7.14b shows a different type of response to unilateral occlusion found in 40 % to 50 % of the gerbils used. The level of ischemia achieved was smaller and, as a result, probably the changes in EK+ were more gradual and did not reach the second phase of large K+ leakage. The ECoG trace shows only a very small change, if any. The pO2 trace shows an initial decrease followed by a slow recovery caused by compensatory flow through the contralateral anterior cerebral artery. The same pattern of events is seen in the NADH redox state. The SRI event did not develop.
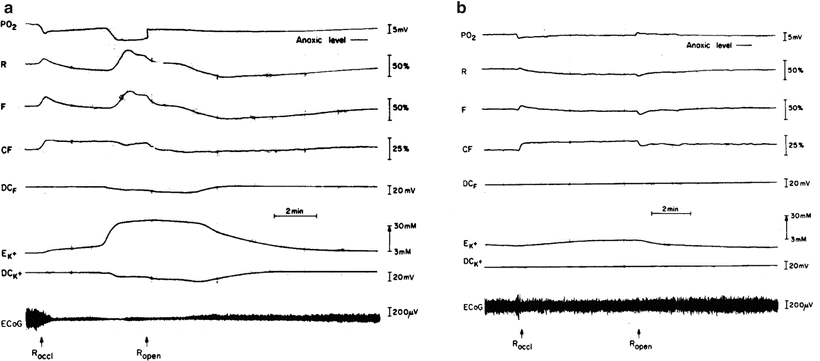
Fig. 7.14
Effects of unilateral carotid artery occlusion (Roccl) on metabolic, ionic, and electrical activities measured in two different gerbil brains. (© Reprinted with kind permission of Springer Science + Business Media [25])
Figure 7.15 presents the response of the gerbil brain to unilateral and bilateral carotid artery occlusion while using the MPA monitoring system in the right hemisphere [15].

Fig. 7.15
Responses to unilateral and bilateral carotid occlusion in the gerbil brain. (© Reprinted with kind permission of Springer Science + Business Media [15])
When the contralateral carotid artery was occluded (LOCC), very small transient changes were recorded in pO2 and NADH. Only after inducing complete ischemia (ROCC) did pO2 drop to 0 and NADH increase to its maximal level. As a result, a spontaneous SD cycle was initiated, and the type of responses recorded was similar to those recorded after anoxia. These results confirm again our previous data about the oxidation of NADH when an extra pumping of K+ is stimulated by SD.
In the late 1980s, a new technique enabling the monitoring of microcirculatory blood flow was incorporated into our MPA monitoring system [26].
Figure 7.16 shows typical responses to unilateral (ROCCl) and bilateral (Loccl) in CBF (LDF) and an increase in NADH levels (CF). During the period of ischemia, accumulation of K+ in the extracellular space was recorded (K1 +, K2 +) but the DC steady potential and the Ca2+ levels remained unchanged during the occlusion period.

Fig. 7.16
Effects of unilateral (Roccl) and bilateral (Loccl) carotid occlusion on metabolic hemodynamic, ionic, and electrical activities in the gerbil brain. R 366-nm reflectance, F 450-nm fluorescence, CF-NADH corrected fluorescence, LDF′ LDvol, LDvel laser Doppler flow, volume, and velocity, K e + (1) ′K + e (2 – ′Ca e 2+ extracellular potassium (two electrodes) and calcium electrodes DCK+l′ DCK 2′, DCCa 2+ DC steady potential measured concentric to the three electrodes, ECoG electrocorticogram. (© Reprinted with kind permission of Springer Science + Business Media [26])
The ECoG reached the isoelectric level very soon after the second occlusion. During the reopening of the carotid arteries, a rapid reperfusion was recorded together with the oxidation of NADH. A spontaneous wave of SD (spreading depression) was developed during the recovery phase, characterized by a large increase in K+ e and a decrease in Ca2+ e together with a negative shift in the DC steady potential. During the recovery from the SD wave, a large increase in CBF (300 %) was recorded accompanied by an oxidation wave of the NADH (decrease CF).
7.2.4 Hyperoxia (Normobaric and Hyperbaric Increase in FiO2)
To expose an organ in vivo to elevated oxygenation-hyperoxia, it is possible to use one of two options:
(a)
Normobaric hyperoxia is achieved by making the animal breathe elevated FiO2, namely, between 21 % O2 and 100 % O2 at atmospheric pressure.
(b)
Hyperbaric hyperoxia (HBO) is induced by using a hyperbaric chamber in which oxygen pressure is elevated while the animal is located in the chamber.
It is well documented that providing animals or a human with elevated oxygenation leads to the development of “oxygen toxicity.” The time needed for the development of this toxic event is inversely proportional to the level of oxygenation; namely, the higher the pO2, the shorter the time.
On the other hand, providing more O2 may be beneficial in conditions such as carbon monoxide toxicity, body oxygenation pathology (heart or lung problems), and severe trauma. Therefore, it became necessary to understand the relationship between the level of oxygenation and the function of the mitochondria in vivo. In this section, papers that are cited in the reference list include studies in which other organs than the brain were used. In early studies, the kidney and the liver were used, but these are cited in Table 7.2
In the mid-1960s, Chance and collaborators [27–31] developed the experimental setup that enabled the exposure of various types of mitochondria as well as of the entire small animal to the hyperbaric chamber. They showed that the NADH of the brain, liver, and kidney became oxidized under hyperbaric oxygenation, and this effect was correlated with a decrease in pyridine nucleotides measured by biochemical analysis of fixed tissue.
Figure 7.17 presents the setup (Fig. 7.17a) and typical results obtained when a suspension of rat liver mitochondria was exposed to hyperbaric oxygenation. Initially, the mitochondria were exposed to anoxia (left side) and an increase in NADH fluorescence was recorded. Increase in the pressure of oxygen to 11 atm led to a clear oxidation of NADH in the mitochondria. This pressurization technique was used in later experiments when various organs of the rat were exposed in vivo to HBO (Fig. 7.17c) [29]. Typical results of in vivo monitoring are shown in Fig. 7.18 wherein the rat liver (Fig. 7.17a) or brain (Fig. 7.17b) in vivo was exposed to gradual increase in oxygen pressure [28]. A clear oxidation of NADH was recorded in the two tested organs. The plot of percent change (decrease) of NADH against HBO pressure in three organs is presented in Fig. 7.18c–e [27].


Fig. 7.17
a Chamber for the study of cell suspensions in mitochondria under hyperbaric conditions: compensated fluorometer with compensating photomultiplier on left, excitation source in center, and measuring photomultiplier on right. Chamber is also provided for light transmission and measurements with the double-beam spectrophotometer for measuring the oxidation–reduction state of cytochromes. Fluorometer for measuring reduced pyridine nucleotide concentration can be replaced by one for measuring flavoprotein only, or flavoprotein and pyridine nucleotide [29]. b Response of reduced pyridine nucleotide component of rat liver mitochondria to anoxia and to high-pressure oxygen. c Apparatus for fluorometric examination of changes in NADH redox state in organs of nesthetized rat. Fluorometer components are mounted on top of window of hyperbaric chamber. Left, compensating photomultiplier; center, excitation lamp; right, measuring photomultiplier. d Response of rat liver to repetitive pressurization and decompression with oxygen. Values of pressure are included; sensitivity for measuring fluorescence changes is also indicated. (© Prof. Britton Chance, reprinted with permission [29])
Fig. 7.18
Effects of hyperbaric oxygen in vivo: urethane-anesthetized rat placed in pressure chamber shown in Fig. 7.17b, and compressed with oxygen at values indicated in graph (atm./ln.2): rat liver (a); rat brain (b). Fluorescence calibration is indicated as percentage of aerobic signal. Lower part shows titration curves for rat kidney (c), rat liver (d), and rat brain (e) with hyperbaric oxygen. Decrease of fluorescence is given as a percentage of aerobic–anaerobic fluorescence increase. (© Reprinted by permission from Macmillan Publishers Ltd. [28])
After the introduction of light guide-based fluorometry, we were able to expose an awake brain to hyperbaric oxygenation conditions (Fig. 7.19a). Figure 7.19b presents the response of the brain to 100 % oxygen under hyperbaric conditions pre-treated by trimethadione [32]. A clear decrease in NADH (oxidation) was recorded during the shift from 21 % to 100 % O2 as compared to the increase in NADH that was recorded before death (lower right side). The same type of NADH decrease (oxidation) was recorded during compression of up to 10 atmospheres 100 % O2 [3, 33–39]. Figure 7.20a presents typical results recorded from the unanesthetized rat brain exposed to 75 psi (6 ATA) of oxygen [33].


Fig. 7.19
a Time-sharing fluorometer/reflectometer attached to hyperbaric oxygen chamber enables measurement of NADH from cortex of awake rat exposed to HPO [32]. b Effect of trimethadione on response of awake brain cortex to 75 psi pure oxygen. A—Al, 366-nm reflectance; B—Bl, 450-nm fluorescence; C—Cl, 450-nm corrected fluorescence; D—Dl, EEG of right hemisphere; E—+El, EEG of left hemisphere. Upward deflection of pen represents increase in signal size. (© John Wiley and Sons, reprinted with permission [32])
Fig. 7.20
a Effects of pressure level during hyperbaric oxygenation on hemodynamic, metabolic, and electrical activity of the brain. (b, c) Effects of pressure level during hyperbaric oxygenation on electrical activity and its concomitant phenomena of convulsions and spreading depression. (© American Physiological Society, reprinted with permission [33])
The reflectance at 366 nm increases during the compression period, and a few minutes later a large decrease of reflectance occurs. This pattern of reflectance changes was observed in all animals. The third trace from the top—the corrected fluorescence—represents the difference between the fluorescence emission at 450 nm and the reflectance at 366 nm. By this subtraction, one can eliminate absorbance changes from hemodynamic effects that produce artifacts in the fluorescence measurements. This correction technique is now used by several groups [7, 11, 19, 40, 41].
During compression, oxidation of NADH of 10 % of the normoxic fluorescence level is observed, which is maintained for 15 min. A series of oxidation–reduction cycles of NADH then appears. Approximately 10 min before the animal stops breathing, a reduction of NADH is observed, which increases to 50–60 % at the end.
The fourth and fifth traces of Fig. 7.20a show the EEG measured from the two hemispheres. In most animals, the two hemispheres of the cortex respond to HBO in the same way. A few minutes after compression, the EEG changes from the typical ‘awake’ pattern to the activated pattern, and then the convulsions appear. The number of bursts of convulsive activity differs between animals. The EEG becomes flat just before the animal stops breathing, and reduction of NADH is seen.
The signals were analyzed in a quantitative way, and parts of the results are presented in Fig. 7.20b, c with the number of convulsions. The effects of pressure on the various parameters measured are demonstrated. The three parameters shown in Fig. 7.20b, c [33] are probably connected to each other and in most conditions occurred in the same order (i.e., the change in reflectance is the first event, followed by the convulsive activity, and the oxidation cycles, which appeared later). Between 30 and 60 psi the slopes of the changes of all three parameters are very sharp, whereas between 60 and 150 psi they are more moderate. Thus, the 60-psi pressure is a breaking point of the line. On the other hand, the other three parameters shown in Fig. 7.20b are affected differently by the pressure. The maximum effect was observed at 60 psi, and the curves had a bell shape. The differences between the 60-psi point and the 30- or 150-psi points are statistically significant (p < 0.005), as calculated by the Student’s t test.
In another study we tested the effects of unilateral and bilateral carotid artery occlusion on the responses to hyperbaric oxygenation (Fig. 7.21) [39]. Figure 7.21a shows the location of the two probes on the two hemispheres. The two-channel fluorometer is presented in Fig. 7.21b. Figure 7.21c shows the number of seizures and cycles measured in the two hemispheres in the control as well as in the various carotid-occluded groups. No differences were found between the rats bilaterally occluded for 24 and 48 h; therefore, only one set of results is presented (48 h).

Fig. 7.21
a, b Experimental setup by which awake brain was monitored under HBO conditions: two-channel light guide fluorometer–reflectometer is shown in b. Topical view of rat brain implanted with light guide holders and ECoG electrodes is shown in a. c Number of tonic-clonic convulsion episodes (conv) and spreading depression waves (cycles) developed (under HBO) in the right (RH) and left (LH) cerebral hemispheres of control (cont) and bilateral or unilateral carotid-occluded rats. (© European Underwater & Baromedical Society, reprinted with permission [39])
In the control group (cont.), the number of seizures was 9 to 10 and the number of cycles was in the range of 6 or 7. No significant difference was found between the two hemispheres as expected. The occlusion of the two carotid arteries led to almost abolishing the seizures and the SD cycles. Unilateral occlusion had a less dramatic inhibition but still a significant effect. Even though only one carotid was occluded, no difference was found between the events recorded from the two hemispheres.
The survival time in all four groups of rats was in the range of 4 h (234–258 min), and no significant differences among the groups were noted.
A similar oxidation was found upon CO2 addition to the gas mixture (94–99 % O2) [42], or when the rat was pretreated with an anticonvulsive drug [32]. We also found a correlation between the elevated brain pO2 and the oxidation of NADH in awake rats [43]. The oxidation of NADH was also recorded under normobaric hyperoxia [16, 44–50]. Furthermore, we tested the effects of hyperbaric oxygenation on carbon monoxide intoxication [51, 52] or cyanide exposure [53].
In another study we tested the correlation between NADH fluorescence and two other hemodynamic parameters under various levels of hyperbaric oxygenation [54]. Figure 7.22 (1) shows one group of rats that was tested to show the effect of HBO at various ‘nontoxic’ pressure levels (1.5, 2, 2.5, 3, and 3.5 ATA) on the measured parameters. Because the range of therapeutic HBO pressure levels confirmed by the Undersea and Hyperbaric Medical Society (UHMS) for various pathological conditions was between 2 and 3 ATA (HBO approved indications) [55, 56], we decided to test the effect of these pressures, compared to the control group at 0.2 ATA, on the measured parameters. The experiments started from normal pressure (0.2 ATA) for 15 min. Then, pressure was elevated gradually starting from normobaric hyperoxia at 1 ATA and continued to hyperbaric pressure elevating by increments of 0.5 ATA from 1.5 to 3.5 ATA, after washing out the chamber with 100 % O2. Each step of pressure continued for 15 min; HbO2 increased significantly and NADH redox state decreased significantly. The 366-nm reflectance augmented significantly, showing a decrease in blood volume, although CBF did not demonstrate significant changes.

Fig. 7.22
1 Effect of normobaric hyperoxia (100 % O2) and various levels of hyperbaric hyperoxia (1.5 ATA, 2.0 ATA, 2.5 ATA, 3 ATA, 3.5 ATA) on cerebral blood flow (CBF), reflectance (R366), mitochondrial NADH redox state, and hemoglobin oxygen saturation (HbO2). Data are presented as mean percent values ±SE. Black points experimental group; gray points control group. Repeated-measures ANOVA and Bonferroni post hoc test showed significant differences between control and experimental group.
***p < 0.001 range of specific time points (20, 35, 50, 65, 80, and 95 min) presenting significant differences calculated by Student t test between control and experimental groups. (© Reprinted with permission from Elsevier [54]. 2 Effect of 100 % O2 and 2.5 ATA O2 (gray line) as compared to normobaric normoxia (black line). A Normobaric normoxia; B 100 % O2; C 2.5 ATA. Data are presented as median ± MAD. CBF cerebral blood flow; R366 reflectance at 366 nm and NADH–mitochondrial NADH redox state; HbO 2 brain tissue hemoglobin saturation.
Figure 7.22 (2) shows the effects of 2.5 ATA [57] compared to the control group at 0.2 ATA, on CBF, reflectance, mitochondrial NADH fluorescence, and HbO2. The experiments started from normal pressure (0.2 ATA), and the pressure was elevated gradually starting from NH at 100 % O2 and continued to hyperbaric pressure (2.5 ATA). Our results showed that 2.5 ATA had no toxic effects during the monitoring period. Starting with 100 % O2, HbO2 and reflectance increased significantly whereas NADH oxidized (decreased) significantly; under elevated pressure (2.5 ATA), a further augmentation in HbO2 and reflectance was observed. Also, HbO2 reached a steady-state level about 5 min after the compression started. Parallel to these changes, mitochondrial NADH oxidized and reached a steady state. No significant changes were observed in CBF.
To understand the mechanism behind the development of seizures under hyperbaric oxygenation, the following study was performed [37]. The NADH fluorescence, pO2, ECoG, and extracellular potassium levels were monitored inside the hyperbaric chamber (Fig. 7.23). Figure 7.23a shows the responses to 5 ATA O2 and the development of the first tonic-clonic seizures in the awake rat. One can see the increased pO2 level simultaneously with the oxidation of NADH. The K+ accumulated gradually (in this animal) in the extracellular space. During the seizure itself, the K+ showed a transient increase, and then a secondary increase was recorded together with a large negative shift in DC steady potential; these changes are characteristic of the spreading depression phenomenon. Energy metabolism was stimulated as seen by the wave of NADH oxidation. After the SD wave, K+ showed an undershoot, which may suggest an activation of the Na+/K+-ATPase system. Figure 7.23b shows another rat exposed to 5 ATA O2. In this animal the resting level of K+ remained normal during the preconvulsive stage and an undershoot was also recorded after the SD wave. These results suggest that the SD wave following the epileptic activity may serve as a mechanism for termination of the high electrical activity occurring during the seizure. During the seizure, K+ accumulated and reached a level that could initiate a wave of SD. Similar results were obtained when epilepsy was induced by other means (metrazol, penicillin); typical results were published [13, 38].

Fig. 7.23
a First tonic-clonic convulsion developed under hyperbaric oxygenation of the awake rat (5 ATA O2). b Metabolic, ionic, and electrical responses to hyperbaric oxygenation (5 ATA O2) of a second awake rat. ECoG electrocorticogram, pO 2 partial pressure of O2, E K + level of extracellular K+, R reflectance, F NADH fluorescence, CF corrected fluorescence, DC K + , DC F steady potential measured near K+ electrode or light guide. (© Undersea Medical Society, reprinted with permission [37])
Figure 7.24 summarizes our findings [37] with regard to the HBO toxicity development processes. According to the results accumulated in our laboratory, we are interpreting the oxidation of NADH as an activation of the energy metabolism of the brain in vivo, as was suggested also by Hempel and Jobsis [58] for cytochrome aa 3 and by Hempel et al. using the pyrenbutynic acid as an intracellular pO2 indicator [59]. This idea is supported by the increase of glycolysis that occurs in vivo and supplies more substrate to the mitochondria [60].

Fig. 7.24
Summary of various events recorded from surface of brain under hyperbaric oxygenation. (© Undersea Medical Society, reprinted with permission [37])
One possible explanation for the activation of energy metabolism is the availability of more oxygen intracellularly, which in normal air-breathing conditions is not optimal [59]. We believe that under the preconvulsive stage of hyperbaric oxygen, energy production and availability are not impaired and even may be stimulated because more oxygen is available intracellularly.
We still do not have clear-cut statistical evidence about the level of extracellular K+ at the first phase. Extracellular K+ may increase because of a membrane permeability change, and thus may stimulate the activity of the Na+/K+-ATPase, as shown by Hemrick and Gottlieb and Gottlieb et al. [61, 62].
The other possibility is that Na+/K+-ATPase is inhibited initially, as shown by Kovachich and Mishra and Kovachich et al. [63, 64], and that this induces K+ to accumulate in the extracellular space. During the beginning of the convulsive period, our results suggested that the epileptic activity followed by the spreading depression mechanism are energy-consuming processes and thus stimulate the mitochondrial activity to produce more needed ATP. We do not see any results that support inhibition of the Na+/K+-ATPase system at the second stage. Only at the final stage of the seizures may such an event occur, and as a result K+ will accumulate in the extracellular space. It seems to us that the mechanism of initiation of the epileptic activity cannot be drawn from our results; we assume that other physiological or biochemical events are in charge of this mechanism, such as impaired neurotransmission or an event occurring in subcortical structures. As shown by Balentine [65], the cortical areas are not connected to the neuronal necrosis found in other areas of the brain.
7.2.5 Changes in Inspired CO2 and CO
The involvement of CO2 in tissue energy metabolism, evaluated by NADH fluorescence, was studied by several investigators using higher (hypercapnia) or lower (hypocapnia) CO2 levels in the gas mixture. In 1968, Granholm et al. showed that hyperventilation of a rat led to an increase in NADH, probably caused by a decrease in cerebral blood flow [66]. Using the monkey brain, Sundt and Anderson [67] and Sundt et al. [68] tested the effects of hypercapnia and hypocapnia on NADH responses in normoxic and ischemic tissue. No change in NADH was found in the normoxic brain, whereas in the ischemic brain, the change in pCO2 did not affect the elevated NADH. They found a decrease in NADH during seizures, however, nonconcomitant with CO2 changes [69]. Haselgrove et al. found that hypercapnia altered the response to cortical spreading depression [70]. Under hypocapnia, there was an increase in brain NADH caused by a decrease in cerebral blood flow [71, 72]. Hypercapnia abolished the oscillation in brain NADH [50, 73]. The same group found that hypercapnia did not affect the NADH oxidation level induced by electrical stimulation of the cortex [74–76].
The effects of pCO2 were tested in other organs, apart from the brain. Sonn et al. found that in the dog hypopnea, which induced hypercapnia, changed the redox state of NADH depending on the heart rate [77].
Figure 7.25 shows the effects of hypercapnia on NADH and other physiological parameters measured from the rat kidney. Very small changes were recorded in the various parameters.

Fig. 7.25
Effects of hypercapnia (10 % CO2 + 21 % oxygen) on brain NADH, CBF, extracellular K+, blood pressure, and ECoG: control (a); hypercapnia (b). (From Etziony R, et al. Unpublished M.Sc. thesis)
Figure 7.26 presents the responses of NADH and renal blood flow, measured by laser Doppler flowmetry, to hypercapnia (10 % CO2). An average of eight rats in the control and hypercapnia groups is presented. The analysis of variance (ANOVA) test shows that no significant changes were found.

Fig. 7.26
Effects of hypercapnia (10 % CO2) on renal blood flow (RBF) and NADH monitored in eight rats. Control animal in purple; hypercapnia in red. (From Donna Amran-Cohen et al. Unpublished M.Sc. thesis, 2001)
Exposure of intact animals to CO mimics human CO intoxication, requiring an optimal therapeutic strategy [78]. Dora et al. were able to change the NADH redox state when CO was applied topically to the brain [79].
Figure 7.27 presents the experimental setup (a) to monitor the effects of topical applied CO on NADH in the cerebral cortex [79], as shown in Fig. 7.23b.

Fig. 7.27
a Schematic representation of local gas application. Plastic ring is fastened to end of Schott light pipe. Two metal tubes (0.5-mm outer diameter) are inserted in plastic ring. A 20-μm-thick Teflon membrane is fixed to this apparatus with a rubber O ring. By adjusting the two-channel gas flowmeter, a controlled amount of either pure oxygen or carbon monoxide flows into the Teflon chamber, the volume of which is approximately 40 mm3. Gas pressure is regulated using a 250-mm water column. b Fluorescence, reflectance, and corrected fluorescence during a local O2–CO–O2 cycle with prolonged inspiration of 6 % O2/94 % N2. Blood pressure and EEG also shown. Arrows to left of tracing indicate calibration of parameters under normoxic conditions. Horizontal lines below arrows indicated normoxic baselines. In this experiment, blood pressure increases are recorded as downward deflection. (© American Physiological Society, reprinted with permission [79])
To emphasize the effect of CO, the animal had been subjected to hypoxia by breathing 6 % oxygen/94 % nitrogen. Breathing 6 % oxygen under these conditions gives a stabilized low blood pressure between 30 and 40 mmHg. Thus, the initial reduction of NAD with respect to the normoxic condition was 32 %. After stabilization at this level for a minute, the gas in the chamber, which had previously been O2, was switched to CO at the point marked by the arrow (time proceeding from left to right). A few seconds thereafter, histotoxic anoxia occurs and the fluorescence increases by 18 % (CF trace) and remains practically stable for 3 min. The EEG remained constant during this interval; the electrodes were placed so as to measure the generalized response of the brain cortex, not localized responses. Application of oxygen causes, within a few seconds, a reestablishment of the redox state before the perturbation.
Our group showed in detail the influence of various CO levels on the pathophysiology of the brain in vivo [51, 52, 80–85]. When CO levels were low, the NADH remained the same, whereas above 3000 ppm, CO led to an increase in NADH from the development of hypoxia. Figure 7.28 presents the effects of two low levels of CO (a) and a high level, namely, more than 90 % (b).

Fig. 7.28
a Effects of exposure to 1000 ppm CO followed by 3000 ppm CO on metabolic hemodynamic, ionic, and electrical activities measured in awake rat. Na and DC–a, extracellular level and DC potential of Na+. b Exposure of awake rat to high dose of CO (>90 %). Initial dose of CO given at COa was not so effective as second dose (COb), which was lethal. (© American Physiological Society, reprinted with permission [80])
Exposure of the rat to 1000 and 3000 ppm CO led to the result shown in Fig. 7.28a [73]. In this rat, the response to 40 min of 1000 ppm CO led to a drop in the reflectance and a clear elevation of CBF. The decrease in the R signal suggests an increase in light absorption, although the CBV in this rat did not respond to 1000 ppm CO. During the period of 1000 ppm CO, the NADH was not affected at all, and only 3000 ppm CO led to an increase in NADH, suggesting a decrease in O2 supply to the brain. Also, a small increase in K+ was noticed under 3000 ppm CO.
Exposure of an awake rat to a high concentration of CO led to a lethal toxic effect (Fig. 7.28b) [80]. Before the death response, the CBF showed a large increase typical of the response to carbon monoxide, and immediately after the death response, the CBF went down to zero level. At this point, NADH and K+ were increased. A decrease in Ca2+ and Na+ in the extracellular space was recorded as expected under brain death. These changes in ion concentration are typical of a depolarization event that occurred under ischemia, anoxia, or severe asphyxia. All three DC electrodes showed the typical negative shift that is also found in severe ischemia [23, 86, 87].
In all these studies, we correlated the changes in NADH to other physiological parameters monitored from the same brain area.
The negative effects of CO on brain NADH responses to cortical spreading depression (CSD) were reversed by exposing the rats to hyperbaric oxygenation [52].
Differences in the responses to spontaneously developed CSD in air or different CO concentration in the same rat are presented in Fig. 7.29 [80].

Fig. 7.29
Responses to spontaneously developed cortical spreading depression (SD) under air (a), 18 min of 1000 ppm CO (b), and 2.5 min of 3000 ppm CO (c). All scales in c are identical to a and b. Initiation of SD was spontaneous and was similar to other rats in which SD was induced by epidural washing of KCL solution 2–5 mm anterior to MPA (Fig. 5.10). (© American Physiological Society, reprinted with permission [80])
In Fig. 7.29a, the rat was in an air-breathing environment and the changes in the ionic and metabolic responses were typical CSD. NADH became oxidized, CBF increased, and the ion movement was typical for this event. The responses shown in Fig. 7.29b were recorded at less than 1000 ppm CO, whereas those in Fig. 7.29c were less than 3000 ppm CO. The main changes among these conditions were in the hemodynamic responses, namely, that under CO the large hyperemic response to CSD did not occur. Also, the duration of the wave was slower under CO, as seen by the various parameters.
7.2.6 Oscillations of NADH Fluorescence
A few years after the initial studies in which NADH fluorescence was measured, Chance et al. described oscillations in NADH fluorescence in various experimental models [88–93]. A few more papers were published in this field [94–98].
Figure 7.30 shows correlation between oscillations in NADH fluorescence and pO2 in perfused hearts in vitro. The oscillations started after initial depletion of endogenous substrate followed by the addition of glucose [92].

Fig. 7.30
Onset of spontaneous oscillations after interval of anoxia. Upper trace shows fluorescence intensity and lower trace shows tissue oxygen tension on glycogen-depleted heart. Perfusion fluid was changed to medium saturated with nitrogen and back to oxygenated medium at points shown. (© Reprinted with kind permission of Springer Science + Business Media [92])
Oscillations in brain NADH fluorescence were described in 1976 by Dora et al. [99], as seen in Fig. 7.31 where part of an oscillatory experiment is demonstrated. In Fig. 7.31a the beginning, and in Fig. 7.31b the end, of oscillations are shown. Oscillation was elicited by decreasing the oxygen content of inspired gas mixture from 30 % to 6 %, as marked by the arrow (Fig. 7.31a). As a consequence of hypoxia, arterial blood pressure dropped from the initial 120 mmHg to 25 mmHg. Corrected fluorescence increased by 30 %, reflectance changed moderately (10 % increase), and EEG showed a slight decrease as compared to the control activity. Following these abrupt changes, blood pressure started to increase. The oxidation–reduction state of the brain cortex shifted toward oxidation, and the minimal value of NADH fluorescence and the electrical activity were close to the control levels. Later on, in 1981, the same group published two more papers on this interesting subject [73, 100].

Fig. 7.31
A typical experiment shows oscillations of arterial blood pressure (BP), EEG, fluorescence (F), corrected fluorescence (CF), and reflectance (R) of rat brain cortex. (© Reprinted with kind permission of Springer Science + Business Media [99])
In 1984 we descried a new experimental model [48] in which brain NADH oscillations were induced by partial brain ischemia in the rat model. The frequency of the oscillations was in the range of 6–8 waves per minute.
The results could be summarized as follows. (1) In rats with unilateral carotid artery occlusion, oscillations in NADH fluorescence and reflected light were measured in the occluded hemisphere, although the ‘control’ hemisphere showed a much smaller amplitude of oscillations. (2) The frequency and amplitude of the oscillations were affected by various factors, such as level of anesthesia and level of O2 in the breathing mixture. (3) The pattern of the oscillations was also affected by small changes in the alert state of the animal.
In the next step we investigated in more detail the nature of the oscillations as well as the factors affecting this induced phenomenon [50]. It was found that hypercapnia, hypoxia, anoxia, and cortical spreading depression abolished the oscillations.
We have already shown, in a preliminary study, that unilateral and bilateral carotid artery ligation for 24–48 h led to an oscillatory phenomenon in brain blood volume (366 nm reflectance) and in the NADH uncorrected and corrected fluorescence (450 nm). As seen in Fig. 7.32a, occlusion of the two carotid arteries for 24 h induced organized oscillations (waves per minute) in NADH (F, CF) as well as in blood volume (R), which were not observed in a control animal (upper three traces) even when the scale sensitivity was increased in the control animal. To create a repeatable animal model for the various studies, we tested the appearance of the oscillations as a function of time after carotid artery occlusion, as well as the level of ischemia (unilateral or bilateral carotid occlusion) [50].
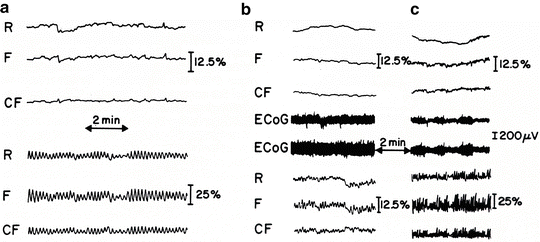
Fig. 7.32
a Oscillations in reflectance (R), fluorescence (F), and corrected NADH fluorescence (CF) recorded from 24-h bilateral carotid-occluded rat (lower three traces) as compared with control normal rat (upper three traces). b Intensity of oscillations measured bilaterally from 24-h left carotid artery-occluded rat (lower three traces). c Measured 2 h after b when same rat was fully awake. Upper three traces were recorded from unoccluded right hemisphere of the same rat. (© Maney publishing, reprinted with permission [50])
Figure 7.32a shows the oscillations recorded from a 24-h left carotid artery-ligated rat. As seen in Fig. 7.32b, the intensity of the oscillations in the ipsilateral occluded side (left) was much higher than in the unoccluded contralateral hemisphere (upper three traces). The record shown in Fig. 7.32c was taken from the same rat 2 h later when the animal became awake. As seen, the amplitude as well as the frequency of the oscillations increased. Also, some oscillations were recorded from the contralateral unoccluded side, the right side (upper three traces).
Figure 7.33 shows the oscillation of NADH and other parameters monitored in the unanesthetized rat [50].
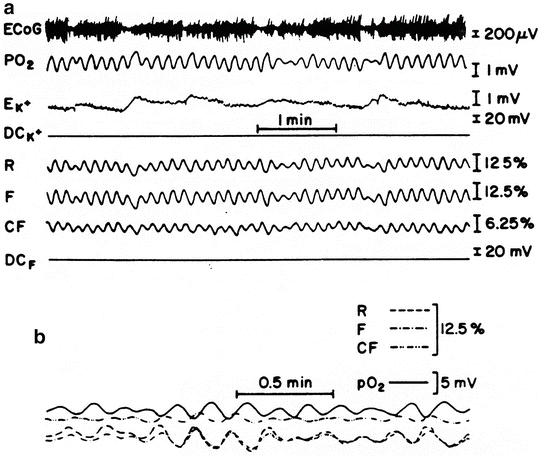
Fig. 7.33
a Multiparametric recording from brain of awake rat in which both carotid arteries were occluded for 45 h. ECoG electrocorticogram, pO 2 tissue oxygen pressure, EK + uncorrected potential measured from valynomycin potassium electrode, DCK + , DCF DC steady potential measured around K+ electrode and light guide, R reflectance, F fluorescence, CF corrected fluorescence representing net NADH signal. b Oscillation-phase relationship between R, F, CF, and tissue pO2 in a 24-h bilateral carotid-occluded rat. (© Maney Publishing, reprinted with permission [50])
Another type of verification of the nature of the oscillations came from our studies [50] in which pO2 was monitored simultaneously with NADH redox state as well as extracellular K+ (five different rats). Ligating the bilateral carotid arteries for 24 h induced oscillations in the partial pressure of oxygen as measured with the oxygen electrode above the brain cortex (Fig. 7.33a). The oscillations in the optical signals also appeared as changes in blood volume (R) as well as in the intramitochondrial NADH redox state (F, CF). The rat was anesthetized for the operation period and then placed in a small Plexiglas cage connected to the monitoring system. The rat was awake during the measurement period, which was 3–4 h after the operation, and changes in the ECoG pattern were recorded simultaneously with the changes in extracellular K+ levels (K+ e). These changes are in the range of ±1 mM. During the activation phase of the ECoG, the well-organized oscillations were somewhat distorted.
To change the energy demand by the brain, we tested the effects of spontaneous changes in activity (awake–sleep state), level of anesthesia, as well as induction of SD, which is known to change energy utilization. Changes in electrical activity (ECoG) representing waking responses of the animal resulted in a decrease in the intensity of the waves (Fig. 7.33a). In all experiments, a clear phase difference was found between the R, F, and CF signals. However, as saline was injected, the R and F signals showed a simultaneous increase as a result of the hemodilution effect appearing in both signals at the same time. A very interesting phase relationship was found between the pO2 and the R signals as tested in four different animals (Fig. 7.33b). It seems that whenever the R signals increased (blood volume decreased), the pO2 decreased, showing that the changes in blood volume directly affected the oxygen availability (although the measurement sites of the various parameters were not identical).
Figure 7.34 demonstrates the phase relationships between different locations on the brain that were analyzed in another group of five rats exposed to bilateral carotid ligation. As shown in Fig. 7.34a [50], the phase of the waves appearing in the R, F, or CF signals varied between the right and left hemispheres. Furthermore, it can be seen that the phase relationships in the two hemispheres exhibited pattern changes in time, namely, that the oscillator is active, not in a fixed duration, at each location in the two hemispheres. The different wave pattern was studied also in the same hemisphere in which four measuring sites (1 mm diameter each) were montiored simultaneously by the four-channel fluorometer–reflectometer. As shown in Fig. 7.34b1 and b2, which were recorded at 15-min intervals, each measuring site showed a different wave pattern at various times with regard to amplitude and phase relationships in the same brain hemisphere.

Fig. 7.34
Oscillation-phase relationships between two cerebral hemispheres (a) or four different measuring sites in the same hemisphere (b) in rat with bilateral carotid artery occlusion (b1 and b2). (© Maney Publishing, reprinted with permission [50])
During our studies in various animal models, we found that NADH oscillations could be developed when the brain was exposed to various perturbations [83].
Figure 7.35(a–e) presents records taken from one animal of each of the treated groups. It demonstrates typical changes in CBF reflected light and NADH during the oscillation period. The range of amplitude in CBF oscillation peaks is 6–30 % and the NADH oscillation range is 5–10 %. The oscillation frequency was not significantly different among the various treatments [50] and was found to be in the range of 3.6–5.5 waves/min.

Fig. 7.35
a–e Oscillations recorded from different animals under various treatments. a Anesthetized animal monitored 24 h after two-carotid-occlusion procedure. b Awake animal monitored after 24 h after two-carotid-occlusion procedure. c Animal receiving alcohol IV. d Oscillations monitored after N-Arg administration. e Animal exposed to 3000 ppm CO. R reflectance, NADH mitochondrial NADH redox state, CBF cerebral blood flow, CBV cerebral blood volume. (© Reprinted with kind permission of Springer Science + Business Media [83])
Therefore, we conclude that the source of the oscillations is a change in brain regulation of microcirculation and the pathological state developed. It is also clear that the oscillator is not central but rather a local one affected by various perturbations of CO levels, and depth of anesthesia, as well as events such as trauma.
In our clinical monitoring of mitochondrial NADH in the brain we found evidence of oscillations very similar to those measured in animal models [83].
7.3 Responses to Energy Consumption Changes
7.3.1 Introduction
As shown by Chance and Williams [1, 4], the activation of the mitochondria by increased ADP is coupled with oxidation of NADH (decreased NADH levels), and is known as the state 4–state 3 transition in isolated mitochondria. Most of the investigations in this field of tissue activation were done on neuronal tissue in vivo. However, studies of other organs, such as the heart or skeletal muscle, were conducted as well. As was shown in Fig. 2.2, the demand for energy (ATP) by various tissues is dependent on the specific tasks of each organ or tissue. Nevertheless, the stimulation of mitochondrial function is common in all tissues in the body. We describe the effects of tissue activation on NADH fluorescence under normoxic conditions as well as during limitation of O2 supply in the tissue (hypoxia, ischemia).
7.3.2 Direct Cortical Stimulation
Direct cortical stimulation of the cerebral tissue is the less drastic event affecting the energy requirement of the tissue, as compared to epileptic activity or cortical spreading depression. Rosenthal and Jobsis correlated the effects of direct cortical stimulation on the fluorescence of the intact cerebral cortex [101]. A small but significant oxidation of NADH was recorded, depending on the stimulation parameters. Figure 7.36 shows the monitoring arrangement (a) and response of NADH fluorescence to direct cortical stimulation in the cat brain (b, c). A clear oxidation of NADH was recorded during the stimulation period.

Fig. 7.36
a Diagrammatic representation of the procedure for recording fluorescence and reflectance simultaneously on same cortical field that is responding electrically to direct cortical stimulation. The epiilluminator and microscope lens are in focus approximately 33 mm above the preparation, allowing stimulating and recording electrodes to be angled into the field. One recording electrode and a forked pair of stimulating electrodes are shown. b A sample of the fluorescence and reflectance response to 10-Hz stimulation presented for 1 s every 20 s at an intensity of 10.8 V and 0.8 mA. Fluorescence is shown on top and reflectance on bottom. Traces are redrawn from the original Offner kymograph record. c Electrical and averaged fluorometric responses with increasing stimulus voltages. Left member of each pair is electrical response to a 1-s train of stimuli at 10 Hz. The slow recording speed allows a view of the (d–c) potential shift that appears to result from the summed aftereffect of the individual evoked responses. Right column shows averaged 10 fluorometric responses. (© American Physiological Society, reprinted with permission [101])
The same results were obtained when trains of stimuli were applied to the hippocampus of cats [102] (Fig. 7.37). The experiments reported here were undertaken to measure simultaneously, in the cat brain, changes in oxygen consumption and NADH fluorescence resulting from short trains of direct cortical stimulation. Additionally, in a small number of experiments, changes in extracellular [K+]o, were monitored with a potassium sensitive microelectrode to further study the relationship between [K+]o changes and oxidative metabolism [102–104]. The experimental setup is presented in Fig. 7.37a and typical responses to direct cortical stimulation are in Fig. 7.37b. A clear oxidation of NADH was recorded during the stimulation period. A coupling between extra cellular K+ and the decrease in NADH fluorescence has been documented.

Fig. 7.37
a Experimental arrangement. Sagittal sinus blood flows through oximeter to drip chamber. Diagonally shaded area centered over stimulating electrodes represents area monitored fluorometrically. b Typical responses of measured variables to direct cortical stimulation. Stimulus trains indicated by artifacts in ECoG (first train is 3 Hz and second is 6 Hz). Arrows serve as calibration bars and indicate direction of increased light intensity. Note that a decrease in NADH fluorescence (460–529 mm) channel indicates increase in oxidative activity corresponding to oxidation of NADH. Lowest line (Rel. O2 consumption) is calculated oxygen consumption rate corrected for latencies in measured parameters and calibrated for a 10 % increase with respect to baseline. Immediately after stimulus trains, both fluorescence and calculated oxygen consumption indicate increased oxidative activity. In ECoG, channel negativity is upward. (© Reprinted with permission from Elsevier, [105])
This type of study has been later repeated by other investigators who found the same basic pattern of responses. Namely, in the normoxic brain, NADH became oxidized under stimulation [20, 75, 76, 103, 105–109]. LaManna et al. [110] found that intensive direct cortical stimulation of the hypoxic cerebral cortex resulted in NADH elevation instead of the typical oxidation (decrease).
7.3.3 Brain Activation by Epileptic Activity
The first detailed report on the influence of epileptiform activity on brain cerebral cortex mitochondrial NADH redox state was published by Jobsis et al. in 1971 [9] (Fig. 7.38). Using anesthetized cats exposed to an epileptogenic drug (metrazol or strychnine), a marked expected oxidation of NADH was recorded. Synchronization of the electrical activity increased the demand for energy to restore ionic homeostasis disturbed by epileptic activity. They had proved that brain hypoxia or anoxia did not develop during the epileptic activity and were not the reason for the termination of bursting. A year later, the same group found similar responses under exposure of cat hippocampus to penicillin [111]. During the seizures, the decrease in NADH was the result of its oxidation and not because of a decrease in NAD+ reduction. The connection between the concentration of K+ and the decrease in mitochondrial NADH was shown in cat hippocampus [112]. The effect of seizures on mitochondrial NADH was investigated later on by other groups, mainly in cat models [46, 59, 69, 103, 106, 109, 113–119]. Vern et al. showed that epileptic activity, induced in hypotensive cats, caused an increase in NADH instead of a decrease [117].

Fig. 7.38
Fluorescence response to convulsive activity with compensation for vascular quenching effects. In left panel, the paralyzed, anesthetized animal is ventilated with room air. Right panel shows signals in absence of vascular response after cerebral blood flow has been greatly enhanced by relaxation of vessels by ventilation with high pCO2. Note that the difference trace has been amplified by additional factor of 3×. (© American Physiological Society, reprinted with permission [9])
In 1975, we published our first paper on mitochondria NADH responses to epileptic activity measured in nonanesthetized rats [8]. The netrazol was applied epidurally to the surface of the rat brain (Fig. 7.39a). Metrazol (100 mg/ml) was applied epidurally using the cannula shown in Fig. 4.17. The typical response to metrazol occurs 3–5 min after the administration of the drug (Fig. 7.39a). The metrazol was applied to the right hemisphere and the left one served as a control. After application of the metrazol an increase in electrical activity was recorded and as a result an oxidation of NADH that was in the range of 5–10 % of the normoxic level. After a period of a very intense activity, the EEG became isoelectric whereas the NADH showed a very large oxidation cycle which then recovered to the normoxic level. In some animals a different response was recorded (Fig. 7.39b). In these cases a small oxidation under metrazol effect was recorded but the recovery to the normoxic level showed no large oxidation cycle. The reflectance changes were very small during the effect of metrazol.

Fig. 7.39
Effects of metrazol on brain NADH fluorescence, 366-nm reflectance, and EEG of the two hemispheres. Note that amplitude of EEG calibration in right hemisphere is 1 mV. Typical response is shown in a. b Another type of response to metrazol applied 10 min before record was taken. (© Reprinted with permission from Elsevier [8])
Under hypoxia induction (by 10 %, 7.5 %, and 5 % O2), the typical oxidation of NADH during epileptic activity took place, but the curve shape was modified [8]. In most of our studies, we found that the response to epileptic activity was followed by a wave of cortical spreading depression [3, 38, 120, 121]. We found a similar coupling of NADH oxidation with CSD development, when epileptic activity was developed by oxygen toxicity induced by exposing the rat to hyperbaric oxygenation [32, 33, 36, 37, 43].
Figure 7.40a presents the progression of seizure activity in a special strain of gerbils, developing epileptic effects as a result of monotonic noise or other factors [122]. As seen in the figure [13], the exposure of the awake gerbil to noise resulted in the development of epileptic activity followed by a CSD wave. The coupling between the two pathological events is clear, and is manifested by the electrical activity (ECoG) as well as extracellular K+ levels and NADH redox state. During the epileptic stage, extracellular potassium increased and started to recover to the baseline, but then a larger elevation was recorded. There is a clear correlation between the various parameters during epilepsy and CSD. The decrease in NADH was smaller during the first stage, followed by an oxidation cycle typical for CSD.

Fig. 7.40
a Development of epileptic activity followed by cortical spreading depression (CSD) in brain of seizure-prone gerbil. ECoG electrocorticogram, pO 2 partial pressure of O2 in tissue, EK + , DCK + extracellular potassium and DC steady potential measured around K+ electrode, R, F, CF reflectance, NADH fluorescence, and corrected NADH fluorescence, respectively. (© American Physiological Society, reprinted with permission [13].) b Effects of partial ischemia (bilateral carotid artery occlusion) on metabolic, ionic, electrical responses to metrazol injection in awake rat. (© John Libbey, reprinted with permission [38])
The effects of partial brain ischemia on the responses to epileptic activity are shown in Fig. 7.40b [38]. In this rat, the two carotid arteries were ligated 20 h before the experiment. During the intense electrical activity, K+ increased in the extracellular space and then spreading depression developed. The main effects of the ischemia are on the recovery process as a result of the slow delivery of oxygen to the cells.
pO2 showed a decreased cycle, indicating that the compensatory mechanism of increased blood flow is impossible, as measured also by the increased reflectance. The short oxidation cycle of NADH found in the normoxic brain is very unclear in the ischemic brain. The slow supply of energy caused the recovery of K+ into the cells to be much slower as compared with normoxic brain. The electrical activity of the brain was also affected, as could be seen in the slow recovery of the ECoG and DC traces after the SD episode.
To develop a status epilepticus (SE) in the rat, we repeatedly injected metrazol (Fig. 7.41a, b) [123]. The typical response of the rat brain to metrazol injection is presented in Fig. 7.41a. Metrazol was injected four times until SE developed. Immediately after the first injection of metrazol, a wave of spreading depression (SD) developed. The SD wave was characterized by depression of ECoG activity, decrease in DCK+ potential, increase in extracellular K+ level, reflectance, and CBF, and oxidation of mitochondrial NADH. Later on, many convulsions and SD waves developed. In some of these convulsions, part of the parameters stopped responding, and at the waves that developed close to death, NADH was reduced (not shown in this figure) and not oxidized (flipped NADH).
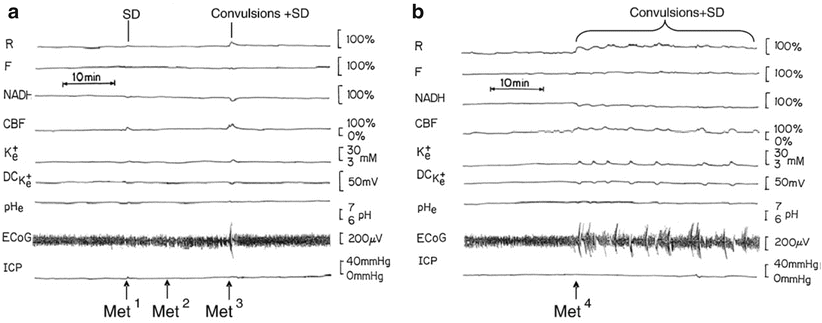
Fig. 7.41
Typical experiment in which status epilepticus (SE) was induced by four injections of metrazol. a First injection of metrazol induced one wave of SD. Second injection induced no changes. Third injection yielded SD waves with convulsions; only after the fourth metrazol injection status was epilepticus achieved (b). (© Reprinted with permission from Elsevier, [123])
7.3.4 Responses to Cortical Spreading Depression
The discovery of brain cortical spreading depression (CSD) [17] was made by Aristides Leao in 1944 (Fig. 7.42). After cortical stimulation he showed that a wave of EEG depression propagated from the stimulation point to the rest of the stimulated hemisphere. In parallel to EEG depression, the steady electrical potential shows a negative shift (Fig. 7.43c) [124].


Fig. 7.42
The first paper that described the development of cortical spreading depression was published by Leao. Gradual spread of depression from a to f. Electrodes arranged as shown in the inset (a): before stimulation (L) and 7 min after (K). In this and following figures, when a strip is timed, that time indicates the interval from end of stimulation period. Upward excursions in the records denote negativity of the more frontal electrode (lower number) with respect to the more occipital electrode (higher number). Unless otherwise mentioned, the stimuli were induction shocks at “tetanizing” frequency, applied for 3–5 s. through electrodes S. (© American Physiological Society, reprinted with permission [17])
Fig. 7.43
a Control before stimulation (left side). Large vessel is an artery about 120 μm diameter. Wave of depression has reached the region where diameter of artery is approximately doubled (right side). b Graph showing time-course and magnitude of arterial vasodilatation attending a depression. (© American Physiological Society, reprinted with permission [245].) c Representative experiment on slow-voltage variation accompanying spreading depression of activity. Curve was drawn from voltage readings taken at 5-s intervals. Upward deflection denotes negativity of cortex, with respect to extracortical reference electrode. Electrodes arranged as shown in inset (s stimulating electrodes). Stimulation, 5 s of “tetanizing” current from nduction coil, is delivered at time marked S. In this representative curve is indicated time of occurrence (from A to B) of specific electrical activity that often develops during depression of “spontaneous” activity. (© American Physiological Society, reprinted with permission [124])
It has become clear that the wave of depolarization passing through the tissue increases energy consumption [17]. Figure 7.43a, b shows the effects of the CSD wave on the diameter of the blood vessels on the surface [125]. The involvement of the microcirculation in response to CSD was described by Van Harreveld and colleagues few years after the discovery of the phenomenon [126, 127]. In other studies the measurements of PO2 in the brain had indicated that demand for energy and oxygen consumption increased during the CSD wave [128–130]. To understand the reason for the large increase in oxygen consumption during CSD, Bures and Krivanek [131] used a special approach to check ion shift in the rat cortex and showed that extracellular potassium is elevated [132]. In the early 1970s, Vyskocil et al. used a potassium-selective microelectrode and showed clearly that extracellular K+ was significantly elevated [133].
It is very important to use the appropriate terminology when discussing CSD and hypoxia or ischemia. The discovery of the CSD event happened when rabbit brains were exposed to electrical stimulation to elicit “experimental epilepsy.” The rabbits were breathing normally and oxygen supply to the brain was normal. Under ischemia, the EEG is also depressed as soon as the oxygen supply to the brain is limited, but the mechanism behind the EEG depression is different from that operating in CSD. I discuss this issue later in this chapter (Fig. 7.60).
The effects of CSD on brain mitochondrial NADH were first described in 1973, by Rosenthal and Somjen, where a clear oxidation wave was recorded [18]. Figure 7.44 shows the response of the cat brain to a wave of CSD [18].

Fig. 7.44
Optical and electrical responses associated with spreading depression of the somatosensory cortex. FL fluorescence; second trace Ref reflectance; third trace (F − R) corrected fluorescence or difference between F1 and Ref; fourth trace electrical potential 0.4 mm below cortical surface; lowermost trace electrical potential 2 mm below surface. Calibrations of optical signals in percent of full scale (sixth trace) is electrocardiogram lead from more superficial electrode (0.5-mm depth) at high gain (see calibration) and with condenser-coupled amplifiers. Bursts of electrical activity seen before onset of depression and after recovery are from ‘spindle bursts’ recorded on condensed time scale. The wide band of pen oscillation, seen in the high-gain electrical tracing running through entire figure including depressed phase, is caused by electrical interference, mainly from the high-voltage AC supply of arc lamp of optical system [9]. Three minutes preceding the point of left-hand margin of this figure, the VPL nucleus of the thalamus was stimulated. This episode of spreading depression may have been provoked by that stimulation or it may have occurred spontaneously. (© American Physiological Society, reprinted with permission [18])
Figure 7.44 shows the electrical potential at two different cortical depths and the optical signals recorded during an episode of spreading depression. The SP recorded at both depths shifted initially in the positive direction by approximately 1 mV. During this initial positive phase, both uncorrected and corrected fluorescence traces were already declining, while the reflectance signal rose slightly.
In the same year [7] we showed the same NADH oxidation response to CSD initiated in the rat brain (see Chap. 5, Fig. 5.4).
A year later, we demonstrated the coupling between the elevated extracellular K+ induced by CSD and the greater ATP requirement (NADH oxidation) needed to recover the normal ionic homeostasis [104]. In the same year we studied in detail the nature of the NADH response to CSD (Fig. 7.45a) [19].

Fig. 7.45
a Repetitive response of brain to spreading depression evoked by application of 0.4 M KCl on dura. Third trace is on expanded amplitude scale. Arrow direction shows increase in optical signals. Time proceeds from left to right. b Response of brain to application of 0.3 M KCl solution, epidurally. Three cycles of oxidation of NADH were developed. Arrow direction shows increase in the optical signals. Note that third trace is on expanded scale. Time proceeds from left to right. (© Reprinted with permission from Elsevier [19])
To initiate a wave of spreading depression (SD), KCl solution was passed through one of the pairs of tubes located above the dura mater. At threshold (~0.1 M KCl), only one wave of SD developed, whereas at maximum (~0.4 M KCl) many cycles were observed. Figure 7.45a represents the latter condition, in which six SD waves developed by 0.4 M KCl were terminated by washing the brain surface with 0.9 % NaCl. Attention is drawn to the second trace from the top, which shows a series of NADH fluorescence decreases and increases during each wave of SD, corresponding to states 4–3–4 transitions, and may be correlated with varying energy demand during the SD cycle. Five of the six cycles are identical and are closely synchronized with changes in electrical activity.
Application of 0.3 M KCl produces three separate waves of SD (Fig. 7.45b), which are again stopped by NaCl washing. In these three cycles, the initial phase of each response shows a short increase in the fluorescence signal. The subtraction of the reflectance trace from the fluorescence at a 1:1 ratio gives (in the third trace from the top) three symmetrical cycles of NADH oxidation and reduction. Although it is possible that there are geometric problems about the interpretation of the exact timing of the electrical waves with respect to the optical data, it is of interest to note that the maximal mitochondrial activity occurs near the nodes of the SD waves.
To test the hypothesis that CSD wave recovery is dependent on the availability of oxygen, another experiment was designed (Fig. 7.46) [8]. The effects of anoxia on the spreading depression were measured in slightly anesthetized rats. The broken straight line shows a reference arbitrary line that was very close to the normoxic level. Fig. 7.46a shows a typical oxidation cycle obtained by using a threshold amount of KCl (0.1–0.2 M). Figure. 7.46b shows the typical response to the N2–O2 breathing cycle with no KCl addition. The decrease in NADH during the SD cycle was about 20 % whereas the increase during the N2 cycle was about 45 % in comparison to the normoxic level. Figure 7.46c–h shows the effect of N2 given to the animal after various intervals from the time that KCl was applied. Figure 7.46h shows the N2 cycle separated from the SD cycle, which, in practice, is the same as Fig. 7.46a, b. Even in Fig. 7.46g, the reduction of the NADH (increased signal) was achieved after N2 application. In Fig. 7.46f, e, d, c, in which N2 was applied at different stages of the SD cycle, the level of NADH reduction was about 30–40 % lower in comparison to Fig. 7.46b, g, h. In Fig. 7.46f, e, d, only a portion of the SD cycle was completed before the N2 was applied. In Fig. 7.46c the oxidation cycle was blocked completely by nitrogen.

Fig. 7.46
Response of corrected fluorescence signal to spreading depression, N2–O2 breathing cycle, and the interaction between these two events. Broken line represents reference line for comparison between different experiments A–H. C–H represent variations of the phase relationship of SD wave and N2–O2 breathing cycle. (© Reprinted with permission from Elsevier [8])
The recovery of the brain after an episode of SD is dependent upon energy availability. If energy production is in the normal range, pumping of potassium into the cells starts immediately and its level recovers back to 3 mM. When energy production is inhibited, the pumping of K+ is prevented (Fig. 7.47) [16]. In this animal, waves of SD developed spontaneously at a certain stage of the experiment (after a few hypoxic episodes), and the left side of the figure shows the regular response to SD. The efflux of K+ reached a level of 14–15 mM and was then pumped back into the cells; the NADH (CF) shows a clear oxidation cycle (see Fig. 7.46). In the second SD event shown in Fig. 7.47, hypoxia was induced at the beginning of the recovery period and the recovery process was inhibited until 100 % O2 was again given again to the rat.

Fig. 7.47
Effects of hypoxia (4 % O2) on metabolic, ionic, and electrical responses to spreading depression (SD) developed spontaneously. (© Reprinted with permission from Elsevier [16])
Figure 7.48 shows the use of a multiparametric system that includes a laser Doppler flowmeter to record microcirculatory blood flow [134]. As seen, two sets of responses to SD were recorded after 0.1 M KCl application to the surface of the brain 2 mm anterior to the MPA. A clear correlation between the oxidation of NADH (CF) and large increase in relative CBF can be seen during the six cycles recorded. The changes in relative CBF are calculated in relationship to the control values before the waves were initiated, and in this animal it was four- to fivefold higher. The cycles of SD were not so clear on the volume trace, and we suspect it was a reading problem, as in other studies a clear connection between flow and volume was found using the same laser Doppler flowmeter.

Fig. 7.48
Metabolic hemodynamic, ionic, and electrical responses to cortical spreading depression measured in rat brain. The MPA used in this study contained two different bundles of fibers for monitoring the relative CBF and NADH redox state. R, CF reflectance and corrected fluorescence, LD F LDv laser Doppler flow and volume monitored from another optic fiber located in MPA, ECoG electrocorticogram, K + e , ECa 2+ , Ca e 2+ corrected potassium, uncorrected, and e a e corrected calcium ion concentrations, respectively, DC K+ , DCca 2+ DC steady potential around K+ and Ca2+ electrodes. (© Walter de Gruyter, reprinted with permission [134])
This coupling, illustrated in Fig. 7.50 [135], suggested that upon stimulation of Na+/K+-ATPase, the released ADP will be recovered by the mitochondria to ATP. This stimulation of the respiratory chain will increase oxygen consumption and, consequently, blood flow will increase to compensate for the extra oxygen needed.
To correlate the effects of CSD on NADH, CBF, and oxygen consumption, the following experiment was performed and is described in detail [136].
The aim of this study was to determine the local changes in O2 supply, O2 consumption, and oxygenation during the passage of a wave of spreading depression. We combined in vivo monitoring techniques (NADH redox state, extracellular K+, and DC potential) with single-point measurements (cerebral blood flow and O2 consumption) to assess the effect of spreading depression waves in anesthetized rats. We continuously monitored the NADH redox state as well as extracellular K+ and DC potential from three cortical regions. After identification of the spreading depression wave, we determined cerebral blood flow. We used a micro-spectrophotometric technique to measure regional cerebral arterial and venous O2 saturation [137–139].
Using this approach, we were able to calculate O2 consumption and cerebral blood flow in different brain regions representing the before, during, and after spreading depression wave areas and compared them with a contralateral control area. In vivo monitoring was used to localize the spreading depression wave in real time throughout the cerebral cortex. To monitor in vivo, in real time, the NADH redox state, extracellular K+ activity, and DC potential from three brain regions, we constructed a special MPA shown schematically in Fig. 7.49a, b. The Plexiglas holder contained the following holes: three holes of 1.2-mm diameter for the common part of the light guide; three holes of 1.5-mm diameter for the 1.2-mm-diameter K+ electrodes. The clearance between the K+ electrode and the hole contained physiological saline and was connected to the DC potential electrodes. The K+ and DC electrodes were connected to an electrode holder containing an Ag/AgCI pellet (WPI; New Haven, CT, USA) and was sealed with epoxy glue. The electrodes as well as the light guides were cemented to the Plexiglas holder with epoxy glue. The testing and calibration of the electrodes were similar to those published previously [23, 140].

Fig. 7.49
Schematic presentation of the multiprobe assembly (a) and its location on rat brain during monitoring phase (b): NADH1–NADH3, light guides for NADH monitoring; K1–K3, mini-electrodes for extracellular K+; DC1–DC3, DC steady potential electrodes; KCl, application of KCl for spreading depression initiation. c Response of brain to wave of spreading depression induced by application of 1 M KCl to frontal cortex. R(1)–R(3) 366-nm reflectance, CF(1)–CF(3) 450-nm corrected NADH fluorescence, K + e(1) and K + e(2) extracellular K+ levels. DC(1) and DC(2) DC steady potential. (© Reprinted by permission from Macmillan Publishers Ltd. [136])
A factorial analysis of variance was employed to assess differences between the various regions examined (before, during, and after the wave as well as contralateral cortex) for cerebral blood flow, O2 extraction, and O2 consumption. The statistical significance of differences was determined by Duncan’s procedure. A p value < 0.05 was accepted as significant. Figure 7.49c shows the typical responses of the brain to a wave of spreading depression passing over the right cerebral hemisphere of an anesthetized rat. Only two K+ and two DC potential traces are shown. The upper six channels represent the three monitored areas for the NADH redox state. Each measuring point provided two signals: namely, 366-nm reflectance (R) and uncorrected NADH fluorescence (F).
For each site, we present the reflectance signal and the corrected NADH fluorescence signal. In response to epidural application of 0.5 M KCl anterior to the MPA, two sets of waves were recorded. The reflectance signal shows the typical biphasic response, namely, an initial increase followed by a longer decrease that recovered to the baseline level. The corrected NADH signal showed a clear oxidation (decrease) cycle having a peak of 20 % change as compared with the normoxic control value. The same kind of response was monitored in the various sites where NADH was monitored (R2, CF2, R3, and CF3 in Fig. 7.49c). The lower four traces present the changes in extracellular K+ (K+ e) and the DC potential measured from two sites on the cortex parallel to sites 1 and 2 of the monitored NADH. The ring of the DC electrode shows the initial negative shift response followed by a large increase in K+ e. The circular configuration of the DC electrode around the K+ electrode led to some inaccuracy in the K+ measurements. Because, in the present study, we used the K+ measurements as an indicator of the passage of the spreading depression wave, this factor was not critical in the determination of the wave location. To calculate the speed of the wave propagation, we used the difference in the DC charge appearance at sites 1 and 2 during the terminal wave, which was used for cerebral blood flow and O2 consumption measurements. The average speed of propagation was 3.7 ± 0.8 mm/min (range, 2.5–5.0 mm/min). Extra oxygen supply or compensation can be achieved by either an increase of CBF, enhanced O2 extraction, or both. In this study, we showed that concomitantly to NADH oxidation and extracellular K+ changes, CBF doubled although the oxygen extraction ratio remained the same [136]. The results indicated that the oxygen supply under CSD was regulated by an increase in CBF.
As our group has published the majority of papers dealing with mitochondrial NADH and CSD, we start the discussion by describing papers published by others. One of the leading groups, headed by Frans Jobsis, published a number of studies showing the effects of CSD on brain energy metabolism [18, 103, 106, 110, 141, 142]. Several works have been published by Chance and collaborators [70, 143, 144], in addition to those done in collaboration with Mayevsky. The group led by Dora published two papers in this field [46, 75]. Rosenthal and Martel [145] showed that ischemia affected the response to CSD; namely, instead of NADH oxidation, an increase in NADH was recorded (see also Fig. 7.57). Hashimoto et al. used fluorescence imaging to characterize NADH changes in CSD [146].
The results accumulated in our many studies on CSD and brain functions led us to formulate a possible explanation to the events that occurred during the CSD wave (Fig. 7.50).

Fig. 7.50
A possible mechanism showing cascade of events developed during spreading depression event (see text for details). (© World Scientific, reprinted with permission [135])
Spreading depression (SD) is a phenomenon initiated by a rapid depolarization of neuronal tissue in the gray matter of the cerebral cortex (Fig. 7.50, lower left side) detected by the depression of the EEG and a negative shift in the DC steady potential. A massive redistribution of ions between the intracellular and extracellular spaces led to the large increase in extracellular potassium, and this activated the Na/K-ATPase to pump the potassium back to the intracellular space. The increase in ADP level shifts the mitochondrial state to state 3 and NADH becomes more oxidized. The increase in oxygen consumption by the mitochondria creates an elevation in CBF. In most cases the microcirculatory hemoglobin saturation is elevated. The elevation of extracellular potassium may create a vasoconstriction response, but the increase in NO release probably enabled the elevation of CBF.
To test the sequence of physiological events during the CSD wave, we developed a special experiment (Fig. 7.51a) [147].

Fig. 7.51
a Schematic presentation of special multiprobe assembly (MPA) developed to study responses to cortical spreading depression. Right side shows MPA located on the cerebral cortex. Localization of the various sensors is shown on left side. LDF light guide connected to laser Doppler flowmeter, NADH light guide connected to the fluorometer–reflectometer for NADH fluorescence and 366-nm reflectance, E K selective K electrode, DC direct current, KCl push–pull cannula, ECoG electrocorticography electrodes. R values represent radii of the particular probes. b Typical responses of normoxic rat brain to cortical spreading depression (CSD). R, NADH 366-nm reflectance and corrected NADH fluorescence. CBF, CBV cerebral blood flow and volume measured by laser Doppler flowmeter. E K potential of potassium electrode and DC-corrected level of extracellular K (mM), DC direct current. (© Reprinted with permission from Elsevier [147])
Because CSD wave propagation is a multifactorial event, our strategy was to construct a multiprobe assembly (MPA) containing probes to evaluate most of the parameters involved during CSD wave propagation from its front line at the same time. This construct will verify the parallel changes in the various parameters after CSD initiation and help us to identify which parameter(s) start the chain responses and the reaction of the later responses. The MPA measured extracellular K concentration [K+]e, mitochondrial NADH/NAD ratio, cerebral blood flow and volume (CBF and CBV), steady DC potential, and bipolar electrocorticography (ECoG). The technical details were published in 2000 [147].
The typical response to CSD shown in Fig. 7.51b presents the relationship between electrical (DC), ionic, metabolic, and hemodynamic responses during the passage of a single wave. The negative shift seen in DC was also noticed in the K trace as an initial decrease in potassium. A clear oxidation in the NADH redox state (decreased signal) was accompanied by a large increase in CBF. It is important to note that the edge of the various probes was positioned on the same front line.
Using the special MPA in this study, we were able for the first time to prove the sequence of events during the changes in cortical blood flow and extracellular K during spreading CSD wave propagation. The other aim was to present the interrelation between CBF and NADH during the various phases of its propagation. As was found, the time to the decreased peak in CBF was initial to the increased peak in NADH during the first phase. The opposite interrelationship can be seen in the later phase where a decrease in NADH was noticed parallel to the increase in CBF. The simultaneous and opposite changes between NADH and CBF were found to be more interrelated when O2 delivery was limited. These results may indicate an increase in the correlation between CBF and NADH under limited oxygen supply conditions, which is observed after increasing O2 demand by CSD.
7.3.5 Activation of the Brain Under Restricted Oxygen Supply
Our group has published more than 50 papers (Table 7.1) on the relationship between mitochondrial NADH redox state and brain activation under CSD. We reported the development of CSD in the brain exposed to head injury [148].
To mimic the in vivo CSD event under restricted oxygen supply, we used a brain hippocampus slice preparation monitored in vitro and exposed to high potassium levels [149]. Figure 7.52 shows the responses to anoxia, high potassium, and norepinephrine of the NADH as well as the reflectance signal.

Fig. 7.52
a Top: Schematic diagram demonstrating arrangement of experimental system. Excitation light is conducted via a y-shaped quartz fiber guide placed on surface of hippocampal slice. Changes in intensity of fluorescence and reflectance of tissue are continuously monitored by separate photomultipliers (PM) and recorded on a Grass polygraph. A stimulating electrode (right) and a recording electrode (left) are placed on the slice to record extracellular population response to stimulation of the Schafer-collateral-commissural path. Specimen record of average response to stimulation is presented on left. Viability of the tissue is occasionally measured by recording population responses to stimulation of the slice. Bottom: Representative records of changes in reflectance and fluorescence upon superfusion of a slice with N2-saturated medium for the duration indicated by horizontal bar. Upward deflection indicates increase in optical signal for this and subsequent figures. All optical changes are presented as percent of full-scale values (see text). b Right side: Comparison between responses of reflectance (R), fluorescence (F), and corrected neuroscience (CF) signals to 50 mM K′ in glucose-containing medium (A) and in pyruvate-containing medium (C). Note presence of significant smaller increase in CF in presence of pyruvate. B CF changes produced by replacement of glucose by pyruvate. D CF responses of same slice (reflectance and fluorescence signal not presented) to NE in presence of pyruvate. Time interval between K superfusion and NE superfusion was 15 min. (© Reprinted with permission from Elsevier [149])
The slice preparation presents some advantages in comparison with the intact brain for the metabolic studies already mentioned. The advantage gained through perfusion of the tissue is that kinetic considerations are simplified by a continual provision of fresh media to the tissue, which prevents accumulation of metabolic products in the incubation media. The hemoglobin-free perfused hippocampal slice provides a useful preparation for fluorometric studies. Hemodynamic artifacts such as changes in hemoglobin oxygenation and shifts in blood volume, which interfere with the in vivo fluorescence measurement, are absent. However, upon exposure of the tissue to anoxia (Fig. 7.52, left side) as well as to elevated concentrations of K+ (Fig. 7.52, right side), changes in light scattering, as measured by the reflectance signal, did occur. As both anoxia and high K+ depolarize the cell membrane, the observed decrease in reflectance probably reflects an increase in cell volume that follows membrane depolarization. To eliminate the interference of reflectance changes with the fluorescence measurement, we used the correction technique described in Chap. 4. This technique was shown to compensate appropriately for reflectance changes in the slice preparation. Thus, the larger portion of the observed corrected fluorescence responses reflect the changes in fluorescence, that is, in the NADH redox state.
In our studies we used two methods to decrease oxygen supply to the brain while exposing the brain to an increased oxygen demand: systemic hypoxia or local brain ischemia.
The effects of hypoxia on the response to epileptic activity induced by metrazol is shown in Fig. 7.53 [8].

Fig. 7.53
Effects of graded hypoxia on response of awake brain to local application of metrazol. Fluorescence responses occur 3–5 min after application of metrazol. Broken line (N.L.) represents normal oxidation–reduction state of NADH. Levels of O2 were air (a); 10 % (b); 7.5 % (c); 5 % (d). (© Reprinted with permission from Elsevier [8])
Matrazol was applied as earlier but under hypoxic condition. Figure 7.53 shows the typical results. The animal was exposed to air (a), 10 % O2 (b), 7.5 % O2 (c), and 5 % O2 (d). The line ‘N.L.’ represents the normoxic level of NADH. In all oxygen concentrations an increase in activity was followed by a flat EEG. The changes in NADH are the same as in Fig. 7.40, namely, that two phases in oxidation were found. By giving the animal lower concentrations of O2 the baseline shifted to a more reduced level, depending on the O2 level.
The effects of hypoxia on the response to CSD are presented in Fig. 7.54.
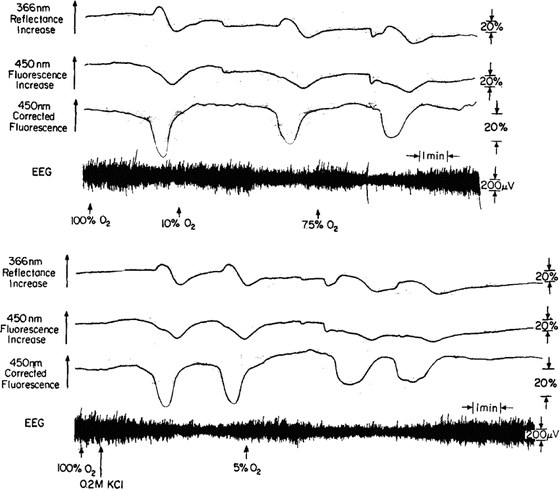
Fig. 7.54
Effects of various levels of oxygen in inspired air on response of awake brain to spreading depression. Upper part shows response to three levels of O2. In lower part animal was exposed to 100 % and 5 % oxygen. (© Reprinted with permission from Elsevier [8])
Results obtained in another rat are shown in Fig. 7.54 [8]. In the upper part, the three cycles were obtained under 100 %, 10 %, and 7.5 % O2, whereas in the lower part, two pairs of cycles were obtained under 100 % or 5 % O2. When the content of O2 in air was reduced, the amplitude of the oxidation cycle was smaller although the cycle duration was longer. The baseline level of NADH became more reduced by giving the animal less O2. The lower part shows the similarity between two cycles obtained at 100 % O2 and at 5 % O2. In the hypoxia experiments, data of 11 animals were used for the calculation.
The effects of partial ischemia on the response to CSD are shown in Fig. 7.55 [121].

Fig. 7.55
The effect of carotid arteries ligation on the response of NADH levels and ECoG to cortical spreading depression. The arrows (right and left) show the time of ligation. Part (b) is a direct continuation of A. (© reprinted with permission from Elsevier, [121])
To study the effects on the metabolic response of the brain resulting from limitation of its blood supply, the carotid artery ligation technique was used. The common carotid arteries were dissected in the neck, and loops of ligature were placed around the vessels. The ends of the ligatures were taken out through the wound so that it was possible later to close the arteries while the monitored rat was awake. Measurements of NADH oxidation–reduction state from the cortex were taken by implantation of a light guide holder above the right hemisphere of the brain. Initiation of spreading depression (SD) cycles was achieved by flushing KCl solution through a small push-pull cannula implanted above the right hemisphere so that NADH fluorescence measurements were taken at the same time. The distance between the application site of KCl and the light guide location was only 4–5 mm. KCl was applied topically to the cortex and NADH fluorescence and ECoG measurements were taken.
This response represents the normal brain and served as a control. Three hours after the operation when the animals were fully awake, the carotid arteries were ligated.
Figure 7.55 shows the response of an awake cortex to a bilateral carotid artery ligation. Before ligation, 0.5 M KCl was applied to the cortex and the normal metabolic response to spreading depression was recorded (Fig. 7.55a). The bilateral ligation of the carotid arteries caused an increase in NADH, and because the KCl remained on the cortex during this period (about 3 min), the response to SD was immediately apparent. In this particular animal, the duration of the oxidation cycle became very long after the ligation, as a response to spreading depression. A similar long oxidation cycle was recorded again later (lower Fig. 7.55b), but within 2 h the metabolic response to SD disappeared (not shown)
The effects of ischemia on the response to CSD are dependent upon the time interval between ligation of the carotid arteries and induction of the CSD wave.
Effects of acute bilateral ligation on the response to CSD are presented in Fig. 7.56 [150].

Fig. 7.56
a Effect of acute bilateral carotid occlusion on metabolic response to cortical spreading depression (SD). b, c, d Measured 15 min, 90 min, and 18 h after occlusion, respectively. (© Reprinted with permission from Elsevier [150])
In this set of experiments ten rats were involved. Figure 7.56 shows a typical response of the brain to acute bilateral carotid artery ligation. Figure 7.56a shows the response of NADH to spreading depression and the effect of ligation on the steady-state level of NADH. Figure 7.56b–d shows the response of NADH to spreading depression elicited at 15 min, 90 min, and 18 h, respectively, after the ligation.
In this particular animal the changes of the reflectance (upper trace in each part) was minimal during the spreading depression cycles. In Fig. 7.56d one can see very clearly the very long biphasic cycle of the reflectance. The effect of ligation on the oxidation–reduction state of NADH was transient; namely, a small increase was recorded during the ligation, but within 2 min it recovered to the baseline. The main effect of the ligation is on the response of the brain to spreading depression, which increases oxygen utilization. During the first 60 min after ligation, the oxidation cycle can be detected as a response to SD, but the amplitude of the oxidation (decrease) was diminished and the duration of the cycle became much longer (almost 4 min in Fig. 7.56b and only about 2 min in Fig. 7.56a). The qualitative change in the response of the brain to SD began several hours after the ligation. In Fig. 7.56c one can see the response to SD 90 min after the ligation. The uncorrected trace, as well as the corrected one, shows a biphasic response of NADH to CSD. At the beginning of the cycle an increase in NADH was recorded, whereas afterward the NADH decreased below the baseline level. In Fig. 7.56d (18 h after ligation), the response of the brain was completely opposite to that measured before the ligation (Fig. 7.56a). It seems that instead of an ‘oxidation cycle’ as a response to SD, we found a ‘reduction cycle.’ In this animal the correction of NADH for hemodynamic changes is not necessary, and the uncorrected trace also shows the same results.
Figure 7.57 [39] illustrates schematically the difference in response to CSD recorded in the normoxic (Fig. 7.56a) and ischemic brain (Fig. 7.56b).

Fig. 7.57
Metabolic responses of normoxic (a) and ischemic (b) brain to wave of spreading depression developed at postictal period under HBO conditions. R 366-nm reflectance, CF NADH corrected fluorescence. (© European Underwater & Baromedical Society, reprinted with permission [39])
The effects of ischemia on the NADH redox state and extracellular potassium clearance during CSD are shown in Fig. 7.58 [118].

Fig. 7.58
Effects of reversible bilateral carotid artery occlusions on cortical NADH florescence and [K+]o during pentylentetrazol seizures. Intervals between arrows indicate periods of occlusion. a Control seizure. b Occlusion after seizure termination causes an abrupt increase in NADH and slowing of [K+]o removal. Release of occlusion reverses these effects. c Occlusion made during course of a seizure and maintained after seizure ends causes a transient increase in [K+]o and slowing of postictal [K+]o removal. d Changes in [K+]o and NADH during this occlusion resemble those seen during hypotensive seizures. Fluorescence calibration arrows indicate decreasing fluorescence. (© John Wiley and Sons, reprinted with permission [118])
Only the effects of bilateral carotid occlusions were employed for the interpretation of [K+]o and NADH changes during seizures. An occlusion made after a seizure had terminated (Fig. 7.58b) causing a slowing of [K+]o removal and an increase in NADH fluorescence as compared with the control experiments (Fig. 7.58a). Release of the occlusion was accompanied by an increased rate of [K+]o removal and a simultaneous decrease in NADH fluorescence. When a carotid occlusion was performed between the ictal activities (Fig. 7.58c), increases in both [K+]o and NADH occurred before seizure termination. The slowed postictal removal of [K+]o increased immediately after release of the occlusion, with a simultaneous interruption of the ongoing NAD reduction (increasing NADH fluorescence). Maintaining carotid occlusion during most of the seizure and part of the postictal period (Fig. 7.58) resulted in changes in [K+]o and NADH that were very similar to those observed during the hypotensive seizures described earlier. Seizure duration was not significantly shortened by carotid occlusion.
The “flip” of the NADH response to CSD was recorded under other pathophysiological conditions in animal models, as discussed in detail elsewhere [87], and in the human brain as seen in Fig. 9.10.
To test the validity of the two types of NADH responses to CSD induced in the normoxic and ischemic brain, we used another technique. We constructed and tested a mathematical model [151] capable of simulating changes in brain energy metabolism that develop in real time under various pathophysiological conditions. The model incorporates the following parameters: cerebral blood flow, partial oxygen pressure, mitochondrial NADH redox state, and extracellular potassium. Accordingly, all the model variables are only time dependent (‘point-model’ approach). Numerical runs demonstrate the ability of the model to mimic pathological conditions, such as complete and partial ischemia, and cortical spreading depression under normoxic and partial ischemic conditions.
Figure 7.59a shows the effect of CSD induced in the normoxic brain in our model. The pathological state of spreading depression can be induced by washing the cerebral cortex with a diluted solution of KCl (the “potassium injection”). This effect is modeled by putting K in j > 0 within the time interval t 1 < t < t 2. When spreading depression is induced, the increase in energy requirement leads to the activation of Na+/K+-ATPase to restore the normal potassium distribution and causes an increase in blood flow and a decrease in NADH. In the situation shown in Fig. 7.59b, the blood flow decreases mildly (F max = 0.5 within the time interval from t 1 to t 2), but within the ischemic period, an infusion of potassium is modeled, that is, K inj is assumed to be positive within a relatively short time interval contained in the interval t 1 < t < t 2 during which the main events occur. Accordingly, blood flow slightly decreases as a result of the infusion, and then increases to the new resting level.

Fig. 7.59
a Simulated spreading depression, induced by injection of potassium at the resting level. Duration of injection is from t1 to t2. b Simulated spreading depression induced after partial ischemia, resulting from a mild decrease in blood flow with a short injection of potassium. (© Reprinted with kind permission of Springer Science + Business Media [151])
Figure 7.60 [152] presents, in a schematic way, the relationship between various physiological parameters monitored in vivo under different experimental perturbations. The upper two factors (left side), namely, systemic hypoxia and cerebral ischemia, affect the availability of oxygen so that energy metabolism is inhibited (blue arrows). The other two perturbations shown are cortical spreading depression and epileptic activity that induced cortical depolarization (purple arrows). All four perturbations are affecting the same type of processes in the brain such as CBF, NADH, and extracellular levels, but in the opposite direction. Under hypoxia and ischemia, the production of ATP by the mitochondria is decreased and becomes a limiting factor in the system. Inhibition of the ionic pumps disrupts ionic homeostasis, and hypoxic or ischemic cortical depolarization is developed. The endpoints of this process are changes in the electrical activities recorded as a depression of the ECoG and a negative shift in the DC steady potential. In addition, the depolarization event causes extracellular potassium to be elevated. If this situation persists for more than a few minutes, irreversible damage to the cortex may develop.

Fig. 7.60
Schematic representation of effects of various pathological conditions on energetic-mitochondrial function and ionic and hemodynamic state of cerebral cortex (details in text). (© Reprinted with kind permission of Springer Science + Business Media [152])
When the brain is activated by CSD or epileptic activity (lower left side), the events will propagate toward the activation of the brain, and energy consumption is increased (purple arrows). The coupling between the two pathological events is clear, and manifested by the electrical activity (ECoG) as well as extracellular K+ levels and NADH redox state. During the epileptic stage, extracellular potassium increased and started to recover to the baseline, but then a larger elevation was recorded. There is a clear correlation between the various parameters during epilepsy and CSD. The decrease in NADH was smaller during the first stage, followed by an oxidation cycle typical for CSD.
7.3.6 Activation of Body Organs
The effects of tissue activity on mitochondrial NADH were investigated in the late 1950s. As shown in Fig. 3.1, the addition of ADP to resting isolated mitochondria (state 4) led to an increase in O2 consumption and oxidation of NADH. To mimic this situation in intact tissue, Chance and Connelly [153] used in vitro muscle preparations and measured the NADH responses by light absorption (Fig. 7.61). In 1959 Chance and Jobsis [154] applied the newly developed NADH fluorometric method to frog sartorius muscle in vitro, finding a decrease in NADH caused by a series of twitches leading to an increased ATP breakdown into ADP. Chance [155] applied the same approach to monitor the toad sartorius muscle in vivo and found clear NADH oxidation depending on the rate of stimulation.

Fig. 7.61
Absorbency changes recorded in frog sartorius muscle 0.08 cm thick upon contraction caused by electrical stimulation. Muscle was bathed in oxygenated Ringer solution at 7° and stimulated with silver electrodes. Time scale applies to all three graphs as does absorbency scale. Recorder bandwidth is approximately 3–2 cycles/s. In traces A and B, stimulation is continuous from the point marked ‘on’ at 1.5/s to point marked ‘off.’ In trace C, stimulation occurs at 15-s. intervals. (© Reprinted by permission from Macmillan Publishers Ltd. [153])
The experimental results begin at the left-hand edge of the chart. The tissue has not previously been extensively stimulated and is initially in a resting state. Stimulation at 0.5 cycles/s causes decreased fluorescence, which is interpreted as oxidation of reduced pyridine nucleotide. After a minute, a plateau is reached, suggesting that further stimulation at this rate would not cause further oxidation of reduced pyridine nucleotide. The stimulation rate is doubled to 1/s and the fluorescence diminishes even farther, to more than 30 % with respect to the initial level. At this point, 10 μg epinephrine is injected into the femoral vein of the opposite leg. A few seconds later, there is a pronounced increase of fluorescence, interpreted as DPN reduction at the triose phosphate dehydrogenase step of glycolysis as the result of epinephrine-induced glycogenolysis. This interpretation of the fluorescence change is supported.
Subjecting the highly stimulated muscle to partial hypoxia induced a further increase in NADH redox state. Later on [156], Chance showed the correlation between NADH oxidation during muscle stimulation and the increased heat production measured by a thermocouple. His studies of the muscle were summarized in 1966 [30].
A few years ago, Pal et al. monitored NADH fluorescence in cats subjected to sympathetic trunk stimulation [157]. They found that high stimulation frequency caused a large decrease in capillary blood volume and an increase in NADH levels.
As shown in the previous Sect. 7.3, activation of the brain by any one of the three methods leads to oxidation of NADH from the state 4 to state 3 transition of the mitochondria. The prerequisite for such responses is a normal blood flow that has the capacity to increase O2 supply to cope with an increased demand.
Activation of the heart may lead to the development of a more complicated situation, because the blood supply will be affected by changes in muscle contractility. Using a dog heart in vivo [158], Kedem et al. showed that increase in heart rate above 150 beats per minute leads to an increase in NADH levels (Fig. 7.62) even when the blood flow is enhanced. These results indicated that the autoregulation of blood flow was insufficient to compensate for the extra oxygen needed. The same group tested the effect of inotropic agents on the NADH level in the dog heart in vivo [159]. A marked oxidation of NADH was recorded after infusion of noradrenaline or ouabain, concomitantly with the developed increase in tension. The same group published several more studies, in which they monitored NADH in the heart exposed to other physiological and pathophysiological conditions [160–162]. When the heart rate was elevated from 150 to 280 bpm, NADH was elevated but the relative levels of NADH were significantly lower after hypopnea [77] or after injection of nitroprusside [162].

Fig. 7.62
a Effect of increasing frequency of stimulation from 120 to 180/min (change initiated at arrow on scale T). b Effect of lowering heart rate from 240 to 120/min. S.a. stimulus artifact. Polygraph tracing shows effect of nitrogen breathing upon parameters measured. T, time (s) and event marker; B.P . arterial blood pressure (mmHg); Ten, local isometeric myocardial tension (g); T flow, local coronary flow measured by thermistor (%); r. intensity of reflected light at 366 nm (%); f. intensity of light returned from fluorescence of NADH at 450 nm (%); c.f. corrected fluroescence (f. − r.) in percent. c Relationship between heart rate and local NADH fluorescence changes. (© John Wiley and Sons, reprinted with permission [158])
Under ischemia induction [163], NADH became elevated and the local contractile force decreased as compared to the simultaneously measured non-ischemic region in the left ventricle. An increase in the heart rate in this model attenuated the typical increase in blood flow and NADH in the non-ischemic region. In the ischemic area, a very small reaction was recorded, indicating that some responsiveness to inotropic simulation was retained.
Stay updated, free articles. Join our Telegram channel

Full access? Get Clinical Tree


