(1)
Faculty of Life Sciences, Bar-Ilan University, Ramat-Gan, Israel
Keywords
NADH monitoring in patientsCardiovascular patientsPatients in neurosurgical OR and ICUNADH responses during kidney transplantation9.1 Introduction
One of the main goals in performing experiments in animal models as well as developing new monitoring tools is to enable the understanding by clinicians of pathophysiological situations in patients as well as to develop new tools for daily use. As of today, monitoring of mitochondrial function simultaneously with microcirculatory blood flow and hemoglobin oxygenation is very rare in clinical practice. One of the main factors enabling normal tissue and organ function is the appropriate level of oxygen supply to the mitochondria needed for ATP production. In this chapter, we summarize the published material regarding the monitoring of NADH redox state in various organs in patients in vivo.
9.2 History of NADH Monitoring in Patients
Most of the published material was investigated in the intact human brain, but other body organs were monitored as well under in vivo conditions. Monitoring of mitochondrial function alone is not enough, and therefore during the years the multiparametric monitoring approach was adopted in various clinical studies. Chance et al. [1] concluded that “the redox state of mitochondrial NADH will complement blood gas analysis for measuring the health and welfare of human tissues.” Nevertheless, as of today this idea is not implemented in daily clinical practice.
9.2.1 Monitoring the Human Brain
Although NADH was monitored in isolated cells from human tissues [2], the first attempt to apply NADH fluorometry to human tissues in vivo was made in 1971 by Jobsis et al. [3].
The fluorometric technique was used in patients (Fig. 9.1) to evaluate the relative rate of oxygen consumption and the bioenergetics activity of the intact cerebral cortex of patients. Using NADH fluorescence micro-fluorometry (Fig. 9.1a, b), they monitored the exposed brain of neurosurgical patients undergoing treatments for focal cerebral seizures. They correlated the electrocorticographic data to the NADH redox state under direct cortical stimulation of the monitored area. The recorded changes (Fig. 9.1c), namely, the oxidation of NADH (decrease of fluorescence), were very similar to those obtained in analogous procedures in the cat brain [4].

Fig. 9.1
Technology and typical results measured by Jobsis et al. in 1971 from human cerebral cortex. Micro-fluorometer (a) and its tip (b) placed above the surface of the brain are shown on left side. c Responses to direct cortical stimulation are shown on right side. (© Reprinted with permission from Elsevier [3])
A few years later, the collaboration between Austin and Chance [5, 6], led to the recording of NADH in the brain of patients subjected to micro-anastomosis of the superficial temporal artery (STA) to the middle cerebral artery (MCA). They found an improvement of cerebral oxidative metabolism after the anastomosis, which was correlated to the elevated blood flow and increased tissue pO2. Using a different type of fluorometer, Van Buren et al. showed a decrease in NADH (oxidation) resulting from cortical stimulation in epileptic patients [7]. Cortical electrical activity was compared with NADH fluorescence in patients undergoing operation following focal epilepsy. NADH was oxidized by 3–15 % in response to cortical stimulation only in 60 % of the patients. The topography of spread of NADH changes after cortical stimulation was usually asymmetrical in the human epileptigenic cortex.
Barlow et al. [8] used the fluorometric technique to measure NADH and flavoprotein fluorescence. In patients they monitored the fluorescence of flavoprotein in the human brain after anastomosis of the superficial temporal artery to the middle cerebral artery. They “demonstrated increased rate of cortical oxidative metabolism after the surgical procedures.”
During the same year Fein and Jobsis studied the changes in brain energetics in patients undergoing STA-MCA micro-anastomosis [9]. They tested six patients and concluded that “the mechanism of energy production may be more sensitive to ischemic anoxia than the mechanism of energy utilization.” Later on Fein and Olinger monitored patients after transient ischemic attacks (TIAs) [10, 11]. The brain of these patients, who had undergone an extracranial–intracranial bypass, was stimulated, and changes in NADH were recorded. They concluded that “persistent reversible abnormalities of cortical mitochondrial metabolism exist in a significant number of patients with history of TIAs who are suitable candidates for bypass surgery. Chance, in a review article in 1983 [12], compares three types of brain imaging techniques; optical—the surface fluorescence, NMR and radio isotopes, emphasizing the advantages and disadvantages of each one.”
9.2.2 Monitoring the Heart and Skeletal Muscle
The laser-based fluorimeter developed by Renault et al. [13] was used to monitor NADH redox state in the endomyocardium of patients during left heart catheterization [14]. They injected contrast medium into the right coronary artery and recorded a large transient increase in NADH fluorescence. It was hard to interpret the response because a control injection of saline solution was not reported. Later on the same group monitored the human heart during induced variations in left ventricular end-diastolic pressure (LVEDP) and during coronary arteriography. NADH laser fluorometry therefore seems to be promising as a means of exploring myocardial metabolism during cardiac catheterization [15]. During coronary angiography, injection of the contrast medium induces a rise in NADH in patients with a significant degree of coronary stenosis.
Figure 9.2 shows the effect of catheterization on NADH fluorescence measured in patients.

Fig. 9.2
Aa Direct effect of coronary angiography on concentration of NADH. Arrow indicates injection of contrast agent. NADH concentration is expressed in arbitrary units (A.U). Ab Direct effect of coronary angiography on concentration of NADH. Arrow 1 indicates time of injection of radioselectan*. Arrows 2 and 3 indicate time of injection of hexabrix*. b Correlation between tele-diastolic pressure of left ventricle (PTDVG) and NADH concentration. n number of measurements for each patient, u.a. arbitrary units. (© Reprinted with permission of Prof. Denis Duboc and Elsevier Masson [15])
In another study, NADH was monitored in patients with McArdle’s disease (muscular phosphorylase deficiency), supporting the hypothesis that in this disease reduction of flux through the Embden–Meyerhof pathway causes decrease in the mitochondrial ability to produce NADH during ischemia [16]. Later on, NADH was monitored in the knee extensor muscle in 30 healthy males. NADH increased maximally within the first seconds of contraction [17].
Under amyotrophic sclerosis there is impairment of mitochondrial function as presented by decrease in the activity of NADH:CoQ oxidoreductase compared to the control group. In this study NADH was not monitored in vivo, but rather an isolated muscle fiber was used [18].
The same group of investigators monitored muscle fiber in vitro isolated from patients suffering from sporadic amyotrophic lateral sclerosis (SALS). They monitored flavoprotein/NAD(P)H ratio using autofluorescence imaging and found heterogeneous distribution of mitochondrial respiratory chain defect in 11 of 17 patients with SALS [19].
Intracellular fluorophores were monitored in isolated muscle cells, having the advantage of avoiding the problems of phototoxicity and photo-bleaching [20].
It is important to note that other studies in which spectroscopy was used to detect cancer cells or tumors were published. In most of them, monitoring was not directly related to the changes to NADH redox state itself, but rather the wide spectrum was measured, including the area of NADH emission spectrum [21–29].
9.2.3 Monitoring of Visceral Organs
Mayevsky and his group attempted to apply the NADH monitoring system to the evaluation of the human kidney during a transplantation procedure. We measured the transplanted kidney cortex immediately after the surgical procedures in the operation room [36, 37].
As of today, in vivo monitoring of the liver in the human has not been performed. Nevertheless, two papers described the changes in liver redox state after transplantation. A correlation between flavoproteins/pyridine nucleotides in human liver frozen tissue and arterial blood acetoacetate/β-hydroxybutyrate ratio was found. They concluded that the hepatic mitochondrial redox state of pyridine nucleotide can be evaluated by arterial blood [38]. Intramitochondrial oxidoreduction state was evaluated in frozen samples of liver grafts obtained from living donors. There was a delay in oxidation of the intramitochondrial oxidoreduction state as compared to blood oxygenation, probably caused by the cold preservation condition. Those findings indicate the importance of microcirculation in the normalization of the oxidoreduction state [39].
9.2.4 Monitoring of Cancer Cells and Tissues
Although the current review is concerned with in vivo monitoring of NADH in human organs, we are including a short review of monitoring in cells and tissues. Spectroscopy of cells and tissues in vitro is used to differentiate between normal and cancer cells of human organs.
One of the problems of determining melanoma in situ is the lack of suitable techniques. This group has developed a fluorescence technique for qualitative and quantitative determination of nuclear cataract in human lenses. This technique is based on the fluorescence of a natural chromophore in the tissue that is excited at 366 nm, excites maximally at 475 nm (probably NADH), and is the first to be changed following metabolic changes [40]. Lohmann et al. [41] reported the monitoring of lung tissue. Fluorescence tomography (with a peak at 460 nm) together with other established methods might be used for determination of the histology of a biopsy sample. Schneckenburger et al. [42] found that skin fibroblasts from patients with mitochondrial disease showed high levels of fluorescence. This technique was used also on patients with moles of melanoma, as there is an increase in metabolic rate in cancerous cells that is observed mainly at the borders between healthy tissue and cancerous tissue. The fluorescence in the melanoma tissue was sixfold higher than that of the normal tissue.
Autofluorescence was used in colonic tissue to distinguish between neoplastic (abnormal growing) and hyperplasic (normal growing) tissue. This technique is significantly ideal for tissue diagnosis because it does not require administration of exogenous fluorescent dyes to the patients [43].
Konig et al. [44] claimed that early diagnosis of a diseased tissue, especially in the field of cancer, is not yet available. Characterization of the tissue metabolic state can successfully distinguish between healthy and malignant tissue. This study monitored bladder mucosa carcinoma and prostatic tissue. Laser-induced fluorescence is a technique that could perform “optical biopsy” in gastrointestinal mucosa. Monitoring of esophageal specimens showed good accuracy in distinguishing between normal and malignant tissue [45].
Because cancer cells usually show higher glycolytic activity, this activity affects their NADH/NAD+ level. When frozen slices of bronchial tissue were monitored, NADH fluorescence was higher in normal tissue than in malignant tissue [46].
Sterenborg et al. [47] found that the detection of skin cancer using the fluorescence of natural chromophores, especially NADH, was possible. Pfeifer et al. [48] used the fluorescence method to distinguish between healthy, cancerous, and necrotic tissue in lung tumor diagnostics. It was demonstrated that NADH fluorescence can be used for differentiation between tumorous and necrotic tissue and that flavin measurements are suitable for differentiation between healthy and nonhealthy tissue.
A compact probe of the laser spectrometer was used in various models: in hippocampal slices, to differentiate between necrotic and nonnecrotic lung tissue; for monitoring cell growth; and for bladder carcinoma diagnosis (this last showed lower fluorescence in malignant cells than normal cells) [49].
9.3 Monitoring of Patients in Clinical Practice
A new era of monitoring mitochondrial function in patients started in 1990 when our team developed a unique multiparametric monitoring system that included the measurement of NADH fluorescence, using a light guide-based device [50]. This system was initially applied to monitor neurosurgical patients undergoing brain surgery. In the second half of the 1990s [51–53], we were able to monitor the brain of comatose patients in the ICU and described, for the first time, the development of cortical spreading depression-like responses, including marked NADH responses that were correlated with the microcirculatory blood flow. A modified multiparametric monitoring system was applied for NADH measurement during neurosurgical procedures in the operating room [54–57].
Monitoring of patients in real time can be divided into two possible categories (Fig. 9.3).

Fig. 9.3
Patient monitoring takes place at two levels. a Monitoring of function of specific organs. b Monitoring of systemic parameters. b1 Systemic general parameters that are monitored today; b2 systemic early warning parameters that could be monitored by clinical devices developed by Mayevsky et al. (© Reprinted with kind permission of Springer Science + Business Media [76])
In Fig. 9.3a, when a specific organ is monitored, the information accumulated represents the events occurring in the organ itself. For example, monitoring intracranial pressure (ICP) or electroencephalography (EEG) in neurosurgical patients provides information on events that have developed in the brain itself. The information is dependent initially upon local pathological events occurring in the brain. Monitoring electrocardiography (ECG) represents the electrical activity of the heart, and most of the changes are correlated to local, not systemic, events initially.
The second approach in monitoring patients (Fig. 9.3b) is divided into two subgroups (labeled b1 and b2). The parameters shown in Fig. 9.3b1 are measured routinely from the cardiovascular and respiratory system, which provides information on systemic events such as changes in gas exchange in the respiratory system or cardiac output affecting the perfusion of various organs in the body. The second group of parameters (Fig. 9.3b2) is measured at the tissue level and the accumulated results represent the oxygen balance of the entire body. The physiological mechanism behind the monitoring approach shown in Fig. 9.3b2 is illustrated in Fig. 9.4.

Fig. 9.4
Schematic presentation of various pathological states developed under various clinical situations that lead to the development of the body emergency metabolic state (BEMS). As a result, blood flow redistribution leads to an increase in blood flow to the most vital organs and a decrease in blood flow to the less vital organs. (© Reprinted with kind permission of Springer Science + Business Media [76])
A pattern of pathophysiological cascade of events that may occur in many emergency clinical situations in adult patients and may lead to morbidity and mortality is shown in Fig. 9.4. Various pathological states may lead to metabolic disturbances and result in derangement of cellular energy [58–61].
The six pathological states (upper part of Fig. 9.4) are the most common events that may develop in clinical practice: these may develop because of a specific clear event, such as a major operation, or during the slow process of body deterioration, such as in sepsis or shock. The definition of each of those six states is not so well established, and some overlapping may exist. Under all those situations, the metabolic state of the body will deteriorate and energy failure will develop.
The situations shown in Fig. 9.4 could develop in hospitalized patients in various operating rooms or intensive care units, including the respiratory, neurosurgical, cardiac, and neonatal ICUs. Also, all patients undergoing severe operations such as cardiac bypass, neurosurgical surgery, or organ transplantation may develop the body emergency metabolic state (BEMS). Other patients who may develop the BEMS are newborns during delivery or elderly patients treated in the internal medicine department.
As a central protection mechanism, blood flow redistribution occurs, and the three protected organs (brain, heart, and adrenal gland) will receive more blood and O2, while the peripheral organs or areas (skin and muscles), as well as other less vital visceral organs, will undergo vasoconstriction, and a decrease in blood flow and O2 supply will occur. Monitoring at the cellular function level is the most significant indicator of the metabolic state of patients in critical care medicine [62, 63].
Energy balance in the most vital organs will remain positive because of higher blood flow while the less vital organs will be hypoperfused and a negative energy balance will develop. The blood flow redistribution mechanism will affect energy production by the mitochondria in the most vital and the less vital organs in the body (Fig. 9.4). This change in mitochondrial function will affect the production of ATP.
9.3.1 Methods and Results
During the past 20 years we have developed three types of multiparametric monitoring systems that were applied to patients at various clinical locations. The concept of our development was to provide the clinicians with new physiological information that will improve their ability to diagnose the stage of pathological conditions in real time.
9.3.1.1 The Multiparametric Monitoring System
In the 1980s we developed the first multiparametric monitoring system, which was adapted to experimental animals exposed to various pathological conditions [64–67]. Later on, we improved the system to introduce it to the neurosurgical operating room or intensive care unit (ICU) for patient monitoring. The concept behind the development was that the more parameters that are monitored, the better will be the diagnosis of the situation (Fig. 9.5).

Fig. 9.5
Neurological patient monitoring usually includes systemic parameters (left): however, we suggest the monitoring of specific brain parameters (right). One Data bank (LabView system) will concentrate these data, which will be analyzed by the clinical team. BP blood pressure, HR heart rate, Temp body temperature, SaO 2 oxygen saturation, ET CO 2 end-tidal CO2, ICP intracranial pressure, CBF, CBV cerebral blood flow/volume, NADH mitochondrial NADH redox state, K + extracellular potassium level, DC steady DC potential, ECoG electrocorticography, Temp brain temperature. (© Reprinted with kind permission of Springer Science + Business Media [76])
The ideal system was to monitor eight parameters from the brain (right side) in addition to the various systemic parameters monitored in every patient hospitalized (left side). The long-term vision was that all parameters monitored by the two monitoring systems will be integrated in the same data bank and an expert system will be developed for better diagnosis of the patients. The translation of this concept into a practical tool and monitoring device is presented in Figs. 9.6 and 9.7.

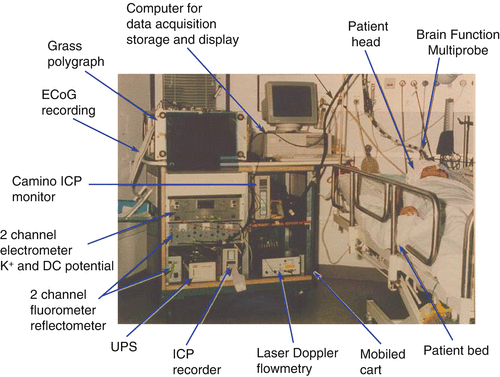
Fig. 9.6
a Floating tissue energy state probe (TESP) used during various surgical procedures including optical fibers for NADH fluorometry and for laser Doppler flowmetry as well as a temperature probe. ECoG electrocorticography probe. (© Reprinted with permission from Elsevier [37].) b Schematic representation of multiprobe assembly (MPA) used for monitoring the brain of head-injured patients in the ICU. The MPA is connected to the brain via a special holder screwed into the skull. ICP intracranial pressure probe, CBF, NADH fiber-optic light guide probe to measure local cerebral blood flow (CBF) and mitochondrial redox state (NADH), K + , DC extracellular K+ mini surface-electrode surrounded by a DC steady potential monitoring space, ECoG bipolar electrocortical electrodes. (© Reprinted with permission from Elsevier [51])
Fig. 9.7
First clinical monitoring setup (“Brain Monitor”) used in the neurosurgical intensive care unit. a Multiparametric monitoring system consists of various devices installed in the same cart. The MPA shown in b is connecting the brain of the patient to the brain monitor. (© Reprinted with kind permission of Springer Science + Business Media [76])
Based on the well-developed multiprobe assembly (MPA) used for animal experiments [68], a new MPA was developed and applied to patients monitored in neurosurgical operating rooms and the ICU. This device allowed us to monitor, in real time, the hemodynamic, metabolic, ionic, and electrical activity in the brain of comatose patients. All details regarding the technology and clinical setup appear in our published paper [51]. Figure 9.6b shows the longitudinal section of the MPA (measuring eight parameters) used in the neurosurgical operating room and ICU. A simplified multiprobe that monitors up to five parameters is shown in Fig. 9.6a. The MPA was connected to the multiparametric monitoring system shown in Fig. 9.7.
The first attempt to monitor NADH from the human brain by our group was in 1990. We monitored a few neurosurgical patients in the Hospital of the University of Pennsylvania after IRB approval. We monitored only mitochondrial NADH and microcirculatory blood flow in those patients because available time during the surgical procedure is very limited. The responses of the human brain to ischemia are shown in two events in Fig. 9.8. In one patient, a short brain ischemic episode was induced by the occlusion of the common carotid artery during the preparations for a brain aneurysm procedure. Immediate decrease of CBF was recorded simultaneously with an increase in NADH redox state (Fig. 9.8a) with only very small changes in the reflectance recorded (R). The recovery of CBF and NADH oxidation was very fast. The time to reach 50 % of the change in NADH during the recovery was less than 3 s. In contrast to the NADH recovery to the pre-ischemic level, the CBF signal shows a large hyperemic response (large overshoot in CBF).

Fig. 9.8
a Responses of human cortex to decrease in blood flow induced by common carotid artery occlusion. R, F, CF reflectance, fluorescence, corrected fluorescence. (© SPIE, reprinted with permission [50].) b Metabolic and hemodynamic responses to short occlusion of internal carotid artery during STA-MCA bypass operation. (© Reprinted with kind permission of Springer Science + Business Media [54])
In another patient (Fig. 9.8b), gradual occlusion of the internal carotid artery, during an STA-MCA anastomosis operation, led to a large decrease in CBF with a significant increase of NADH. Following reperfusion both parameters rapidly recovered, indicating that the microcirculation was intact during the surgical procedure. Here also the reflectance remained quite stable during the monitoring period and manipulation. In another study, cerebral blood flow and NADH were monitored in a group of patients who underwent various neurosurgical procedures during a short episode of hypercapnia. These patients were divided into three groups according to their responses to changes in CO2. The first group (n = 7) showed no responses to the change in CO2 (Fig. 9.9a) whereas the two other groups responded to this short hypercapnia. In six patients (Fig. 9.9b) CBF increased significantly while NADH remained stable. In two patients (Fig. 9.9c) the blood stealing phenomenon was recorded (monitoring took place at a region near a removed tumor); CBF was decreased while NADH increased.

Fig. 9.9


Responses of the human brain to changes in tidal CO2 induced in 14 patients. a In group A, the average of the A patients monitored (both CBF and NADH) were not significantly affected. b In group B, the CBF was significantly elevated. *p < 0.05, ^p < 0.01. c Stealing effect was recorded. (© SPIE, reprinted with permission [56])
Stay updated, free articles. Join our Telegram channel
Full access? Get Clinical Tree
