(1)
Faculty of Life Sciences, Bar-Ilan University, Ramat-Gan, Israel
Keywords
Monitoring of NADH in vivoMonitoring of different organsMonitoring of various animals8.1 Introduction
Since the early stages of NADH monitoring under in vitro and in vivo conditions, various organs in different animals have been used. Although most of the published papers describe monitoring of the brain, other organs in various animal models were used as well. The first published data, by Chance and Jobsis in 1959, described the monitoring of NADH in the exposed sartorius muscle of the frog using the surface fluorescence technology [1]. The electrical stimulation led to the oxidation of NADH proportional to the rate of the stimulation caused by the increase in ATP utilization.
In the classical study published in 1962, Chance et al. showed (Fig. 8.1a) the effects of perfusion on NADH spectra in slices prepared from the the kidney (left side) and brain (right side).

Fig. 8.1
a Effect of perfusion on aerobic–anoxic fluorescence emission changes in slices of kidney and brain cortex. The uncorrected emission maxima are at 472 mμ. The same energy sensitivity was used in the four experiments, and thus the heights of the peaks indicate the relative intensities of emission from kidney and cortex slices. (© Reprinted with permission from AAAS [4].) b Fluorescence emission spectra of rat adrenal cortex, monitored in vivo, under aerobic and anoxic conditions. (© Reprinted by permission from Macmillan Publishers Ltd. [2])
In another study in 1962, Chance et al. showed the response of the rat adrenal gland, in vivo, to anoxia as seen in Fig. 8.1b [2]. Later on, other groups of investigators, using the NADH monitoring, were established outside the group created by Prof. B. Chance in Philadelphia.
After my postdoctoral period with Prof. Chance (1972–1974), I established a group of investigators and students who were active for 40 years. We monitored a large number of organs in different animals, although the brain in rats was our main organ and animal model.
Figure 8.2 summarizes the spectrum of organs monitored, by our group, under various perturbations in experimental animals as well as in patients [3]. As seen, we monitored various organs but the main organ studied in my laboratory was the brain in rats and gerbils. Table 7.1 (Chap. 7) lists the published papers by Mayevsky and collaborators according to various organs in general and the brain according to the perturbations used.

In the next few sections is given a detailed presentation of studies in which NADH was monitored in various organs in different animals. All the published papers are organized in the tables according to the organ used in various animal models. The papers published by Mayevsky and collaborators are not included in those tables here but appear in Table 7.1. At the beginning of each section of this chapter, a typical record represents the monitoring of a specific organ. An appropriate table that gives the reference paper numbers that were published is presented.
8.2 Monitoring the Brain
The first detailed measurements of NADH in the brain were published by Chance and his collaborators in 1962 [4]. Later on, other investigators used the same principles to monitor the brain in various animal models. As the brain was the dominant organ monitored by other investigators, I review here the main findings described in the papers in which the brain was used as a preferred organ. Many of my own results are presented in other chapters of the book; therefore, in this chapter I discuss the results obtained in the brain and heart of large animals measured by other investigators.
Table 8.1 presents the papers related to brain NADH monitoring in various animal models, published by various investigators. In the next two sections (Sects. 8.2.1 and 8.2.2), studies of the brain in pigs, dogs, monkeys, and cats are described in more detail.
Table 8.1
Monitoring of NADH in the brain in various animals
Animal | Published papers [reference numbers] |
|---|---|
Rats | |
Cats | |
Gerbils | |
Primates | |
Dogs | |
Rabbits | |
Guinea pig | |
Mice | |
Ducks and chicken | |
Frog |
8.2.1 Studies of Large Animal Brains (Pigs, Dogs, and Monkeys)
Figure 8.3 presents the technology used and typical results by Sundt and Anderson [5].

Fig. 8.3
a Instrumentation for spectrofluorometric recordings includes the following components: (1) photometeric readout; (2) brain temperature readout; (3) pulse-and-hold readout; (4) Hewlett-Packard FM recorder; (5) Grass polygraph; (6) mercury arc direct-current power supply; (7) infrared microscope for recording brain temperature; (8) mercury arc lamp source; (9) Orthoplan microscope; (10) Bausch & Lomb grating monochromator. b NADH is recorded from an area of brain (in circle) with a diameter of 153.8 μm. Note that selected area is free of major vessels. c NADH fluorescence levels with barbiturate, halothane, and urethane anesthesia. Similarity of levels in non-ischemic brain indicates no major interference from type of agent used. Lower levels: during occlusion. (© Walters Kluwer Health, reprinted with permission [5])
These investigators used the brain of the squirrel monkey exposed to ischemia. Figure 8.3a shows the technology used for the study, and Fig. 8.3b, the selected area with minimum large blood vessels that was selected. In Fig. 8.3c, a typical response to MCA occlusion (partial ischemia) is presented. The cortex of monkeys was monitored before, during, and after ischemia. NADH increased during ischemia and fully recovered on reperfusion. The effects of several anesthetics were compared. The use of the infrared microscope for semi-quantitative measurements of cortical blood flow was found to be reliable. In a second paper published in the same year [6], the same investigators monitored the NADH following MCAO in combination with pCO2 changes and blood pressure changes. NADH levels were higher in the ischemic cortex under both hypovolemic and hypotensive conditions. Neither hypercapnia nor hypocapnia changed NADH levels in the ischemic regions. NADH recovered following restoration of CBF. Another paper published by Anderson [7] described the use of a micro-spectrofluorometer for monitoring the ischemic area (MCA occlusion) in the brain of monkeys. The effects of various anesthetics is discussed as is the hemoglobin artifact. The same group investigated the brain of rabbits exposed to ischemia as well as after exposure to various drugs (references are given in Table 8.1).
In 1977 Kovach [8] studied the effects of hemorrhage and hypovolemic shock on the brain of dogs. Although it was believed that the brain is protected in such conditions by its autoregulatory mechanism, this study showed that the central nervous system (CNS) is in fact vulnerable in prolonged hemorrhagic hypotension and shock.
Spontaneous electrical activity disappeared during hypovolemia and did not return after reinfusion. Failure of the body, under shock, to restore the homeostatic equilibrium can be attributed to the inadequacy of the central nervous servo-control system. In 1976, Sundt et al. [9] tested the effects of temporary occlusion of the MCA in monkeys in combination with changes in pCO2 and blood pressure. The parameters that were monitored included NADH, reflectance, and EEG. In the normal brain, NADH remained steady through a wide range of pCO2, MABP, and CBF, whereas in the ischemic brain NADH increased in correlation to decreased CBF and EEG abnormalities. NADH also became dependent on MABP. In 2000 Strong et al. [10] tested the effect of the species (primates versus rats) on the development of peri-infarct depolarization in ischemic boundaries (after MCAO). Monitoring continued 4 h after MACO. In 1992 Rampil et al. [11] tested the effects of hypoxia induced in pigs, and NADH fluorescence was monitored from the cerebral cortex. Two wavelengths, 366 nm and 585 nm, were tested for estimation of blood volume.
In 1975 LaManna monitored NADH fluorescence in the brain of rats, cats, and rabbits [12]. It was concluded that in vitro reactions involved in the control of mitochondrial respiratory rate supply only general explanations for in vivo responses. In the tissue are several other parameters that should be considered, such as blood flow and functional demand. Moreover, studies on the kinetics of changes (from one state to another) are required.
Monitoring of NADH in the brain of newborn dogs led to a number of publications.
In 1985, 31P-NMR spectra were correlated to NADH fluorescence in the newborn dog brain (21-day-old) exposed to hypoxia [13].
The effects of low oxygen levels on the physiological responses of the brain in the newborn dog at different ages after birth were studied by Mayevsky et al. [14]. The newborn brain was able to maintain lower extracellular K+ levels under anoxia as compared to the adult brain, probably because of the slow disappearance of energy. Thus, the Na+/K+-ATPase was able to keep the ionic gradient.
Later on, the effect of short anoxia and hypoxia on the newborn dog brain was tested by monitoring two parameters: NADH fluorescence and 31P-NMR [15]. Under deficit of oxygen, the ratio between PCr and Pi decreased below 1. There was a negative correlation between NADH and PCr/Pi. Under moderate long-term hypoxia, a stabilized low-energy state was achieved with good recovery, whereas under severe long-term hypoxia, autoregulation was impaired and PCr/Pi decreased.
In other studies, Yoles et al. monitored NADH in newborn dogs. Three ages of newborn dogs were exposed to global brain ischemia. The youngest age showed the slower secondary reflectance increase, the slower leakage of K+ to the extracellular space. The recovery of K+ was faster in the oldest pups [16].
Pups aged 1–70 days old were exposed to hyperbaric oxygenation (HBO). The first parameter to respond was the oxidation of NADH. The younger pups developed convulsions at a later time as well as vasoconstriction of their blood vessels [17].
8.2.2 Monitoring the Brain in Cats
Monitoring of brain NADH in cats was started by Jobsis and his group (Duke University, North Carolina) in the early 1970s. The first two papers were published in 1971 by Jobsis et al. [18] and Rosenthal and Jobsis [19]. In the first paper the instrumentation and technological aspects were described together with data measured in a cat model of epilepsy. In the second paper, the effects of direct cortical stimulation of the cerebral cortex were described. More papers on brain NADH monitoring in cats were published later by the Jobsis group. Jobsis in 1972 [20] concluded that the optical properties of the components of the respiratory chain are different depending on their oxidation–reduction state. He further concluded that optical monitoring has become an important means of studying the respiratory chain ever since the early visual observation by Keilin and subsequently the spectrophotometric detection by Chance. The same group of Jobsis published in the following 10 years a large number of papers on NADH monitoring and brain physiology.
The first paper showing the effects of cortical spreading depression on NADH redox state was published by Rosenthal and Somjen in 1973 [21]. This study monitored the level of NADH before, during, and after cortical SD to evaluate if there is shortage in the supply of oxidative metabolites at or before the time of onset of the depression. The increase in reflectance is related to: the brain surface becoming paler, or shinier, or the tissue moving closer to the optical probe. A linear correlation was found between the amplitude of the shift of the electrical activities and the increase of the rate of oxidative metabolism. From this finding it was concluded that a major fraction of the consumption of oxidative energy of the cortical gray matter is related to the ratio of extracellular to intracellular K+ activities.
In 1975 the same group published three papers. The effects of ouabain and phenobarbital were tested under cortical-evoked potentials by Rosenthal and LaManna [22]. The transient fluorometric response of NADH to evoked potential was confirmed as a measure of ATP breakdown and oxidative rephosphorylation. The rate of NADH oxidation is the measure of the rising of ADP concentration caused by the activation of Na+/K+-ATPase. The rate of reduction of NADH (return to basal level) was a function of the respiratory chain. LaManna in 1975 [12] monitored the oxidative metabolism in intact cerebral tissue of cats, rats, and rabbits. When comparing mitochondrial function in vivo to in vitro, one must consider the limitations of blood flow and functional demands that exist in the in vivo conditions. In another study, Lothman et al. [23] found that NADH was oxidized following electrical stimulation of the cortex: the activity of extracellular potassium increased, and there was a DC negative shift. Most of (but not all) the oxidation is needed for the restoring of the disturbed ionic balance. The negative DC shift results from glia cells depolarized by excess potassium. When K+ exceeded the level of 10–12 mM, SD was developed (in unanesthetized conditions). During electrical stimulation of normal cortex and during seizure activity, potassium levels rose above 10–12 mM and during SD the level exceeded 30 mM.
The effects of ischemia were tested in 1976 by Rosenthal et al. [24]. Incomplete cerebral ischemia in cats was accompanied by increased levels of NADH and reduced cytochrome a, an increase in uploading of oxygen from hemoglobin and a decrease in CBV. Complete ischemia was associated with higher levels of NADH and reduced cytochrome a, similar to anoxia. Repetitive short ischemic episodes induced rapid return of NADH to the basal level from one episode to another while CBV responded at the same rate at each episode of ischemia and hemoglobin saturation recovered more slowly, indicating that the primary lesion of short ischemic episodes is the uncoupling of oxidative phosphorylation. In another study, Rosenthal et al. [25] studied the effects of complete versus incomplete ischemia on NADH in the cat cortex. Direct cortical stimulations were used to evaluate changes in energy metabolism. Incomplete ischemia induced a decrease in the response amplitude. However, complete ischemia produced an amplitude decrease with an initial increase and then decrease: this may result from utilization of accumulated lactate that appears from uncoupling of oxidative phosphorylation, which may indicate mitochondrial lesion following ischemia. LaManna et al. [26], in 1977, checked the effects of phenobarbital on K+ extracellular and NADH levels in the cat cortex. Within minutes following phenobarbital injection, NADH increased, indicating a decrease in tissue O2 consumption. Electrical stimulation under those conditions induced an increase in K+ level and oxidation of NADH. At the same time, Somjen et al. [27] correlated the responses of various parameters under direct electrical stimulation and found that the logarithm of the rise of extracellular potassium concentration, the shift in the electrical potential, and the response of oxidative metabolism are linearly correlated. However, under seizures or spreading depression (SD) the correlation disappeared, suggesting that the demand to oxidative energy exceeds that corresponding to the elevation of K+.
In 1976, LaManna et al. published four papers on testing the effects of various drugs on brain NADH in cats. In the first [28], adrenergic agents induced an initial decrease in NADH level followed by a more prolonged increase in NADH level (reduction) followed by a large prolonged decrease in NADH level (oxidation). This study demonstrates the feasibility of the use of NADH fluorometry in situ during drug administration. The effects of phenytoin on cerebral and spinal cord electrical, ionic, and energetic activity were tested [29]. Following phenytoin, NADH oxidation was less than without phenytoin. Phenytoin caused a moderate but consistent depression of the stimulus-evoked responses of K+ activity, electrical potential, and oxidative enzymes. The responses of NADH to injection of ethanol in cats and rats were tested by LaManna et al. as well [30]. Low doses of ethanol induced an increase in NADH level, probably caused by a decrease in tissue activity. Higher levels of ethanol induced oxidation of NADH. The effects of phenobarbital on cerebral oxidative metabolism and on extracellular level of K+ were tested also [26]. Electrical stimulation induced transient increase in extracellular level of K+ and transient oxidation of NADH+. The injection of phenobarbital induced NADH reduction, indicating decreased oxygen consumption. Electrical excitability also decreased, but there was no change in the level of K+. Phenobarbital does not block electron transport between NADH and cytochrome aa 3 even when the tissue is in a “resting” level of oxygen consumption. The prolonged duration of metabolism recovery following phenobarbital results from the prolonged elevation of extracellular K+ activity. The slow recovery of extracellular K+ level to basal levels results from the effect of phenobarbital on the passive clearance mechanism. In 1977 O’Connor et al. discussed the origin of labile tissue fluorescence in cat brain as evaluated during seizures, where NADH was oxidized [31]. The study results claimed that (1) cortical fluorescence in vivo results from mitochondrial NADH; (2) the vast majority of the mitochondria in the cortex are in neurons or their processes; and (3) most of the NADH oxidation during seizures is caused by increased ion pumping.
Rosenthal and Martel in 1979 [32] showed that incomplete ischemia was associated with decreased excitability and amplitude of metabolic responses to stimulation. When NADH increased, the brain continued to respond to SD by oxidation of NADH, indicating that the ability to increase mitochondrial respiration still exists. Short ischemic periods produce alterations in oxidative metabolism capabilities, indicating respiratory uncoupling. Under such conditions, a decreased capacity to respond to increased metabolic demands was developed.
A few more papers were published by the Jobsis group. Hempel and Jobsis in 1979 [33] found that the reduction of cytochrome aa 3 precedes the reduction of NADH, indicating that in the living brain NADH maintains its resting oxygen state in lower oxygen tensions than cytochrome aa 3. In another study published by Hempel et al. [34], seizures were induced in anesthetized cats and NADH and cytochrome aa 3 levels were simultaneously measured from the cerebral cortex. In normotensive animals seizures were accompanied by NADH oxidation. In hypotensive cats a biphasic oxidation reduction response was observed, whereas in severe hypotension NADH was reduced and cytochrome aa3 was oxidized.
Novack et al. in 1982 [35] found that ethanol and acetaldehyde slowed the rate of oxidation of NADH following electrical stimulation. This slowed mitochondrial oxidation results from the inhibition of Na+/K+-ATPase. Ethanol and acetaldehyde inhibit the processes that lead to increased oxygen consumption following cell depolarization. The effect of hypoglycemia induced by insulin infusion was studied by Bryan amd Jobsis in 1983 [36]. Insulin induced a fall in glucose level and oxidation of NADH; the EEG became isoelectric. When glucose was infused, EEG recovered, and NADH redox level increased. This study indicates that the responses of in vivo mitochondria to the absence or presence of glucose are similar to those of isolated mitochondria. In a second study by Bryan and Jobsis [37], hypoglycemia that was accompanied by isoelectric EEG (induced by insulin infusion) induced oxidation of NADH. Infusion of glucose led to normal EEG activity, and NADH was reduced back to its initial level. Hyperglycemia induced no further decrease of NADH level.
Another group of scientists was established at the NINDS/NIH in Bethesda after initial collaboration with the Jobsis group. In 1972 O’Connor et al. [38] found an increase in energy utilization during seizures with return to lower levels during the postictal depression of electrophysiological activity. The question is whether the metabolic changes are necessary for the development of the seizure or if they are a secondary response of the tissue. They showed a decrease of NADH levels preceding any electrographic signs of epileptiform activity induced by penicillin. Additionally, NADH levels were closely correlated with further development of ictal and interictal events and with disappearance of electographic signs of epileptogenicity. In the next paper, published in 1973, O’Connor et al. [39] tested the correlation between increased extracellular K+ with oxidative metabolism and with epileptiform activity in the cat cortex. Tissue level of NADH decreased with the increase in K+ concentration in the bathing solution. Maximum decrease of NADH was seen at a level of 20–30 mequivalent K+/l, further increase in potassium yielded NADH reduction. Epileptic seizures induced by penicillin showed similar changes. Lewis et al. [40] studied the connection between mitochondrial NADH and extracellular potassium. Penicillin induced seizures that were characterized by increase oxidative metabolism. The application of cerebrospinal fluid (CSF) with high levels of K+ to the hippocampus induced epileptiform activity and NADH oxidation. This study tested the application of high potassium in the CSF on the hippocampus penicillin focus. In 1975 Lewis and Schuette [41] monitored the NADH and extracellular K+ level simultaneously in the hippocampus in vivo during increased activity induced by electrical stimulation and epileptic activity. NADH was oxidized when the K+ extracellular potassium level increased. The increase in K+ was greater as stimulation was more intense. Lewis and Schuette in 1976 [42] continued this study and added the monitoring of blood flow in the sagittal sinus and sinus hemoglobin saturation to the NADH measurement under direct cortical stimulation of the anterior and mid-suprasylvian and marginal gyri in cat brain. The peak levels of oxygen consumption and NADH fluorescence usually correlated within seconds of one another. There were high correlations between the maximum changes in these parameters following stimulation. There was correlation between the changes in K+ level and oxygen consumption. Vern et al. [43] studied the possibility of using sodium fluorescein fluorescence as a reference for NADH fluorescence. The study showed that sodium fluorescein fluorescence is a better reference than the reflectance of UV in the cat cortex. The monitoring of NADH in the fluorometric technique is affected by changes in CBV that are taken under consideration by the subtraction of tissue reflectance of UV light. However, when there is a need to measure large areas or tissues in which there are massive changes in blood flow, another reference to NADH should be used such that it will not be affected by reflectance changes but rather will be affected in the same way as NADH fluorescence from changes in blood flow. In 1976 Vern et al. [44] measured changes in NADH levels during seizures induced by metrazol in normotensive versus hypotensive cats. The study suggested that cortical NADH fluorescence is dependent both on metabolic demand and O2 availability and therefore may be utilized as an indicator of activated cortical oxidative metabolism during seizures only under conditions of adequate cortical oxygenation. Later on, Vern et al. in 1979 [45] measured changes in NADH, oxygen consumption, and K+ extracellular level following seizures induced by pentylenetetraxol. Non-ischemic seizures were characterized by NADH oxidation, an increase in oxygen consumption, and a rapid increase in K+ extracellular level. However, ischemic seizures were associated with more complex changes in NADH fluorescence, a smaller and delayed increase in oxygen consumption, and a more sustained increase in K+ extracellular levels. Oxygen-dependent transport mechanisms play a major role in the removal of K+ during and following the termination of generalized pentylenetrazol seizures in the cat.
In 1981, Vern et al. [46] found that electrical stimulation of the reticulocortical area yielded a reversible increase in blood pressure, CBF, and O2 consumption and decrease in NADH fluorescence. There was a linear correlation between increased oxygen consumption, BP, and decrease in tissue cortical NADH fluorescence (oxidation) after electrical stimulation of the reticulocortical area in the brain.
Another group of scientists, under the leadership of Prof. A.G.B. Kovach and E. Dora, contributed a large number of studies in which NADH was monitored in the brain of the cat during different pathophysiological perturbations. They published papers on this subject between 1976 and the mid-1980s.
The correction of NADH for blood flow artifacts was tested in cats following hemorrhagic shock and graded hemorrhage. It was concluded that the value of correction is influenced by the level of cerebrocortical mirror reflectance, the geometry and intactness of the capillary network illuminated [47]. In 1976, Kovach et al. [48] found that during hemorrhagic electrical shock, NADH fluorescence, hemodynamic and biochemical damage occurs; this includes damage to the central nervous system although not in a uniform way. In 1977 Kovach and his group published three papers. Changes of blood flow and content can cause artifacts in NADH fluorescence [49]. The importance of reflectance correction for NADH fluorometry measurements following electrical stimulation and shock was discussed.
When there was an increase in cerebral electrical activity, there was an increase in CBF [50]. Following increased electrical activity, NADH was reduced under normal blood pressure and NADH was oxidized under low arterial pressure. The CNS is vulnerable to prolonged hemorrhagic hypotension and shock [8]. EEG and somatosensory evoked potentials disappear during hypovolemia and return only after reinfusion. There are also metabolic and functional alterations, suggesting that the CNS is seriously affected. There was early damage of the mitochondrial function during hemorrhagic shock. Inhibition of state 3 respiration (in isolated mitochondria) increased as hypotension lasted for longer durations. Later on, in 1978 [51] they found that the autoregulatory range of CBF arterial blood pressure is 50–200 mmHg. Following bleeding, NADH increased although reflectance decreased implying a massive vasodilation. On reinfusion of the blood only a small percentage of NADH was reoxidized, implying that NADH reduction in this stage does not result from mitochondrial hypoxia, but rather from substrate movement and cytoplasmic NADH. The cerebral vessel response to hypotension was mediated by the sympathetic system, as can be concluded from the absence of early vasoconstriction and NADH reduction when α-blocker was used.
The increase in NADH following anoxia was smaller during the hypovolemic phase of shock [52]. There was uncoupling between mitochondrial respiration and oxidative phosphorylation during the beginning of bleeding as seen by the overshot of NADH oxidation seen immediately after anoxia, when the cat breathes air. The hypovolemic stage of shock-induced irreversible damage to the cerebral cortex, as seen by the absent response of NADH to anoxia.
In 1981, Kovach and Dora [53] discussed the use of the fluorometric technique for the evaluation of the cerebral autoregulatory mechanism. Sudden changes in arterial pressure within the autoregulatory range induce biphasic changes in cerebral blood volume. Hypertension will induce an increase in CBV following by vasoconstriction and a decrease in CBV and vice versa. This study denies the role of adrenergic α-receptors in the autoregulatory mechanism of the brain
The effects of organic calcium antagonist (D600) on cerebral NADH levels in response to adenosine, anoxia, and epileptic seizures was published by Kovach et al. in 1983 [54]. The organic calcium antagonist prevents the inflow of calcium into smooth muscle cells and prevents the relaxation of these muscles, thus preventing vasodilation. NADH was reduced following adenosine administration. The inhibitory effect of D-600 on epilepsy and anoxia-induced cerebrocortical NAD reduction demonstrates the role of calcium fluxes in glycogen and glucose metabolism under these conditions.
Kovach et al. in 1984 [55] found that extracellular adenosine plays a minor role in cerebral vasodilation. Intracellular adenosine might dilate cerebral vessels during hypoxia or epileptic seizures. In this mechanism calcium influx has a minor role.
Gyulai et al. published two papers on NADH monitoring. In the first one [56] they tested if microvessels in the cat cortex are maximally dilated following severe hypercapnia. Results showed that not all segments were dilated during severe hypercapnia. The role of H+ ions in dilation of the microvessels of the brain cortex was limited. In the second one [57], changes in NADH level following brain stimulation and hypercapnia were tested. NADH became oxidized during hypercapnia probably caused by inhibition of carbohydrate metabolism. The level of oxidation was higher as hypercapnia was greater. NADH increased following electrical stimulation. This response was not affected by hypercapnia of 10 % but was decreased by 15–30 % CO2, probably caused by an increased rate of substrate mobilization. In 1978 Dora and Kovach found that proxyphilline does not change cortical vascular volume but shifts the NAD/NADH redox state toward oxidation, although blood pressure drops. Coumarin dilates the cerebrocortical vessels, increases blood flow, increases the rate of glycolysis and lactate/pyruvate ratio, and increases NADH level. At high doses it also led to epileptic activation [58].
In another study they found that electrical stimulation at normal conditions induce an increase in NADH level and an increase in CBF. At the hypovolemic phase of hemorrhagic shock, electrical stimulation induced oxidation of NADH in most of the experiments although in some experiments there was no change in NADH level. This total loss of reactivity to electrical stimulation prolonged the period of cortical ischemia during the hypovolemic phase of hemorrhage. After reinfusion of the shed blood there is no improvement of the reactivity of blood vessels to electrical stimulation, indicating the development of irreversible damage during the hypovolemic phase. According to the present study, the changes in energy metabolism during hemorrhagic shock are more severe than those after a 60-min ischemia of the brain, suggesting that in addition to tissue hypoxia there are other factors that affect cerebral energetic metabolism during hemorrhagic shock. There is probably a negative balance between oxygen supply and demand [59]. The effects of dexamethasone following two steps of hemorrhage in the cat cortex were published in 1980. Hemorrhage increased NADH level in control cats although the increase in dexamethasone was smaller. In some experiments the brain became ischemic following 40 mmHg MAP. Dexamethasone pretreatment did not eliminate the shock-induced decrease in cortical intracellular oxygen tension and the deterioration of ECoG [60].
In 1981 Dora et al. [60] found that oscillations of NADH at a rate of a few seconds are at the level of metabolites controlling enzymatic reactions. The arterial blood pressure waves are based on the glycolytic oscillation of the medullary cardiovascular center. This study presents three types of oscillations. Waves that are induced following pressure waves in the arterial blood pressure induce oscillations in CBF and in brain metabolism but these metabolic changes are small because there was no change in EEG. The second type of NADH oscillations were induced following a long-lasting absence of oxygen supply with the administration of substrate. They are irregular and are related to biochemical changes. The third type are at a rate of 6 to 12 waves/min and include oscillations of blood flow followed by oscillations of NADH, indicating high coupling between oxygen supply and demand. These oscillations can be abolished by hypercapnia, anoxia, and hyperemia [61].
In the next step, the effects of stepwise hypotension and hypertension on NADH in the cat were tested. Long-lasting stepwise hypotension induced gradual increase in CBV and NADH. Although blood pressure was 80 mmHg and cerebral blood vessels were dilated, NADH was shifted toward a reduced state, implying that during hypotension other factors other than tissue hypoxia are responsible for dilation of cerebral blood vessels. After restoration of arterial blood pressure, CBV did not decrease and NADH remained high, showing the loss of autoregulatory capability of the cerebral vessels and that tissue metabolism was irreversibly altered. Following a 5-min moderate hypotension or hypertension the changes in CBF and NADH were biphasic and the changes in NADH were more rapid than those of blood vessels, indicating that myogenic mechanisms have a minor role in CBF autoregulation. Vasoconstriction in the brain following hypotension was not mediated by adrenergic α-receptor [62].
In 1983 topical administration of epinephrine, norepinephrine, and acetylcholine on cerebrovascular volume decreased and NADH was oxidized. Pial veins constricted twice as much as pial arteries. Acetylcholine dilated pial arteries and slightly constricted pial veins and had no effect on NADH, indicating that the normal brain is well oxygenated [63]. The effects of topical inhibition of glysolysis on epilepsy induced changes in NADH [64]. Sodium iodoacetate induced NADH oxidation and increased cortical vascular volume. Also, the epileptic seizures were associated with NADH oxidation instead of NADH reduction. However, in the intact brain during seizures NADH shifted toward NADH reduction rather than NADH oxidation.
The effects of amytal (inhibitor of complex I) and cyanide (inhibitor of complex III) on NADH were compared to anoxia in cat brain cortex in 1984. Amytal and cyanide yielded a reversible increase in NADH level and a massive dilation of cerebrocortical vessels long before NADH reached its maximal increase. Amytal induced a smaller increase in NADH level than cyanide and anoxia, although vasodilation was almost similar [65]. In 1984 Dora et al. found that superfusion of the brain of normally breathing animals did not induce NADH oxidation or vasoconstriction, implying that the brain cortex of normal animals is well supplied with oxygen. The topical application of metabolic vasodilators did not lead to NADH oxidation: 25 min of anoxia-ischemia induced a twofold increase in NADH level compared to 2 min of anoxia. The mitochondria were not damaged even 30 to 60 min after complete brain ischemia (decapitation), as seen by the full recovery of NAD+ following perfusion with CSF saturated with oxygen [66].
The same group found that spreading depression responses in the cat brain were not altered by arterial hyperoxia. Electrical stimulation induces NADH elevation and blood volume increase. This response was not caused by tissue hypoxia but by the excessive production of reduced equivalents by the mitochondria [67]. In 1985 they found that the comparison between anoxia with blood flow and anoxia with “no flow” in the cat cortex showed a larger increase (threefold increase) in NADH following no-flow anoxia [68]. In 1985, Dora et al. checked the effect of topically applied adenosine on NADH by a microscope fluororeflectometer. Adenosine induced significant reduction of NAD, possibly not only caused by vascular response but also by increased substrate mobilization and possibly cAMP production, which increases the vasodilatory effect of adenosine [69].
Using the MCA occlusion model, the effects of 2 h of MCA occlusion with 4-h reperfusion in cats on NADH level was tested. Decrease in CBF was similar in all three levels of MCA occlusion. Immediately after MCAO, NADH increased by 50 %. Following reperfusion, NADH was oxidized in all groups with overoxidation in severe ischemia. In moderate ischemia there was a second oxidation phase of NADH at the reperfusion phase, which may be related to cessation of mitochondrial electron transport in the dying cells accompanied by anaerobic glycolysis in other cells. The spontaneous oxidation in the severe group may be the result of insufficient supply of reducing equivalents into the mitochondria and or release of oxidizing substrates in the brain [70].
Topical application of acetylcholine did not change NADH levels in the brain, indicating the hypoxic micro-regions in the brain are not biochemically hypoxic. Adenosine did not change CBF, implying that it is not one of the agents that contributes to maintenance of the tone of the cerebrocortical arteries. The middle cerebral artery is sensitive to acetylcholine [71]. In 1986 Dora [72] found that arterial hypoxia led to a similar increase in NADH level with or without theophylline, indicating that adenosine receptors are not involved with the vasodilation following hypoxia. Epileptic seizures induced NADH reduction, caused not by hypoxia but by the limiting rate of mitochondrial oxidation of the reduced equivalents during the seizure.
In 1988, Dora et al. evaluated the severity of MCA occlusion for 60–120 min w by the degree of ECoG depression at the reperfusion phase. The severity of stroke was not correlated with the alterations of CBF during reinfusion. Cerebral grey matter glucose consumption increased in mild and moderate stroke but decreased in severe stroke. The ratio of NAD/NADH was not changed in the mild stroke, was shifted toward reduction in the moderate stroke, and was oxidized in the severe stroke. This difference applies to different mechanisms of damage in the brain under these three levels of injury [73].
The group in Philadelphia, under the neurologist Prof. M. Reivich, contributed a significant number of publications in the field of NADH monitoring in cat brain. One of the initial studies was published by Harbig et al. in 1976 [74] in which they monitored pyridine nucleotides fluorescence in the cat cortex using a cranial window. The artifacts of hemoglobin were prevented by the monitoring at the isobestic point and monitoring of reflectance. In the same year Ginsberg et al. [75] found that NADH levels and CBF (autoradiography) were monitored in cats following MCAO. Immediately following the occlusion NADH increased by up to 40 % and within minutes fluorescence decreased. In some animals peak NADH was correlated with the extent of blood flow reduction in the ischemic location.
Welsh and Rieder in 1978 [76] measured NADH fluorescence in frozen brain slices from a cat. In deep regions, in which ischemia was found, NADH was increased. The study showed that in situ freezing of cat brain adequately preserves metabolite levels in most regions. In another study, Welsh et al. in 1977 [77] measured the differences in regional blood flow following ischemia in the cat brain. Alterations in high-energy phosphate molecules were more heterogenous in the white matter. NADH fluorescence from frozen brain slices showed a micro-heterogenous increase mostly in the cortex, moving from normal to increased NADH bands. Continuous monitoring of NADH also revealed heterogenosity with respect to time and space.
In 1979 Eke et al. [78] calculated the optical density of the cerebral cortex in cats from the ratio between the diffused scattered light intensity for a given instant and that of the blood-free cerebrocortical tissue. The study showed that the micro-reflectometric indicator dilution method together with NADH micro-fluorometry offer the possibility to correlate tissue micro-hemodynamics and metabolism at the same minute and at the same volume of the brain cortex.
In 1980 Gyulai et al. [79] analyzed previous studies that showed the relationship between electrical stimulation and the NADH redox state of the brain. Most studies showed a decrease of NADH level, namely the oxidation of NADH, whereas others showed an increase in NADH level that sometimes was preceded by NADH oxidation. This study showed that it depends on the duration of stimulation. Less than 0.5-s stimulation induces NADH oxidation whereas longer durations induce NADH oxidation. Welsh et al. in 1982 [80] described the following experiment and results.
Bilateral carotid artery ligation was induced in cats with hypotension and the brain (CBF and NADH) was monitored through a cranial window. Immediately after perfusion, hyperemia was seen, but 60 min later hypoperfusion occurred. There was also a failure in oxygen reduction capability as seen by the decreased response to short anoxia following ischemia. However, the fact that NADH completely recovered although CBF was at hypoperfusion indicates that oxygen delivery was not the limiting factor inducing redox NADH reduction. Resynthesis of ATP was impaired, probably because of defective synthesis of NADH rather than limited oxygen level.
Later on, Welsh in 1984 [81] monitored NADH in frozen sections. Ischemia to the brain induces variability in the ischemic degree at various regions of the brain. Therefore, when experimental results are compared they should be analyzed by methods that are similar in their spatial resolution.
The effect of anti-ischemic drugs on NADH fluorescence was published by Tanaka et al. [82]. Cats were exposed to MCAO with or without GM1 (ganglioside in the brain that enters the BBB and integrates in the neuronal membrane) injection. CBF increased in the ischemic areas in the cats treated with GM1, with a decrease in cerebral local glucose utilization and a decrease in histological damage suggesting that GMI may produce metabolic depression that maintains normal flow–metabolism coupling and prevents ischemic structural damage. The changes in NADH were described in detail. In another paper [83], Tanaka et al. in 1986 tested the correlation between brain NADH fluorescence, blood flow, ECoG, and histology under ischemia. Cats underwent 2 h of MCAO with 4-h recovery. NADH was oxidized at the recovery phase following severe ischemia, whereas it was reduced in mild and moderate ischemia. It seems that there is a relative substrate deficiency and or a loss of mitochondrial enzymatic pool size in the severe MCAO group. Anaerobic glycolysis may be activated in the moderate group whereas in the mild group there is an increase in aerobic glucose metabolism.
In 1989 Urbanics et al. [84] tested the effects of ganglioside GM1 in focal cerebral ischemia in cat brain induced by MCAO of 2 h with 4 h of reperfusion. Cats were divided into those with mild stroke and moderate stroke. GMI increased cerebral metabolic rate of glucose in mild stroke in the peripheral areas. GMI had no effect on the rest of the parameters monitored, namely, CBF, NADH, EEG, and extracellular K+.
In another paper published by the same group in 1992, Araki et al. [85] studied the effects of SOD on Ca2+ extracellular levels and NADH fluorescence during MCAO and reperfusion. SOD decreased the level of extracellular Ca2+, which induced a smaller infract area than the one seen in cats that were not treated with SOD. NADH became reduced immediately following MCAO, followed by a gradual and partial recovery within the occlusion phase. Following reperfusion NADH was oxidized in both groups.
In three papers, Paschen et al. [86–88] studied brain slices by bioluminescence technique (not in vivo monitoring). The occlusion of the MCA induced a decrease in glucose concentration and in ATP and an increase in NADH fluorescence. NADH was measured in brain slices following MCA occlusion. It was concluded that in focal ischemia the size of the infarct depends on the reduction in flow and that accounts for the reduction in the pool of NAD/NADH that is responsible for the disturbance in energy production metabolism. The same approach was used by Bothe and Paschen in 1986 [89]. A method of inducing cerebral abscesses in the cat brain (the white matter) was used by infection with Staphylococcus aureus. NADH was monitored in brain slices taken from the areas of the abscess, which showed a reduction in cellular oxygen availability.
8.3 Monitoring the Heart
Monitoring of NADH in the blood-perfused heart muscle requires the opening of the chest unless the perfused heart in vitro is monitored. The in vivo studies were based on the information accumulated in isolated mitochondria from the heart and other organs [93]. This study suggests identifying sites for oxidation phosphorylation in the intact mitochondria isolated from different organs.
One of the early studies in monitoring the NADH in the heart was published by the Jobsis group (Fig. 8.4) [94]. The effects of regional ischemia, induced by LAD (left anterior descending artery) occlusion were recorded in the mongrel dog heart. As seen in Fig. 8.4a, there is a clear increase in fluorescence while the reflectance trace shows very small changes. Therefore, the corrected fluorescence (F − R) was very clear. The NADH signal was not recovered before the release of the LAD clamp, suggesting that the monitored area was furnished by the LAD alone. When the probe was located between the LAD and LC (left circumflex artery), the elevated NADH (Fig. 8.4b) caused by LAD occlusion was recovered spontaneously, indicating the collateral supply from the LC. Only after the release of the LAD and the LC did NADH recover to baseline. In both records the reflectance trace shows a small decrease, indicating that the blood volume in the monitored area was elevated.

Fig. 8.4
a Typical fluorescence and reflectance response to 50-s occlusion of left anterior descending artery (LAD). Fluorescence is shown at top; corrected fluorescence (F − R) at bottom. Fluorescence and reflectance traces are original records; the F − R trace was calculated. b Area of left ventricular myocardium studied in this record was between the LAD and left circumflex (LC) coronary arteries. Sequential ligation of first the LAD and then the LC demonstrates collateral flow from LC coronary artery as manifested by spontaneous fall in the F−R record before occlusion of the LC coronary artery results in a maximal steady level of fluorescence change. (© Walters Kluwer Health, reprinted with permission [94])
In the early 1980s, a group of scientists in France initiated by Guy Renault developed a new fluorimeter (Fig. 8.5a) to monitor NADH in the heart and other tissues [95]. The response of the heart to irreversible ischemia, induced by injection of a high dose of pentobarbital, is presented in Fig. 8.5b [96]. The increase in NADH levels started immediately after the injection whereas the reflectance signal was relatively stable during the ischemia. Table 8.2 presents the publications in which NADH fluorescence was monitored in the heart of various animals exposed to various perturbations.

Fig. 8.5
a Block diagram of optical system of laser fluorometer. (© Springer Science, reprinted with permission [95].) b Recording of I (reflectance), F (fluorescence), and F 0 (corrected fluorescence) responses to a cardiorespiratory arrest induced by a fast 60-mg pentobarbital injection. Arrows indicate beginning and end of injection. The three parameters are expressed in arbitrary units as defined in the text; the value of the ordinate unit is given for each parameter. (© John Wiley and Sons, reprinted with permission [96])
The principal animals used for the monitoring of heart NADH were rabbits and dogs. It’s important to note that monitoring the heart in small animals including the rabbits was done in the blood-free perfused heart or by mapping the NADH in the beating heart in vivo. To monitor in real time the NADH in the beating heart it was necessary to use the dog or other large animals. In large animals NADH was monitored mainly by connecting a fiber-optic probe to the beating heart muscle or by the fluorescence photography technique.
The dog is the best animal model to study NADH in real time by fiber-optic-based fluorometry reflectometry.
The technique was developed by Kedem and Mayevsky in the early 1980‘s [97].
NADH was monitored in a local region of the myocardial surface in dogs. The basic technology was presented in Figs. 4.20 and 6.6. Transient anoxia reversibly increased NADH levels. Increased heart rate also increased NADH levels followed by an increase in coronary blood flow, indicating a change in O2 balance.
In the next study the effect of heart rate on NADH redox state was tested [98].
An increase in heart rate above 150 bpm under normal conditions increased NADH level, although this was not seen under hypopnea.
The effect of local ischemia was studied by the same group [99].
It was found that ligation was followed by an immediate fall in local coronary blood flow to the ischemic region, accompanied by a sharp elevation in NADH redox level.
In another study [100] the responses of the dog heart to increasing heart rate, noradrenalin, or ouabain infusion were recorded. It seems that there is a relationship between NADH redox level and cardiac reserve. In animals in which initial NADH was elevated, the cardiac reserve was smaller than in those where NADH was decreased. Using the two-sites monitoring technique, Furman et al. [101] found that NADH level was significantly higher during global versus regional ischemia in the heart. The effects of vasodilators were tested by Dvir et al. in 1985 [102]. They found that NADH increased with increased heart rates following nitroglycerin as well as following CO2, but the absolute NADH levels were consistently lower following this vasodilation. Nitroglycerin induced the maximum decrease in NADH level in all heart rates that were tested. The usage of coronary vasodilators in the model of ischemic myocardium prevented the increase in NADH levels that was previously observed following pacing of the untreated ischemic myocardium [103]. The effects of paired electrical stimulation were tested by Acad et al. [104]. The ratio of contractile force/blood supply was usually proportional to the NADH redox level (oxygen balance). Nevertheless, it was shown that the NADH redox level cannot be predicted quantitatively by the force/supply ratio. In another study [105] NADH was monitored in the dog heart following three perturbations: tachycardia, noradrenalin infusion, and increased coronary blood flow. Tachycardia increased NADH fluorescence, indicating impaired myocardial oxygenation. Noradrenaline and increased coronary blood flow by hypopneic respiration decreased NADH level. Acad et al. in 1987 [106] found that high doses of nitroprusside induced a decrease in MAP and increased NADH level in the heart tissue. Two more papers were published by the same group [107, 108]. NADH fluorometry was used for the evaluation of regional myocardial oxygen balance [109]: isoprotrenal increased global myocardial oxygen consumption and regional myocardial oxygen extraction and NADH fluorescence were elevated, indicating impaired tissue oxygenation.
Other studies on the dog beating heart were performed by Osbakken and Mayevsky and Osbakken et al. in Philadelphia. In a group of studies [110–112]:
NADH fluorescence in combination with 31P-NMR were used for the evaluation of oxidative phosphorylation during hypoxia and norepinephrine injection. Hypoxia increased NADH and decreased the ratio PCr/ATP, whereas noradrenaline, which increased pressure loading (by increased coronary blood flow), decreased NADH level. In another study, acetylcholine induced an increase in NADH level in the heart; immediately after the infusion of acetylcholine stopped, NADH started to decrease [113].
The other paper reviewed the group study [114] wherein NADH and 31P-NMR were used for the evaluation of myocardial physiology (cat and dog) under various conditions: volume/pressure loading, hypoxia, and ischemia. Results showed that myocardial bioenergetics function is stable under various loading conditions so long as there is no ischemia. During hypoxia NADH has a regulatory role, and under pressure loading there are other additional regulators except for NADH such as phosphorylation potential, ATP, and ADP levels. Another approach was developed and used in the last study of this group [115]: this was the first time that the MPA (containing NADH, LDF, K+, Ca2+, Na+ mini-electrodes) was applied to heart monitoring (dog) following ischemia of the anterior descending coronary artery and following hypoxia.
A few more groups published papers on NADH in the dog heart. Baron et al. in 1982 [116] tested the effects of lidocaine on ischemic myocardium. Lidocaine decreased NADH level. Thus, lidocaine protects the myocardium during ischemia. In 1983 Baron et al. [117] used NADH fluorescence to detect intracellular anoxia.
Hattan et al. [118] found that NADH levels were higher at the areas near the transmural channels than at the distanced areas, indicating that the creation of transmyocardial revascularization channels did not improve regional perfusion. The effects of piridoxylate (a cell respiratory regulator) on NADH levels were tested by Otorii et al. [119]. High levels of piridoxylate yielded a decrease in NADH levels, while ventilation with N2 yielded an increase in NADH levels.
Hori et al. in 1989 [120] used the freeze-clamped dog heart to monitor NADH fluorescence for the identification of an ischemic zone in the tissue. A significant increase in NADH fluorescence was observed in the inner layer of the cross-sectional slice obtained 5 s after coronary artery ligation, whereas ATP remained as high as in the non-ischemic area. In 1991 the same group [121] applied endothelin-1 on the epicardium and on the coronary arteries and found an increase in NADH level in the subepicardial tissue.
Miyazaki et al. in 1997 [122] tested the effects of hemorrhagic shock in the dog heart and found that NADH fluorescence was increased in the heart following hemorrhage at the level of 40 mmHg or less.
The large number of papers published by the group of Chance in Philadelphia were based on the technology of NADH fluorescence photography of the heart, applied to various animal models. The basic technique, presented in Fig. 6.23 [123], was used by Barlow and other scientists who collaborated with him in Philadelphia. In 1977, Barlow et al. [124] measured NADH, using the fluorometric method, from the myocardium of rabbits following ischemia. NADH increased within 15 s following ischemia and recovered within 60 s after reperfusion. NADH fluorescence assesses tissue supply:demand ratio. In 1978 Harken et al. [125] used the fluorometric technique for the evaluation of the border zones of ischemia in the heart of dogs.
The same type of studies were done by the same group in 1979 [126, 127]. The ischemic myocardium is characterized by contractility dysfunction. This study tested the relation between one episode of ischemia (60 s of coronary artery occlusion) and anoxia on contractility function in isolated rabbit heart. The level of NADH was used to identify areas of anoxia. Areas of ischemia were detected 2 s after coronary occlusion. An increase in NADH level indicated imbalance between myocardial oxygen supply and demand. Ischemic ventricular dysfunction occurred several seconds after the ischemia.
Using a micro-light guide technique by Ji et al. in 1979 [128], NADH fluorescence and UV reflectance were measured in the beating intraventricular septum of the rabbit. A mathematical equation characterizing the optical behavior of the two-way micro-light guide was developed. In a comparative study by Harken et al. in 1981 [129] the coronary artery was ligated in a rabbit, dog, pig, and monkey. The results showed a narrow “oxygen diffusion zone” of nonperfused, nonanoxic tissue. The width of this zone is inversely related to myocardial oxygen consumption. Foster et al. in 1984 [130] found that nifidepine together with reperfusion failed to protect the heart against the damage of ischemia in rabbits. There was no effect of nifidepine on infract size.
Fralix et al., in 1990 [131], using perfused rabbit hearts showed that the tissue optical absorbance significantly modifies the emission characteristics of NAD(P)H and Indo-1. This “inner filter” effect changed as a function of tissue oxygenation and redox state in a wavelength-dependent manner.
In 1993, Heineman and Balaban [132] studied the effect of afterload and heart rate on NADH level in the isolated rabbit heart. They compared the limited substrate or unlimited substrate conditions and found that when afterload was changed, NADH remained similar.
8.4 Monitoring of Skeletal Muscle
The skeletal muscle of a frog was the first organ in which NADH was monitored in vivo [1].
Using the gracilis muscle in the rat, van der Laan [133] measured NADH fluorescence together with oxygen pressure and femoral artery blood flow. Figure 8.6a shows the monitoring system using a CCD camera. In Fig. 8.6b the effects of anoxia on the monitored parameters are presented. A clear correlation between the drop in oxygen pressure and NADH fluorescence is noted. A few typical papers on NADH monitoring in muscle are presented.

Fig. 8.6
a Experimental setup of NADH videofluorimeter. A 100-W mercury arc lamp provided the 365-nm excitation light, selected by a 365-nm bandpass (BP) filter. UV light is directed at muscle surface via a dichroic mirror (DM) that is translucent for the emitted fluorescence. A 470-nm BP filter selects NADH fluorescence, and images of skeletal muscle are recorded with a second-generation CCD camera. A circular piece of uranyl glass is positioned in the lower left corner of the NADH fluorescence image. b Relative NADH fluorescence intensity (A), tissue oxygen pressure (B) of the gracilis muscle, and blood flow through femoral artery (C) of a mechanically ventilated rat. After 7 min of normoxia, O2 in respiratory gas was replaced with N2 (1). At 9 min O2 was substituted for N2 in respiratory gas (2) and skeletal muscle was reoxygenated. After recovery period (9–26 min), clamp was placed on abdominal aorta (3). Occlusion was maintained for 1 h (26–86 min); thereafter, perfusion of the hindlimb was restored (4) (86–103 min). (© Reprinted with permission from Elsevier [133])
Later on, skeletal muscles of other animals were studied as well (Table 8.3).
Table 8.3
Monitoring of NADH in various organs of different animals
Organ | Animal | Published papers [Reference numbers] |
|---|---|---|
Skeletal muscle | Rats | |
Pigs | [386] | |
Dogs | ||
Cats | ||
Rabbits | ||
Guinea pig | ||
Frog | ||
Liver | Rats | |
Primates | [522] | |
Pigs | [386] | |
Rabbits | ||
Guinea pig | [386] | |
Pigeon | [401] | |
Gerbil | [272] | |
Mice | [333] | |
Kidney | Rats | |
Dogs | [143] | |
Rabbits |
In 1968 Jobsis and Stainsby [134] measured the NADH redox state in a dog muscle. The NADH became more oxidized during contraction of the muscle. They concluded that oxygen supply was not a limiting factor in the respiratory chain activity. Olgin et al. in 1986 [135] monitored NADH and flavoproteins fluorescence during the transition from rest to heavy work in the gracilis muscle. The sample was frozen and analyzed in the low-temperature scanner.
Three papers were published by the group from Tucson, Arizona. Koller and Johnson in 1996 [136] monitored NADH fluorescence and absorbance of pyridine nucleotides in vivo and simultaneously follow the changes in diameter of the microvessels in the skeletal muscle.
Toth et al. in 1996 [137] tested if there are local regions in resting skeletal muscle in which oxygen delivery is insufficient to support oxidative metabolism. The muscle tissue was monitored in 61 locations following ischemia. There was no change for almost a minute in NADH fluorescence following the ischemic episode. In the next minute, it rose within to 55 % above the initial level in most of the locations. This result indicates that in resting muscle tissue oxygen supply is sufficient to support oxidative metabolism in more than 95 % of the tissue.
Pal et al. in 1998 [138] evaluated tissue metabolism in the skeletal muscle during sympathetic stimulation by monitoring NADH fluorescence. Mostly there were no changes in NADH fluorescence during stimulation. Hyperemia was seen only when NADH increased during stimulation, indicating that the resting level of blood flow is above tissue demands. Thus, only when tissue demands increase above oxygen supply (NADH increase) does hyperemia develops.
8.5 Liver Monitoring
The liver was one of the main organs in which NADH was monitored in isolated mitochondria, perfused organ, and also in blood-perfused liver. The rat liver was the main model used in those studies (Table 8.3).
The monitoring system used, by the group in Philadelphia, to measure NADH in the perfused system was published in 1969 [139]. They compared the response of NADH and flavins fluorescence to anoxia. Under anoxia, the NADH was elevated (increased signal) and the flavins also became reduced (decreased signal).
Figure 8.7a shows the monitoring system used by the group of scientists collaborating with Prof. Manfred Kessler in Erlangen, Germany [140]. They monitored the blood-free perfused rat liver in vitro. In addition to NADH fluorescence, other physiological parameters were monitored simultaneously. The effects of ischemia and anoxia on NADH fluorescence were compared (Fig. 8.7b). In another study by the same group [141] of the effects of no-reflow anoxia on NADH, tissue pO2, and surface pH (Fig. 8.7c), a clear correlation was found between the responses of the three parameters.

Fig. 8.7
a Schematic drawing of perfusion setup (self-explanatory). b NAD(P)H fluorescence increase caused by “sudden” ischemia (upper trace) and ischemia preceded by N2 anoxia (lower trace). (© Reprinted with kind permission of Springer Science + Business Media. [140].) c Changes in tissue pO2 (mean value ± SD) and NAD(P)H fluorescence during first 60 s after onset of no-flow anoxia. (© Reprinted with kind permission of Springer Science + Business Media. [141])
The effects of ischemia on NADH and microcirculatory blood flow in the blood-perfused liver are presented in Fig. 8.8 [142].

Fig. 8.8
Effects of hepatic artery (HA) portal vein (PV) occluded alone or in combination (H + P) on LBF (liver blood flow) and NADH redox state in two typical rats. (© Reprinted with permission from Elsevier [142])
The upper two traces were measured in one animal and the lower two from a second animal. Ischemia was induced by either occlusion of the hepatic artery alone, portal vein alone, or the two together where the NADH response was the largest.
8.6 Monitoring the Kidney
NADH monitoring in the kidney in vivo, in blood-perfused rat, was reported in 1962 by Chance et al. [4]. They found that the responses of the kidney were very similar to those recorded from the brain.
Kessler et al. [143] monitored the kidney of the dog in vivo. Typical results are presented in Fig. 8.9. The kidney was exposed to CO or N2; recovery from the perturbations are presented in the upper part (with CO) and lower part (anoxia by N2).

Fig. 8.9
Simultaneous measurements of NAD(P)H and venous pO2, in perfused dog kidney, after release of arterial clamp. (© Reprinted with kind permission of Springer Science + Business Media [143])
The NADH was recovered (oxidized) in correlation with the changes in oxygen levels. After anoxia the NADH recovery of the kidney was faster as compared to the CO-exposed kidney.
Figure 8.10 presents the monitoring system published by Kobayashi et al. [144, 145] and the results monitored under various perturbations. The system shown in Fig. 8.10a was using a mercury lamp, and two wavelengths (366 and 720 nm) were used as an excitation light. The 720-nm reflectance was used to correct the NADH fluorescence for hemodynamic artifacts. The effect of perfusion with N2-saturated saline and oxygen is presented in Fig. 8.10b (see legend for details). Figure 8.10c shows the effects of ischemia in the blood-perfused kidney. Figure 8.10d shows a comparison of the responses between the kidney, heart, and liver.

Fig. 8.10
a Experimental arrangement for compensated organ micro-fluorometry in situ. b Test of compensating analog computer for hemodynamic and oxidation–reduction changes of the isolated rat kidney. Hemodynamic change was produced by washing out blood corpuscles with nitrogen-saturated saline from the organ. Oxidation–reduction shift was caused by supplying oxygen. Signals from photodetectors were stored on magnetic tape of data recorder and reproduced for test. Result of operation of the computer is shown as a trace of “compensated fluorescence” that corresponds to oxidation–reduction signal of NADH. Intensity of fluorescence emitted from saline-perfused anoxic kidney was scaled as 100 %. Reflection intensity (720 mμ of anoxic kidney) was defined as 100 %. c “Pseudo-oxidation” induced by light clamping of vein from rat kidney in situ. This effect disappeared in the compensated fluorescence trace. Intensity of fluorescence emitted from resting kidney was scaled arbitrarily as 100 %, and intensity of light (720 mμ) reflected from resting organ was defined as 100 %. (© American Physiological Society, reprinted with permission [144].) d Changes in intensities of fluorescence and reflection from isolated organs upon substituting nitrogen-saturated saline for contained blood. Perfusion was commenced at time indicated by arrow. See text for scale of light intensity. (© American Physiological Society, reprinted with permission [145])
Table 8.3 (lower part) shows the papers published on NADH monitoring in various animals; the rat was the main animal monitored.
8.7 NADH Monitoring in the Gastrointestinal Tract
The number of studies in which the GI tract was monitored is very small (Table 8.4). To obtain good data, it is important to fixate the probe above the monitored tissue and in the GI tract (see Figs. 4.15 and 4.16).
Table 8.4
Monitoring of NADH in various organs in different animals
Organ | Animal | Published papers [reference number] |
|---|---|---|
GI tract | Mice | |
Rats | ||
Cats | ||
Rabbits | [561] | |
Guinea pig | [562] | |
Frog | ||
Cornea + lens | Rabbits | |
Cow | [459] | |
Rats | [568] | |
Mice | [571] | |
Pigeon | [580] | |
Spinal cord and PNS | Cats | |
Rats | [582] | |
Mice | [583] | |
Frog | ||
Bladder + prostate | Rabbit | |
Frog | ||
Carotid body | Cat | |
Rabbit | [592] | |
Mice | [593] | |
Skin | Pig | [594] |
Rat | [493] | |
Lung | Rat | |
Blood vessels | Dog | |
Rat | [603] | |
Uterus | Rat | [604] |
Rabbit | ||
Dog | [605] | |
Adrenal gland | Rat | [606] |
Corpus cavernosum | Rabbit | |
Diaphragm | Rat | [609] |
Hamster | [610] | |
Tumor surface | Rat | |
Electric organ | Electrophorus | [611] |
Optic nerve | Nectorius maculosus and rat | |
Axon | Squid | [614] |
Cartilage | Chicken | |
Tooth | Rat | [618] |
Eye | Blowfly | [619] |
Other Organs |
Figure 8.11a presents the responses of the ilial serosa and mucosa to short anoxia. MAP increased, and both layers of the intestine, the serosa and mucosa, responded by a decrease in TBF and increase of NADH. No significant differences were observed between the two layers (Mandelbaum M. et al., unpublished data). Therefore, we concluded that monitoring of the serosal side of the small intestine in a rat model is appropriate.
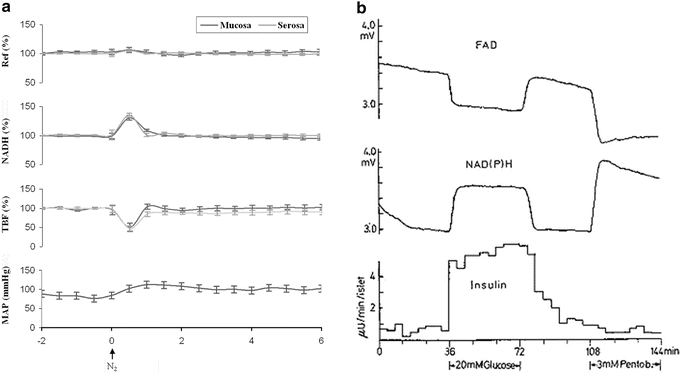
Fig. 8.11
a Responses of intestinal mucosa (dark gray) and serosa (light gray) in rat exposed to short anoxia (n = 8, mean ± SE. Ref reflectance, NADH mitochondrial NADH redox state, TBF tissue blood flow, MAP mean arterial pressure. (From Mendelbaum M et al., unpublished data.) b Effects of d-glucose and pentobarbital on FAD fluorescence (upper), NAD(P)H fluorescence (middle), and insulin release (lower) from single perfused islets. Each curve represents one of five experiments performed under the same conditions. All experiments gave similar profiles. A downward deflection of traces a or b represents a decrease of fluorescence light (recorded as mV). (© Reprinted with kind permission of Springer Science + Business Media [147])
In another study, the responses of the small intestine to successive hemorrhages were presented [146].
8.8 Monitoring of Other Organs
Monitoring of NADH in other organs was documented in a small number of papers (Table 8.4). Figure 8.12 shows the response of the spinal cord to ischemia in the rat model [148]. NADH and microcirculatory blood flow were recorded after occlusion of the abdominal aorta distal to the left kidney. Because the blood pressure was monitored via the femoral artery, the occlusion led to a decrease in pressure, although the systemic blood pressure was slightly affected. The data represent a group of 11 rats exposed to ischemia and 8 control animals.

Fig. 8.12
Responses of the various parameters to a 5-min abdominal aortic occlusion monitored from the spinal cord of a rat by the tissue vitality monitoring system (TVMS). Graph presents mean data ± SE. Horizontal arrows mark significant differences between values of ischemic group (n = 11) versus control group (n = 8) for each minute of monitoring. p < 0.05(*), p < 0.01(**), p < 0.001. (© Walters Kluwer Health, reprinted with permission [148])
References
1.
Chance B, Jobsis F (1959) Changes in fluorescence in a frog sartorius muscle following a twitch. Nature (Lond) 184:195–196
2.
Chance B, Legallias V, Schoener B (1962) Metabolically linked changes in fluorescence emission spectra of cortex of rat brain, kidney and adrenal gland. Nature (Lond) 195:1073–1075
3.
Mayevsky A, Barbiro-Michaely E (2013) Shedding light on mitochondrial function by real time monitoring of NADH fluorescence: I. Basic methodology and animal studies. J Clin Monit Comput 27:1–34. doi:10.1007/s10877-012-9414-5 PubMed
4.
Chance B, Cohen P, Jobsis F, Schoener B (1962) Intracellular oxidation-reduction states in vivo. Science 137:499–508PubMed
5.
Sundt TM, Anderson RE (1975) Reduced nicotinamide adenine dinucleotide fluorescence and cortical blood flow in ischemic and nonischemic squirrel monkey cortex. I. Animal preparation, instrumentation, and validity of model. Stroke 6:270–278PubMed
6.
Sundt TM Jr, Anderson RE (1975) Reduced nicotinamide adenine dinucleotide fluorescence and cortical blood flow in ischemic and nonischemic squirrel monkey cortex. 2. Effects of alterations in arterial carbon dioxide tension, blood pressure, and blood volume. Stroke 6(3):279–283PubMed
7.
Anderson RE (1975) Instrumentation for in vivo cerebral NADH studies in squirrel monkey. IEEE Trans Biomed Eng BME-22(3):220–224
8.
Kovach AGB (1977) Cerebral hemodynamic and metabolic alterations in hypovolemic shock. In: Reivich M, Coburn R, Lahiri S, Chance B (eds) Tissue hypoxia and ischemia. Plenum, New York, pp 343–370
9.
Sundt TM Jr, Anderson RE, Sharbrough FW (1976) Effect of hypocapnia, hypercapnia, and blood pressure on NADH fluorescence, electrical activity, and blood flow in normal and partially ischemic monkey cortex. J Neurochem 27(5):1125–1133PubMed
10.
Strong AJ, Smith SE, Whittington DJ, Meldrum BS, Parsons AA, Krupinski J, Hunter AJ, Patel S, Robertson C (2000) Factors influencing the frequency of fluorescence transients as markers of peri-infarct depolarizations in focal cerebral ischemia. Stroke 31(1):214–222PubMed
11.
Rampil IJ, Litt L, Mayevsky A (1992) Correlated, simultaneous, multiple-wavelength optical monitoring in vivo of localized cerebrocortical NADH and brain microvessel hemoglobin oxygen saturation. J Clin Monit 8(3):216–225PubMed
12.
LaManna JC (1975) In vivo control of oxidative metabolism monitored in intact cerebral cortex by optical techniques. Duke University, Durham
13.
Mayevsky A, Subramanian VH, Nioka S, Barlow C, Haselgrove J, Chance B (1985) Brain energy metabolism evaluated simultaneously in the newborn dog by 31P NMR spectroscopy and NADH fluorometry/reflectometry in vivo. J Cereb Blood Flow Metab 7:400–401
14.
Mayevsky A, Yoles E, Zarchin N (1986) Metabolic, ionic and electrical responses to oxygen deficiency in the newborn dog in vivo. Adv Exp Med Biol 200:261–269PubMed
15.
Mayevsky A, Subramanian VH, Chance B (1988) Brain oxidative metabolism of the newborn dog: correlation between 31P NMR spectroscopy and pyridine nucleotides redox state. J Cereb Blood Flow Metab 8:201–207PubMed
16.
Yoles E, Zarchin N, Zurovsky Y, Mayevsky A (2000) Metabolic and ionic responses to global brain ischemia in the newborn dog in vivo: II. Post-natal age aspects. Neurol Res 22(6):623–629PubMed
17.
Yoles E, Zurovsky Y, Zarchin N, Mayevsky A (2000) The effect of hyperbaric hyperoxia on brain function in the newborn dog in vivo. Neurol Res 22(4):404–408PubMed
18.
Jobsis FF, O’Connor M, Vitale A, Vreman H (1971) Intracellular redox changes in functioning cerebral cortex. I. Metabolic effects of epileptiform activity. J Neurophysiol 3465:735–749
19.
Rosenthal M, Jobsis FF (1971) Intracellular redox changes in functioning cerebral cortex. II. Effects of direct cortical stimulation. J Neurophysiol 34:750–762PubMed
21.
Rosenthal M, Somjen G (1973) Spreading depression, sustained potential shifts, and metabolic activity of cerebral cortex of cats. J Neurophysiol 36:739–749PubMed
22.
Rosenthal M, LaManna JC (1975) Effect of ouabain and phenobarbital on the kinetics of cortical metabolic transients associated with evoked potentials. J Neurochem 24:11–116
23.
Lothman E, LaManna J, Cordingley G, Rosenthal M, Somjen G (1975) Responses of electrical potential potassium levels, and oxidative metabolic activity of the cerebral neocortex of cats. Brain Res 88:15–36PubMed
24.
Rosenthal M, Martel D, LaManna JC, Jobsis FF (1976) In situ studies of oxidative energy metabolism during transient cortical ischemia in cats. Exp Neurol 50:477–494PubMed
25.
Rosenthal M, Martel DL, LaManna JC (1976) Effects of incomplete and complete ischemia on mitochondrial functioning measured in intact cerebral cortex of cats. Exp Neurol 52:433–446
26.
LaManna JC, Cordingley G, Rosenthal M (1977) Phenobarbital actions in vivo: effects on extra cellular potassium activity and oxidative metabolism in cat cerebral cortex. J Pharmacol Exp Ther 200(3):560–569PubMed
27.
Somjen GG, Rosenthal M, Cordingley G, LaManna J, Lothman E (1976) Potassium, neuroglia, and oxidative metabolism in central gray matter. Fed Proc 35:1266–1271PubMed
28.
LaManna JC, Sylvia AL, Martel D, Rosenthal M (1976) Fluorometric monitoring of the effects of adrenergic agents on oxidative metabolism in intact cerebral cortex. Neuropharmacology 15:17–24PubMed
29.
LaManna JC, Lothman E, Rosenthal M, Somjen G, Younts W (1977) Phenytoin, electric, ionic and metabolic responses in cortex and spinal cord. Epilepsia 18(3):317–329PubMed
30.
LaManna JC, Younts BW Jr, Rosenthal M (1977) The cerebral oxidative metabolic response to acute ethanol administration in rats and cats. Neuropharmacology 16:283–288PubMed
31.
O’Connor MJ, Welsh F, Komarnicky L, Davis L, Stevens J, Lewis D, Herman C (1977) Origin of labile NADH tissue fluorescence. In: Colloquium on oxygen and physiological function. Professional Information Library, Dallas, pp 90–99.
32.
Rosenthal M, Martel DL (1979) Ischemia-induced alterations in oxidative “recovery” metabolism after spreading cortical depression in situ. Exp Neurol 63:367–378PubMed
33.
Hempel FG, Jobsis FF (1979) Comparison of cerebral NADH and cytochrome aa3 redox shifts during anoxia or hemorrhagic hypotension. Life Sci 25:1145–1152PubMed
34.
Hempel FG, Kariman K, Saltzman HA (1980) Redox transitions in mitochondria of cat cerebral cortex with seizures and hemorrhagic hypotension. Am J Physiol 238:H249–H256PubMed
35.
Novack RL, LaManna JC, Rosenthal M (1982) Ethanol and acetaldehyde alter brain mitochondrial redox responses to direct cortical stimulation in vivo. Neuropharmacology 21:1051–1058PubMed
36.
Bryan RM Jr, Jobsis FF (1983) The cerebral redox state in cats during severe insulin induced hypoglycemia. Brain Res 279:266–270PubMed
37.
Bryan RM Jr, Jobsis FF (1986) Insufficient supply of reducing equivalents to the respiratory chain in cerebral cortex during severe insulin-induced hypoglycemia in cats. J Cereb Blood Flow Metab 6:286–291PubMed
38.
O’Connor MJ, Herman CJ, Rosenthal M, Jobsis F (1972) Intracellular redox changes preceding onset of epileptiform activity in intact cat hippocampus. J Neurophysiol 35:471–483PubMed
39.
O’Connor MJ, Lewis DV, Herman CJ (1973) Effects of potassium on oxidative metabolism and seizures. Electroencephalogr Clin Neurophysiol 35:205–208PubMed
40.
Lewis DV, O’Connor MJ, Schuette WH (1974) Oxidative metabolism during recurrent seizures in the penicillin treated hippocampus. Electroencephalogr Clin Neurophysiol 36:347–356PubMed
41.
Lewis DV, Schuette WH (1975) NADH fluorescence and [K+]o changes during hippocampal electrical stimulation. J Neurophysiol 38(2):405–417PubMed
42.
Lewis DV, Schuette WH (1976) NADH fluorescence [K+]0 and oxygen consumption in cat cerebral cortex during direct cortical stimulation. Brain Res 110:523–535PubMed
43.
Vern B, Whitehouse WC, Schuette WH (1975) Sodium fluorescein: a new reference for NADH fluorometry. Brain Res 98:405–409PubMed
44.
Vern B, Schuette WH, Whitehouse WC, Mutsuga N (1976) Cortical oxygen consumption and NADH fluorescence during metrazol seizures in normotensive and hypotensive cats. Exp Neurol 52:82–99
45.
Vern BA, Schuette WH, Mutsuga N, Whitehouse WC (1979) Effects of ischemia on the removal of extracellular potassium in cat cortex during pentylenetetrazol seizures. Epilepsia 20(6):711–724PubMed
46.
Vern BA, Schuette WH, Whitehouse WC (1981) Effects of brain stem stimulation on cortical NADH fluorescence, blood flow, and O2 consumption in the cat. Exp Neurol 71:581–600PubMed
47.
Dora E, Kovach AGB (1978) Factors influencing the correction factor used to eliminate the apparent NADH fluorescence changes caused by alterations in cerebrocortical blood content. Adv Exp Med Biol 92:113–118
48.
Kovach AGB, Eke A, Dora E, Gyulai L (1976) Correlation between the redox state, electrical activity and blood flow in cat brain cortex during hemorrhagic shock. Adv Exp Med Biol 75:289–297PubMed
49.
Kovach AGB, Dora E, Gyulai L (1977) Effects of microcirculation on microfluorometric measurements. In: Jobsis FF (ed) Oxygen and physiological function. Professional Information Library, Dallas, pp 111–123
50.
Kovach AGB, Dora E, Gyulai L, Eke A (1977) Cerebrovascular and metabolic reactions at the CBF autoregulatory level evoked by electrical stimulation of the cat brain cortex. In: Cerebral blood flow and brain function. Basel, Karger, pp 371–374
51.
Kovach AGB, Dora E, Hamar J, Eke A, Szabo L (1978) Transient metabolic and vascular volume changes following rapid blood pressure alterations which precede the autoregulatory vasodilation of cerebrocortical vessels. Adv Exp Med Biol 92:705–711
52.
Kovach AGB, Dora E (1979) Intracellular oxygen tension and energy metabolism in the cat brain cortex during haemorrhagic shock. Acta Physiol Acad Sci Hung 54(4):333–346PubMed
53.
Kovach AGB, Dora E (1981) Redox state and vascular volume changes in the cat brain cortex during CBF autoregulation. In: Kovach AGB, Dora E, Kessler M, Silver IA (eds) Advances in physiological sciences, vol 25. Pergamon, Budapest, pp 145–154
54.
Kovach AGB, Dora E, Szedlacsek S, Koller A (1983) Effect of the organic calcium antagonist D-600 on cerebrocortical vascular and redox responses evoked by adenosine, anoxia and epilepsy. J Cereb Blood Flow Metab 3:51–61PubMed
55.
Kovach AGB, Dora E (1984) Contribution of adenosine to the regulation of cerebral blood flow: the role of calcium ions in the adenosine-induced cerebrocortical vasodilatation. Adv Exp Med Biol 169:315–325PubMed
56.
Gyulai L, Kovach AGB (1982) Cerebrocortical microvessel reactions during hypercapnia and direct electrical activation of cat brain cortex. Am J Physiol 254:C699–C708
57.
Gyulai L, Dora E, Kovach AGB (1982) NAD/NADH: redox state changes on cat brain cortex during stimulation and hypercapnia. Am J Physiol 243(4):H619–H627PubMed


