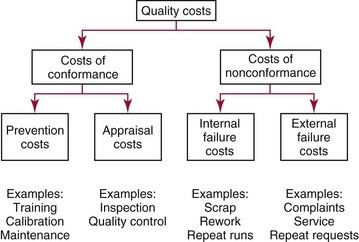
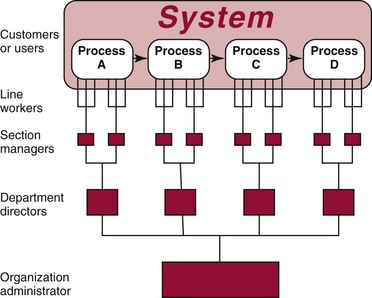
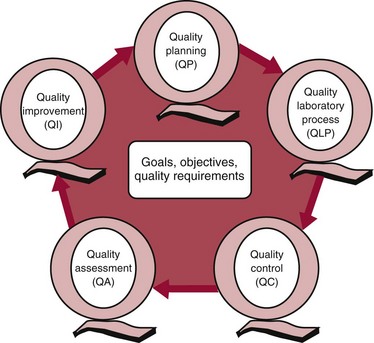
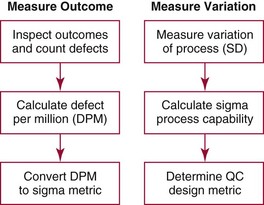
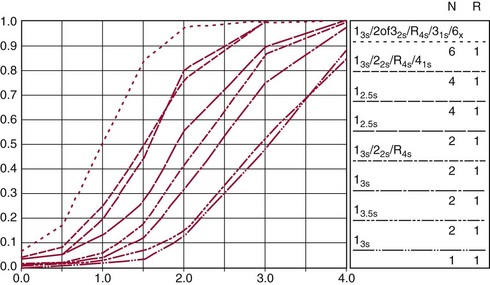
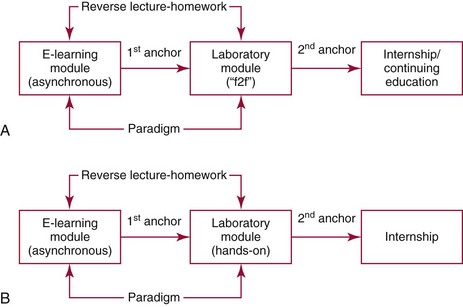
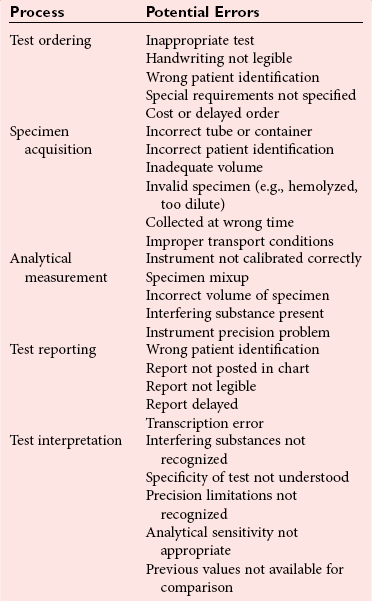
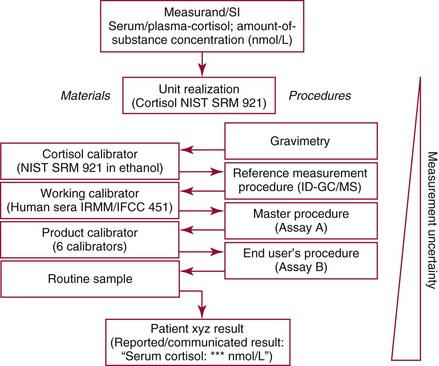
Chapter 8 Public and private pressures to contain healthcare costs are accompanied by pressures to improve quality. Seemingly contradictory pressures for both cost reduction and quality improvement (QI) require that healthcare organizations adopt new systems for managing quality. When faced with these same pressures, other industries implemented total quality management, or TQM.116 TQM may also be referred to as (1) total quality control (QC), (2) total quality leadership, (3) continuous quality improvement, (4) quality management science, or, more generally, (5) industrial quality management. TQM provides both a management philosophy for organizational development and a management process for improving the quality of all aspects of work. Many healthcare organizations have adopted the concepts and principles of TQM.12,101 Cost must be understood in the context of quality. If quality means conformance with requirements, then quality costs must be understood in terms of “costs of conformance” and “costs of nonconformance,” as illustrated in Figure 8-1. In industrial terms, costs of conformance are divided into prevention costs and appraisal costs. Costs of nonconformance consist of internal and external failure costs. For a laboratory testing process, calibration is a good example of a cost incurred to prevent problems. Likewise, quality control is a cost for appraising performance, a repeat run is an internal failure cost for poor analytical performance, and repeat requests for tests because of poor analytical quality are an external failure cost. This understanding of quality and cost leads to a new perspective on the relationship between them. Improvements in quality can lead to reductions in cost. For example, with better analytical quality, a laboratory would be able to reduce waste; this, in turn, would reduce cost. The father of this fundamental concept was the late W. Edwards Deming, who developed and internationally promulgated the idea that quality improvement reduces waste and leads to improved productivity, which, in turn, reduces costs and provides a competitive advantage.42 As a result, the organization stays in business and is able to continue providing jobs for its employees. This emphasis on processes leads to a new view of the organization as a system of processes (Figure 8-2). For example, physicians might view a healthcare organization as a provider of processes for patient examination (A), patient testing (B), patient diagnosis (C), and patient treatment (D). Healthcare administrators might view the activities in terms of processes for admitting patients (A), tracking patient services (B), discharging patients (C), and billing for costs of service (D). Laboratory directors might understand their responsibilities in terms of processes for acquisition of specimens (A), processing of specimens (B), analysis of samples (C), and reporting of test results (D). Laboratory analysts might view their work as processes for acquiring samples (A), analyzing samples (B), performing quality control (C), and releasing patient test results (D). The total system for a healthcare organization involves the interaction of all of these processes and many others. Given the primary importance of these processes for accomplishing the work of the organization, TQM views the organization as a support structure rather than as a command structure. As a support structure, the most immediate processes required for delivery of services are those of frontline employees. The role of upper management is to support the frontline employees and to empower them to identify and solve problems in their own work processes. The importance of empowerment is easily understood if a problem involves processes from two different departments. For example, if a problem occurs that involves the link between process A and process B in Figure 8-2, the traditional management structure requires that the problem be passed up from the line workers to a section manager or supervisor, a department director, and an organization administrator. The administrator then works back through an equal number of intermediaries in the other department. Direct involvement of line workers and their managers should provide more immediate resolution of the problem. However, such problem solving requires a carefully structured process to ensure that root causes are identified and proposed solutions verified. Juran’s “project-by-project” quality improvement process53 provides detailed guidelines that have been widely adopted and integrated into current team problem-solving methods.11,12,97 These methods outline distinct steps for (1) carefully defining the problem, (2) establishing baseline measures of process performance, (3) identifying root causes of the problem, (4) identifying a remedy for the problem, (5) verifying that the remedy actually works, (6) “standardizing” or generalizing the solution for routine implementation of an improved process, and (7) establishing ongoing measures for monitoring and controlling the process. The quality improvement project team provides a new flexible organization unit. A project team is a group of employees appointed by management to solve a specific problem that has been identified by management or staff. The team comprises members from any department and from any level of the organization and includes anyone whose presence is necessary to understand the problem and identify the solution. Management initiates the project, and the team is empowered and supported to identify the root cause and verify a solution; management then becomes involved in replanning the process (i.e., planning the implementation of changes in a laboratory process, defining and standardizing the improved process, and establishing appropriate measures for ongoing evaluation and control of the process).129 The principles and concepts of TQM have been formalized into a quality management process (Figure 8-3). The traditional framework for managing quality in a healthcare laboratory has emphasized the establishment of quality laboratory processes (QLPs), QC, and quality assessment (QA). A QLP includes analytical processes and the general policies, practices, and procedures that define how work is done. QC emphasizes statistical control procedures but also includes nonstatistical check procedures, such as linearity checks, reagent and standard checks, and temperature monitors. QA, as currently applied, is primarily concerned with broader measures and monitors of laboratory performance, such as (1) turnaround time, (2) specimen identification, (3) patient identification, and (4) test utility. Quality “assessment” is the proper name for these activities rather than quality “assurance.” Measuring performance does not by itself improve performance and often does not detect problems in time to prevent negative outcomes. Quality assurance requires that causes of problems be identified through QI and eliminated through quality planning (QP), or that QC be able to detect problems early enough to prevent their consequences. To provide a fully developed system and framework for managing quality, the QI and QP components must be established.37,80,127 QI provides a structured problem-solving process for identifying the root cause of a problem and for identifying a remedy for the problem. QP is necessary to (1) standardize the remedy, (2) establish measures for monitoring performance, (3) ensure that the performance achieved satisfies quality requirements, and (4) document the new QLP. The new process is then implemented through QLP, measured and monitored through QC and QA, improved through QI, and replanned through QP. These five components, working together in a feedback loop, illustrate how continuous QI is accomplished and how quality assurance is built into laboratory processes. The establishment of medically relevant analytical performance limits is not an easy task. Each assay and each clinical application of each assay logically should have its own optimal and its own acceptable performance limits. Systematic and random errors generally affect applications differently; therefore independent assessment of the quality goals for these two types of errors may be most practical. Systematic errors have the most profound effect on medical diagnostic decisions, especially those involving specific diagnostic limits. Medical guidelines may specify numeric decision limits such as 200 mg/dL of cholesterol in the National Cholesterol Education Program (NCEP) guideline.4,8 Analytical tolerance limits for systematic errors may be very tight near the decision limit and less stringent for measurements farther from the decision values. Performance limits for random errors can be bounded by biological variations as follows. If analytical imprecision is less than 25% of the biological variation [measured as standard deviation (SD) or coefficient of variation (CV)], then the total combined analytical and biological SD or CV will be increased by less than 3% compared with the biological variation [e.g., Two types of system analysis are used to determine what analytical performance is achieved with a particular laboratory system. The first is called a bottom-up analysis, and the second is a top-down analysis.6,7 In the bottom-up analysis, the system is divided into multiple components. The uncertainties of all components are defined and statistically combined to obtain the total uncertainty of the complete system. The systematic errors add linearly, whereas the random errors add by the square root of the sum of squares. Total systematic error (SE) and total random error (if independent) are defined as follows: (Note: If the component errors are not statistically independent, covariances must be accounted for when adding the random errors.) The balance of this chapter focuses primarily on analytical quality and the procedures by which it is monitored. Goals for analytical quality are established in the same way that they are established for purposes of method evaluation (see Chapter 2). The philosophy is to define an “allowable analytical error” based on “medical usefulness” requirements. A “total error” specification is useful because it will permit calculation of the sizes of random and systematic errors that have to be detected to maintain performance within the allowable error limit (see Chapter 2).85 Medical decision concentrations (i.e., the concentrations at which medical interpretation of laboratory test results is particularly critical) are important in establishing the analytical concentrations at which analytical performance has to be most carefully monitored. Thus analytical goals are established by specifying the allowable analytical error and the critical medical decision concentration. Method evaluation is only the first step in validating that analytical performance satisfies those goals. Quality control procedures should provide for continuing verification that those goals are being achieved during routine service. A study by the Institute of Medicine found that more than 1 million preventable injuries and 44,000 to 98,000 preventable deaths occur annually in the United States.60,64 Additional publications have offered suggestions for minimizing medical errors in general.13,40,64–66,94 The magnitude of laboratory errors and the use of the Six Sigma process in controlling them are discussed in the following sections. A study of 363 incidents captured by a laboratory’s quality assurance program in a hospital enumerated the sources and impact of errors.92 Incidents included those in which (1) physicians’ orders for laboratory tests were missed or incorrectly interpreted; (2) patients were not properly prepared for testing or were incorrectly identified; (3) specimens were collected in the wrong containers or were mislabeled or mishandled; (4) the analysis was incorrect; (5) data were entered improperly; or (6) results were delayed, not available, or incomplete, or they conflicted with clinical expectations. Upon evaluating the data, the authors found no effect on patient care for 233 patients; 78 patients were not harmed but were subjected to an unnecessary procedure not associated with increased patient risk; and 25 patients were not harmed but were subjected to an additional risk of inappropriate care. Of the total number, preanalytical mistakes accounted for 218 (45.5%), analytical for 35 (7.3%), and postanalytical for 226 (47.2%). Nonlaboratory personnel were responsible for 28.6% of the mistakes. An average of 37.5 patients per 100,000 treated were placed at increased risk because of mistakes in the testing process. Witte and colleagues investigated rates of error within the analytical component and found that widely discrepant values were rare, occurring in only 98 of 219,353 analyses.145 When these results were converted into a standard metric of errors per million episodes, an error rate of 447 ppm was calculated.13 In another study, Plebani and Carraro identified 189 mistakes from a total of 40,490 analyses, with a relative frequency of 0.47% (4667 ppm). The distribution of mistakes was 68.2% preanalytical (3183 ppm), 13.3% analytical (620 ppm), and 18.5% postanalytical (863 ppm).86 Most laboratory mistakes did not affect patients’ outcomes, but in 37 patients, laboratory mistakes were associated with additional inappropriate investigations, thus resulting in an unjustifiable increase in costs. In addition, laboratory mistakes were associated with inappropriate care or inappropriate modification of therapy in 12 patients. The authors concluded that “promotion of quality control and continuous improvement of the total testing process, including pre-analytical and post-analytical phases, seems to be a prerequisite for an effective laboratory service.”86 In a study of common immunoassays, Ismail and colleagues found only 28 false results from 5310 patients (5273 ppm).51 However, as a result of incorrect immunoassay results attributable to interference, 1 patient had 15 consultations, 77 laboratory tests, and an unnecessary pituitary computed tomography scan. The authors stress (1) the necessity for good communication between clinician and laboratory personnel, (2) the importance of the clinical context, and (3) the necessity for use of multiple methods of identifying erroneous test results—a necessity for a rigorous and robust quality system. Heterophilic antibody blocking studies were most effective in identifying interference, but in 21% of patients with false results, dilution studies or alternative assays were necessary to identify the problem. In a similar study, Marks enlisted participation from 74 laboratories from a broad international spectrum of settings and found that 6% of analyses gave false-positive results and, as in the Ismail study, found that use of a heterophilic blocking reagent corrected approximately one third of these.72 Further evaluation of the data showed no consistent pattern for false results: errors were distributed across donors, laboratories, and systems of analysis. In reviewing the data from these last two studies, Leape suggested setting up a system that would ensure that every result was given a rigorous review before being reported.64 Bonini et al conducted several MEDLINE studies of laboratory medical errors and found large heterogeneity in study design and quality and lack of a shared definition of laboratory error.17 However, even with these limitations, they concluded that most such errors occur in the preanalytical phase and suggested that these could be reduced by the implementation of a more rigorous method for error detection and classification and the adoption of proper technologies for error reduction. Thus current QA programs that monitor only the analytical phase of the total process have to be expanded to include both preanalytical (see Chapter 6) and postanalytical phases (www.westgard.com/essay34/assessed March 22, 2011). Through expanded monitoring, the total process would then be managed so as to reduce or eliminate all defects within the process.86 Six Sigma,41A,46A,48 is an evolution in quality management that is being widely implemented in business and industry in the new millennium.89 Six Sigma metrics are being adopted as the universal measure of quality to be applied to their processes and the processes of their suppliers. The principles of Six Sigma go back to Motorola’s approach to TQM in the early 1990s and the performance goal that “6 sigma’s or 6 standard deviations of process variation should fit within the tolerance limits for the process,” hence, the name Six Sigma (http://mu.motorola.com/accessed March 22, 2011). For this development, Motorola won the Malcolm Baldridge Quality Award in 1988. Six Sigma provides a more quantitative framework for evaluating process performance and more objective evidence for process improvement. The goal for process performance is illustrated in Figure 8-4, which shows the tolerance specifications or quality requirements for that measurement set at −6S and +6S. Any process can be evaluated in terms of a sigma metric that describes how many sigma’s fit within the tolerance limits. The power of the sigma metric comes from its role as a universal measure of process performance that facilitates benchmarking across industries. Figure 8-4 Six Sigma goal for process performance “tolerance specification” represents the quality requirement. Two methods can be used to assess process performance in terms of a sigma metric (Figure 8-5). One approach is to measure outcomes by inspection. The other approach is to measure variation and predict process performance. For processes in which poor outcomes can be counted as errors or defects, the defects are expressed as defects per million (DPM), then are converted to a sigma metric using a standard table available in any Six Sigma text.48 This conversion from defects per million to sigma levels is an enumeration of the area under the error curve plus or minus the tolerance limits (±2 S = 308,500 DPM; ±3 S = 66,800 DPM; ±4 S = 4350 DPM; ±5 S = 230 DPM; ±6 S = 3.4 DPM). In practice, Six Sigma provides a general method by which to describe process outcomes on the sigma scale. To illustrate this assessment, consider the rates of malfunction for cardiac pacemakers. Analysis of approved annual reports submitted by manufacturers to the Food and Drug Administration (FDA) between 1990 and 2002 revealed that 2.25 million pacemakers were implanted in the United States. Overall, 17,323 devices were explanted because of confirmed malfunction.70 The defect rate then is estimated at 7699 DPM (17,323/2,250,000), or 0.77%, which corresponds to a sigma of 3.92 using a DPM-to-sigma conversion calculator (http:www.isixsigma.com/sixsigma/six_sigma_calculator.asp?m=basic/accessed March 22, 2011). For comparison or benchmarking purposes, airline baggage handling has been described as 4.15 sigma performance, and airline safety (0.43 deaths per million passenger miles) as better than Six Sigma performance. A defect rate of 0.033% would be considered excellent in any healthcare organization, where error rates from 1 to 5% are often considered acceptable.13 A 5.0% error rate corresponds to a 3.15 sigma performance, and a 1.0% error rate corresponds to 3.85 sigma. Six Sigma shows that the goal should be error rates of 0.1% (4.6 sigma) to 0.01% (5.2 sigma) and ultimately 0.001% (5.8 sigma). The first application describing sigma metrics in a healthcare laboratory was published by Nevalainen et al79 in the year 2000. This application focused on preanalytical and postanalytical processes. Order accuracy, for example, was observed to have an error rate of 1.8%, or 18,000 DPM, which corresponds to 3.6 sigma performance. Hematology specimen acceptability showed a 0.38% error rate, or 3800 DPM, which is a 4.15 sigma performance. The best performance observed was for the error rate in laboratory reports, which was only 0.0477%, or 477 DPM, or 4.80 sigma performance. The worst performance was therapeutic drug monitoring timing errors of 24.4%, or 244,000 DPM, which is 2.20 sigma performance. Of the studies discussed in the previous section, it is possible to convert the error rates computed in DPM to sigma metrics. For example, for the Ross-Boone study,92 the computed DPM corresponds to a 3.3 sigma long-term performance. For the Plebani et al study86 a DPM of 620 DPM corresponds to a 3.2 sigma long-term performance. In the Ismail et al study,51 a DPM of 5273 corresponds to a 2.6 sigma long-term performance. On average, this indicates about 3.0 sigma long-term performance. The application of sigma metrics for assessing analytical performance depends on measuring process variation and determining process capability in sigma units.95,110,126 This approach makes use of the information on precision and accuracy that laboratories acquire initially during method validation studies and have available on a continuing basis from internal and external quality control. An important aspect of this method is that the capability, or predictive performance, of the process must be ensured by proper quality control; therefore the ease of assessment comes with the responsibility to design and implement QC procedures that will detect medically important errors. Those conclusions can be readily understood by considering the amount of quality control that is necessary for measurement processes having different performance metrics. Figure 8-6 shows a power function graph that describes the probability of rejecting an analytical run on the y-axis versus the size of the systematic error that has to be detected on the x-axis. The bold vertical lines correspond to methods having 3, 4, and 5 sigma performance (left to right). The different lines or power curves correspond to the control rules and the number of control measurements given in the key at the right (top to bottom). These different QC procedures have different sensitivities or capabilities for detecting analytical errors. Practical goals are to achieve a probability of error detection of 0.90 (i.e., a 90% chance of detecting the critically sized systematic error), while keeping the probability of false rejection at 0.05 or less (i.e., 5% or lower chance of false alarms). This is easy to accomplish for processes with 5 to 6 sigma performance; it requires more careful selection and increased QC efforts for processes from 4 to 5 sigma, and it becomes very difficult and expensive for processes less than 4 sigma. As demonstrated previously, the application of Six Sigma principles and metrics is very valuable for all phases of the laboratory testing process.41A,46B Because the core business of the laboratory is to produce accurate test results, it makes sense to first apply Six Sigma to the analytical processes. This also is the easiest application because there are tolerance limits in the form of acceptability criteria from peer-comparison and proficiency-testing programs, QC data available for estimating method precision, and peer data available for estimating method bias. Laboratories should next expand their efforts to the preanalytical and postanalytical processes, knowing that their core processes are producing the necessary analytical quality. Changes in analytical bias directly shift the distribution of patient test values. If the elevated values on a test are associated with specific clinical actions, then the shifts in analytical bias can notably alter the number of patients having test values that exceed the action limit.56 For example, for a serum calcium assay with an action limit of 10.1 mg/dL, an upward bias of 0.2 mg/dL changes the number of patients subjected to further investigation from 6.5 to 15.0%. Similarly, analytical shifts in other critical analytes can cause notable clinical problems, such as false elevations of prostate-specific antigen values, triggering prostate ultrasound examinations and biopsies, and false elevation of thyroid-stimulating hormone (TSH), triggering additional thyroid examinations. These small analytical shifts can have major downstream effects on healthcare costs. Lean production is a quality process that is focused on creating more value by eliminating activities that are considered waste. For example, any inefficient activity or process that consumes resources or adds cost or time without creating value is revised or eliminated. In practice, it focuses on system level improvements (as opposed to point improvements). Because of its success in enhancing efficiency environments,10 the lean approach has proven useful wherever a defined set of activities is working to produce a product or service. For example, a “lean team” at Saint Mary’s Hospital, a Mayo Clinic hospital in Rochester, Minnesota, used lean production to improve the efficiency of its paper ordering system for laboratory work in its intensive care unit.69 Because the goal of lean production is to enhance efficiency and the Six Sigma Process to improve quality, they have been combined and integrated into the management of several organizations, including healthcare facilities84,115,144 and clinical99,106 and molecular diagnostic28 laboratories.46 CLIA identifies the following six elements as required components of a laboratory competency assessment program: (1) direct observation of routine patient test performance; (2) monitoring of the recording and reporting of test results; (3) review of intermediate test results, QC records, proficiency testing results, and preventive maintenance records; (4) direct observation and performance of instrument maintenance and function checks; (5) assessment of test performance through testing previously analyzed specimens, internal blind testing samples, or external proficiency testing samples; and (6) assessment of problem-solving skills.87 Assessment of competence in job tasks as required by CLIA must be conducted semiannually the first year of employment and annually thereafter, and upon implementation of new test methods before patient test results are reported. Guidelines to assist in the development and documentation of competency assessment are available from the Clinical and Laboratory Standards Institute (CLSI). The CLSI Guideline, Training and Competence Assessment, gives detailed instructions on how to develop and implement a training and competency assessment program that meets regulatory requirements, and provides examples of forms for documentation and record keeping.38 Design of an in-service training program based on instructional systems design includes the following elements: (1) analysis, (2) design, (3) implementation, and (4) evaluation. It begins with a needs assessment or gap analysis to determine employee performance requirements, to identify deficiencies, and to evaluate existing education and training resources. It requires the development of measurable instructional objectives that are based on the specific skills and competencies required of the employee to perform the job or task, and selection of an appropriate teaching strategy. The in-service training program also considers how an instructional program will be delivered and a range of organizational factors that may impact the successful delivery of the instruction. These include (1) employee participation, (2) scheduling, (3) availability of subject matter experts to teach, (4) budget constraints, and (5) assessment of learning outcomes. It provides evaluation of the effectiveness of the instructional program.39 Implementation of this in-house training program in basic quality control by the Mayo Clinic followed the educational model designed for the Clinical Laboratory Science Program. The didactic component is provided in an e-learning platform and is underscored by transactional distance theory,76 whereby the three modalities of learner interaction with content, instructor, and fellow learners were integrated into the online module. Each lesson plan also includes a supplemental laboratory module taught by traditional methods of interaction between instructor and learner, which is closely anchored in the context of the work performed. Finally, the curricular model implements the reverse lecture-homework paradigm, whereby learners complete the Web-supported didactic modules asynchronously as “homework” assignments (Figure 8-7, A) and complete the laboratory lessons in the classroom (work setting) under the guidance and direction of the instructor/supervisor (Figure 8-7, B). The in-service training program in quality control concepts follows the CLSI academic curricular model and applies the reverse lecture-homework paradigm (see Figure 8-7). To implement the program, employees complete 14 online lessons asynchronously, as “homework,” and participate in 6 scheduled laboratory sessions taught in the traditional format, over a period of 3 weeks. The electronic curriculum includes employee interaction with the written quality control course content (“learner-content”), threaded discussions (“learner-learner”), and email (“learner-instructor”). The online material is applied directly during “hands-on” instructor-facilitated laboratory sessions that are problem-based and consist of a combination of case studies, laboratory activities, and discussions. Technical procedures necessary for laboratory services include the following: 1. Control of preanalytical conditions or variables, such as test requests, patient preparation, patient identification, specimen acquisition, specimen transport, specimen processing, specimen distribution, preparation of work lists and logs, and maintenance of records (see Chapters 6 and 9).149 2. Control of analytical variables, which include analytical methods, standardization and calibration procedures, documentation of analytical protocols and procedures, and monitoring of critical equipment and materials. 3. Monitoring of analytical quality through the use of statistical methods and control charts. Although it is a particularly critical element in a quality assurance program, the necessity for a mechanism for problem solving is often underemphasized. Such a mechanism provides the link between identification of a problem and implementation of a solution to the problem. It is a feedback loop that responds to an error signal by making adjustments to reduce the size of the error or to prevent its recurrence. For problems limited to individual methods or instrument systems, delegation of responsibility for the systems may provide the corrective mechanism. Specialized troubleshooting skills need to be developed and improved and preventive maintenance programs instituted. For problems that occur more generally, the in-service training program can be an important part of the mechanism but often requires additional input from a QC specialist or supervisor to initiate the use of this mechanism and to help define its objectives. A different approach to problem solving is the use of quality teams that meet regularly to analyze problems and identify solutions.97 By involving personnel, quality teams heighten interest and commitment to quality and provide a creative feedback mechanism. The comprehensive nature of quality assurance programs and their missions, goals, and activities have been discussed in greater detail by Eilers.44 Detailed outlines of the elements of cost management for quality assurance are available,45,54 as are detailed recommendations by professional organizations, such as the College of American Pathologists (CAP),1 the CLSI,33,35–37 and the International Federation of Clinical Chemistry,22–27 and books devoted to quality assurance practices in clinical laboratories.29,120 The operation of the clinical laboratory consists of a series of processes, each of which has potential sources of error. Table 8-1 shows the processes that take place from the time of the physician’s initial request for a test to the time of final interpretation of the test result. This systems analysis identifies the critical processes for a typical laboratory; however, each laboratory situation is somewhat different, and additional processes and additional sources of error may be identified. It is important for each laboratory to perform a systems analysis of its own laboratory testing system to identify those areas where errors are likely to occur. Once the processes have been documented, those that are most susceptible to error should be identified and should receive the most attention. Often, processes that lead to the greatest number of complaints, such as lost specimens or delayed results, are judged to be most important, even though other steps, such as appropriateness of test selection and the acceptability of a specimen, may be of greater importance for optimal medical care. Guidelines describing procedures for specimen handling are available from organizations such as the CLSI. Documents put forth by accrediting agencies, such as CAP,1 Centers for Disease Control and Prevention, and state regulatory agencies, are also helpful in this regard. It is difficult to establish effective methods for monitoring and controlling preanalytical variables because many of these variables are outside of traditional laboratory areas (see Chapter 6). Monitoring of preanalytical variables requires the coordinated effort of many individuals and hospital departments, each of which must recognize the importance of these efforts in maintaining a high quality of service. Accomplishing such monitoring may require support from outside the laboratory, particularly from the institution’s clinical practice committee or some similar authority. Variables to consider are discussed in the following section. Traditionally, laboratory test utilization has been monitored or controlled to some degree, but current emphasis on the cost of medical care and government regulation of medical care has increased their importance. For example, clinical practice committees may decide that only certain tests are necessary for emergency care and therefore limit their availability. Peer review audits may lead to the development of other guidelines concerning the appropriate use of diagnostic tests in different clinical situations. Numerous patient care strategies and guidelines are being developed that directly impact laboratory usage.55 For example, implementation guidelines for the use of bleeding times at the University of Massachusetts Medical Center resulted in a substantial reduction in test requests.78 Careful monitoring of test requests and their appropriateness is likely to increase in importance, and the laboratory will likely have a role in identifying situations in which test utilization can be optimized and in providing in-service education to effect changes in ordering patterns. Correct identification of patients and specimens is a major concern for laboratories. The highest frequency of error occurs with the use of handwritten labels and request forms. One method for checking identification is to compare identifiers such as the patient’s name and his or her unique hospital number. The identification on the specimen label should also correspond with the identification supplied with the test requisition. The use of plastic embossed patient identification cards to imprint the patient’s name on test request forms and on blood collection labels can eliminate transcription and identification errors but does not guarantee that the patient name on the labels correctly identifies the donor of the specimen. Integration of bar code technology into the analytical systems used by clinical laboratories has significantly reduced within laboratory specimen identification problems (see Chapter 19). Delayed and lost test requisitions, specimens, and reports have been major problems for laboratories. An essential feature in monitoring the cause of delays is the recording of actual times of specimen collection, receipt in the laboratory, and reporting of test results. This has been done manually by placing time stamps in key locations such as blood-drawing centers, specimen-processing stations, result-reporting areas, and wards or chart-posting areas. It also has been done more effectively by programming computer systems to automatically document the times of test requests, specimen acquisition, processing, analysis, and reporting.91 Turnaround time has been monitored like any other QC variable, and limits established to flag “out-of-range” specimens. Lists of delayed specimens also provide a powerful mechanism for detecting lost specimens or reports. Resolution of problems in this area is aided by a systems analysis of laboratory operations, which helps to identify those steps and areas that cause delays and disruptions in service. A good system for monitoring patient, specimen, and information flow may be obtained through integration of the light wand and/or bar code or optical character identification system with a computer that could automatically track each specimen at each of the steps from test request to result posting. Laboratory tests are affected by many factors such as recent intake of food, alcohol, or drugs, and by smoking, exercise, stress, sleep, posture during specimen collection, and other variables (see Chapter 6). Proper patient preparation is essential for test results to be meaningful. Although responsibility for this usually resides with personnel outside the laboratory, the laboratory must define the instructions and procedures for patient preparation and specimen acquisition. These procedures should be included in hospital procedure manuals and should be transmitted to patients in both oral and written instructions. Compliance with these instructions is monitored directly when the laboratory employs its own phlebotomists. Specific inquiry should be made regarding patient preparation before specimens are collected, and efforts should be made to correct noncompliance. For tests in which standardization of the collection is very important (such as for plasma catecholamines), specimens should be collected in a controlled environment with appropriate supervision. The techniques used to acquire a specimen affect many laboratory tests (see Chapter 7).104 For example, prolonged tourniquet application causes local anoxia to cells and excessive venous back pressure. The anoxia causes small solutes (such as potassium) to leak from cells, and the venous pressure concentrates cells, proteins, and substances bound to proteins (such as calcium). Blood collected from an arm into which an intravenous infusion is running can be diluted or contaminated. Collection of blood through an indwelling catheter should be avoided because it is a major source of contamination. Hemolysis during and after collection alters the concentration of any analyte that has a red blood cell/plasma concentration differential. Improper containers and incorrect preservatives greatly affect test results and make them inappropriate. One way to monitor and control this aspect of laboratory processing is to have a specially trained laboratory team assigned to specimen collection. All members of the team should be given explicit instruction in the proper methods of specimen collection. The identification of the person collecting a specimen should be maintained. Individuals who process the specimens should be trained to look for and document collection problems. Physicians should be encouraged to report clinically inconsistent results. Similarly, errors detected by limit checks, delta checks (differences between consecutive results on individual patients), or other algorithms should be recorded. Any collection problems should be reviewed with the individuals collecting the specimens. Pride of workmanship should be encouraged, and quality performance should be rewarded. The stability of specimens during transport from the patient to the laboratory is seldom monitored; however, this aspect may be critical for some tests when performed locally and for most tests when sent to regional centers and commercial laboratories.33 Most laboratories have recommendations for specimen storage and transport, but many of these are empirical and lack adequate scientific documentation. Even the definition of stability is not well agreed upon; some investigators accept changes less than 10%,61,143 and others relate stability to medically significant changes93 or a percentage of established analytical variability.112 Centrifuges are discussed in Chapter 9. For QC purposes, centrifuges should be monitored by checking the speed, timer, and temperature. Evaporation can substantially alter test results; therefore all containers should be sealed or the surface area of the liquids contained in them protected. Collection tubes, pipettes, stoppers, and aliquot tubes are sources of calcium and trace metal contamination. Also, glass beads and other materials added to blood specimens to aid in the separation of serum from cells may cause contamination. Manufacturers should provide reassurance that materials used are tested for contamination by calcium and possibly other elements. Cork stoppers should not be used on specimens intended for calcium determinations because false elevations of 10 to 50% may occur. Some of the plasticizers used in making plastic containers interfere with drug analyses. Also, some plastic materials adsorb trace amounts of some analytes and should not be used for substances in low concentration, such as parathyroid hormone.52 Also, the effects of evaporation are important matters of concern during processing, storage, and analysis. Because of the intricate relationship between specimen processing and analytical testing, supplies and processing procedures should not be changed without consulting the personnel responsible for analytical testing (see also Chapter 7). An elegant system for monitoring manual clerical functions was developed to detect errors in blood banking records.109 In this system, known errors are discretely introduced into the system using fictitious patients. The types of errors introduced are chosen to represent errors likely to occur or errors that cause major problems. The fictitious reports are routed to dummy locations and eventually are returned to the QC technologist. One can calculate the efficiency of the laboratory error detection program by comparing the number of fictitious errors discovered versus the number introduced. This efficiency factor is then used to estimate the actual laboratory error rate based on the number of true errors discovered in the laboratory. Implementation of this scheme requires the cooperation of laboratory personnel and the involvement of a QC specialist. Through a combination of paranoia and pride of workmanship, most personnel are more conscientious when they know they are being monitored. A substantial increase in the rate of error detection was observed shortly after this plan was implemented in the blood bank. Public display of individual error rates encourages pride in workmanship. Reliable analytical methods are obtained by a careful process of selection, evaluation, implementation, maintenance, and control (see Chapter 2). Certain variables—water quality, calibration of analytical balances, calibration of volumetric glassware and pipettes, stability of electrical power, and the temperature of heating baths, refrigerators, freezers, and centrifuges—should be monitored on a laboratory-wide basis because they will affect many of the methods used in the laboratory (see Chapter 9). In addition, certain variables will relate more directly to individual analytical methods, and these require that procedures be developed to deal specifically with the characteristics of those methods. Selection and evaluation of analytical methods are discussed in Chapter 2. It is important to recognize, however, that the initial evaluation of a method often takes place in a setting somewhat more idealized than the production setting. Therefore, it is desirable to have a startup period in the service laboratory before test results are to be reported. This period allows time to (1) discover any additional problems, (2) develop maintenance programs that alleviate those problems, and (3) train a sufficient number of analysts to support the routine service operation. Reference materials and methods used are major factors in determining the quality and reliability of the analytical values produced by a clinical laboratory. Uriano113 and Tietz111 have defined a hierarchy of analytical methods and reference materials that shows the relationship between them. For example, definitive methods are those of highest quality that are used to validate reference methods and primary reference materials. Primary reference materials are those of the highest quality that are used in the (1) development and validation of reference methods, (2) calibration of definitive and reference methods, and (3) production of secondary reference materials. Reference methods are used to validate field methods. Secondary reference materials are used to provide working calibrators for field methods and to assign values to control materials. Control materials are used only to monitor field methods. Many organizations have developed definitions for terms of analytical relevance to the clinical laboratory. Depending on the organization that developed them and the circumstances and culture under which they were developed, definitions for the same term are often slightly different. As part of its global harmonization effort, the CLSI has developed the Harmonized Terminology Database, which is a compilation of internationally accepted terminology (http://www.clsi.org/Content/NavigationMenu/Resources/HarmonizedTerminologyDatabase/Harmonized_Terminolo.htm/accessed March 22, 2011). To use it, one clicks on the Website and then simply enters the term of interest, and definitions for that term are listed. Standard, internationally preferred terms and definitions are highlighted in blue. Terms and definitions in black are acceptable; but only if the standard internationally preferred terms and definitions are unacceptable for a certain context. Terms highlighted in red are not acceptable in the international standards community. In general, the international standards community uses the definitions listed in the Vocabulary of Basic and General Terms in Metrology (VIM) document produced by the International Organization for Standardization (ISO). Several of these definitions that are of particular interest to clinical laboratorians are listed in Table 8-2. TABLE 8-2 ISO/VIM Definitions of Relevance to the Clinical Laboratory From International vocabulary of basic and general terms in metrology (VIM). Geneva, Switzerland: International Organization for Standardization, 2008. (Note: A Corrigendum or correction of this document was published by the BIPM in 2010.) Considerable effort has been spent in developing a traceable accuracy base for measurands of clinical interest (Figure 8-8).3,9,41,111,114 The driver to develop such a base was the European Directive 98/79/EC, which requires that “the traceability of values assigned to calibrators and/or control materials must be assured through available reference measurement procedures and/or available reference materials of a higher order” (www.ce-mark.com/ivd.pdf/accessed March 22, 2011). It became effective on December 7, 2003.
Quality Management
Fundamentals of Total Quality Management127
Fundamental Concepts
Fundamental Principles
Total Quality Management of the Clinical Laboratory
Establishing Quality Goals and Analytical Performance Limits

 ]. If an assay is used to monitor test changes within an individual over time, the within person biological variation would be the appropriate bonding limit. Values for biological variation were published in a 1999 paper by C. Ricos.90 Updated values are available at the website www.westgard.com (assessed March 22, 2011).122


Laboratory Error and the Six Sigma Process
Number of Errors Made in the Clinical Laboratory
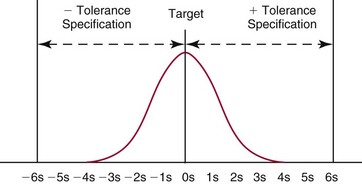
Six Sigma Principles and Metrics
Effect of Analytical Bias on Clinical Decisions
Lean Production
Elements of a Quality Assurance Program
Personnel Competency and Training*
Technical Procedures
Problem-Solving Mechanism
Control of Preanalytical Variables
Types of Preanalytical Variables
Test Usage and Practice Guidelines
Patient Identification
Turnaround Time
Patient Preparation
Specimen Collection
Specimen Transport
Specimen Separation and Aliquoting
Centrifuge Performance
Container Monitoring
Clerical Errors
Control of Analytical Variables
Choice of Analytical Method
Reference Materials and Methods
Definitions of Relevance to Analytical Quality

Analytical Traceability
![]()
Stay updated, free articles. Join our Telegram channel

Full access? Get Clinical Tree


Basicmedical Key
Fastest Basicmedical Insight Engine