Figure 15.1ASTM D 6940-04 Segregation tester (with the top slide gate open and the powder flow from the mass flow hopper down to the funnel flow hopper). Fifty-milliliter glass beakers were used as sample collector. (Reprinted from Journal of Pharmaceutical Sciences, 97(10), Xie L, Wu H, Shen M et al., Quality-by-Design (QbD): Effects of testing parameters and formulation variables on the segregation tendency of pharmaceutical powder measured by the ASTM D 6940-04 Segregation Test, 4485–97, Copyright 2008, with permission from Elsevier.)
 15.1
15.1The binary powder mixture can be classified into two categories: (1) minimal ST if an L/F ratio equal to or close to one is obtained, in which case the powder mixture is stable and more likely to maintain uniformity under free-flowing conditions; (2) strong ST if an L/F ratio deviates from 1 significantly, in which case the tested powder mixture is unstable and the blend is prone to segregate.
Objective, Study Design, and Testing Results
The objective of this study was to examine the effects of testing parameters and formulation variables on the ST of pharmaceutical powders measured by the ASTM D 6940-04 segregation tester using a DOE approach. To ensure our limited resources focused on the most critical areas and factors, a fishbone diagram44,45 was created to highlight the variables that have potential to affect the ST of a binary powder system, as shown in Figure 15.2. Given that many factors can be well controlled in the laboratory setting and thus be held constant could be eliminated for further consideration; on the basis of this preliminary risk analysis result, only certain testing parameters and formulation variables were selected for the DOE study.

Figure 15.2Fishbone diagram illustrating variables that could potentially affect the ST measurement and the ST results.
A 22 factorial design was used to determine the effects of measurement parameters (amount of material loaded [W, 200 and 400 g], number of segregation cycles [1 and 5]) with number of replicates 6. Analysis of variance (ANOVA) showed that W was a critical parameter for segregation testing. The L/F value deviated further from 1 (greater ST) with increasing W. A 23 full factorial design was used to assess the effects of formulation variables: grade of ASP (unmilled, milled), grade of MCC (PH200 and PH301), and amount of lubricant MgS (0% and 0.5%). Multi-linear regression (MLR) and ANOVA showed that the grade of ASP was the main effect contributing to ST. Principal component regression (PCR) analysis established a correlation between L/F and the physical properties of the blend related to ASP and MCC, the ASP/MCC particle size ratio (PSR), and powder cohesion (Figures 15.3 and 15.4). The physical properties of the blend related to density and flow were not influenced by the grade of ASP and were not related to the ST of the blend. The direct relationship between L/F and PSR was determined by univariate analysis. ST increased as the ASP/MCC PSR increased (Figure 15.5). This study highlighted critical test parameters for segregation testing and identified critical physical properties of the blends that influence ST.

Figure 15.3PCR model to link ST with physical properties for various formulations. PC1, PC2, and PC3 coefficients of X-loadings for model based on all nine physical properties. (Reprinted from Journal of Pharmaceutical Sciences, 97(10), Xie L, Wu H, Shen M et al., Quality-by-Design (QbD): Effects of testing parameters and formulation variables on the segregation tendency of pharmaceutical powder measured by the ASTM D 6940-04 Segregation Test, 4485–97, Copyright 2008, with permission from Elsevier.)

Figure 15.4Predicted L/F versus measured L/F. PCR model is based on PSR and Co only. Solid line is the regression line for calibration model (◾); dotted line is the regression line for leave-one-out cross-validation results (o). (Reprinted from Journal of Pharmaceutical Sciences, 97(10), Xie L, Wu H, Shen M et al., Quality-by-Design (QbD): Effects of testing parameters and formulation variables on the segregation tendency of pharmaceutical powder measured by the ASTM D 6940-04 Segregation Test, 4485–97, Copyright 2008, with permission from Elsevier.)
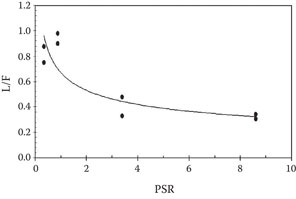
Figure 15.5Dependency of ST on ASP/MCC PSR for the second DOE study. (a) L/F mean versus PSR; the curve represents the best fit using a power model. (Reprinted from Journal of Pharmaceutical Sciences, 97(10), Xie L, Wu H, Shen M et al., Quality-by-Design (QbD): Effects of testing parameters and formulation variables on the segregation tendency of pharmaceutical powder measured by the ASTM D 6940-04 Segregation Test, 4485–97, Copyright 2008, with permission from Elsevier.)
Effects of Formulation Compositions on Capsule Weight Variation
Background and Methodology of Capsule-Filling Process Characterization
Capsule weight variation is a CQA for capsule product. Typically, weight variation and content uniformity problems are caused by poor powder flow and drug segregation in the powder bed.13,37,46 For batch release, the United States Pharmacopeia (USP) <911> requires that the batches pass tests for weight and drug content uniformity. However, during early development stage when the supply of drug is limited, the direct measurements of drug content assay can be prohibitively expensive. In this regard, using indirect methods to assess product uniformity in the laboratory with a relatively small amount of material has practical advantage.
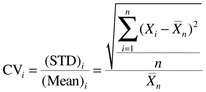
One of the most common metrics for assessing a product’s variability is the coefficient of variation (CV), which is equal to the standard deviation divided by the mean. The CV is also termed as the relative standard deviation.47 In this study, the CV will be used as an index to evaluate the dispersion or variability of the samples around the mean value. The sampling practice used in our study is illustrated in Figure 15.6.

Figure 15.6Scheme demonstration of the data collection and calculation profile for the different CVs.
As shown in Figure 15.6, the solid arrow on the ij plane represents the progression of the manufacturing process with time. A certain number of capsule samples can be taken from the process at various time points. For a relatively high-speed capsule-filling machine, 10 consecutive capsules can be taken in less than 1 min; thus, for an extended run, these samples are considered to be collected at a single specified sampling time point. The individual CV at each sampling time point, CVi, is calculated by Equation 15.2. In addition, the mean of all the individual CVi can be abbreviated as CViavg. To study how the capsule weight changes with the manufacturing time along the j axis in Figure 15.6, the average weight value (Wavg) and CV during the entire manufacturing process, CVj, can be calculated by Equation 15.3. Furthermore, a total CV, which is the CV of all the capsules analyzed, CVij, can be calculated by Equation 15.4.
 15.2
15.2 15.3
15.3 15.4
15.4where X is the quality parameter to be studied. X¯ is the average of X, n is the number of capsules collected at each sampling time point at the i axis, and m is the number of sampling time points at the j axis. N is the total number of samples measured (N = m × n). The j axis represents the time length of a process run. It is very important to understand the variation of the capsule product quality attributes and the contributing factors.
Previous Work on Capsule-Filling Formulation Study
The effects of various physical properties of formulation components (such as type and source of excipients, particle size and shape, lubrication, etc.) on capsule filling and solid dosage forms have been an active area for research and development. For microcrystalline cellulose (MCC),48 it was found that a fine-grade MCC such as Avicel PH105 cannot be used in capsule filling because of unsatisfactory flow properties. Medium and coarse grades of MCC can be classified as a good capsule-filling excipient, but not all sources are suitable. The Lüdde–Kawakita constant a and Hausner’s ratio are good indicators of the capsule-filling performance, in terms of interchangeability of different sources, possibility of filling above maximum bulk density, and flow problems producing large coefficients of fill weight variation. For the effect of particle shape on the mechanical properties of powders,49 it was found that (i) for materials that consolidate by plastic deformation (e.g., Starch 1500 and NaCl), there is a large increase in compressibility, a large decrease in yield value, and a small decrease in elastic recovery in going from regular to irregular particles; and (ii) for materials that consolidate by fragmentation (e.g., lactose and Emcompress), the shape of the particles has practically no effect on the above properties. However, the irregular particles fracture to a greater extent than the regular ones as shown by the fragmentation propensity. For the effect of drug particle size on content uniformity of low-dose solid dosage form,50 it was shown that the computer model was able to qualitatively simulate the observed potency profiles using only the particle size distribution of the drug and assuming ideal mixing. The effects of particle size and shape on the angle of internal friction and flow factor of unlubricated and lubricated powders were quite interesting.51 For unlubricated powders, the angle of internal friction was found to depend on particle size and shape in a nonlinear manner, whereas the flow factor depended only on particle shape. For lubricated powders, both the angle of internal friction and the corresponding concentration of MgS depended only on the particle shape. A large aspect ratio as obtained for needle-shaped particles was accompanied by a particularly high angle of internal friction. In addition, the optimal MgS concentration was least for needle-shaped or round particles. While the flow factor depended only on particle shape, the corresponding optimal MgS was found to depend only on the particle size. It is important to note that the function of a lubricant in formulations for capsule filling is not limited to its effect on flowability. Lubricants (like MgS) relieve sticking of powders to tooling and other metal parts, facilitate ejection of plugs into capsules, can affect drug dissolution, and can affect plug mechanical strength. Too much MgS can adversely affect the ability to pick up and transfer plugs of uniform weight to capsules filled in dosator machines. In another independent study, the flowability of size fractions of five pharmaceutical excipients had been related to their capsule-filling performance.52 Capsule fill weight and weight uniformity were monitored and the CV (Xcv) of the fill weight of 20 capsules was used as an indicator of capsule-filling performance. Flowability was dependent on the particle size, morphology, and bulk density of the powder. Significant correlation was found between the values of Xcv and the flow parameters of Carr’s compressibility, Hausner’s ratio, angle of repose, Kawakita’s equation constant (a), and Jenike’s flow factor. Xcv was also related to the CV of the powder bed bulk density and the variation of the compression stress.
While all of the abovementioned studies helped to improve our understanding of how formulation variables affect capsule filling, unfortunately, only a univariate approach was used and is thus limited by its common drawback. A QbD approach that utilizes DOE and multivariate data analysis can offer certain advantages as described in the FDA’s PAT Guidance and ICH Q8(R2). The objective of this second case study is to examine the relationships between the important powder formulation parameters and capsule weight and content uniformity via a DOE approach.
Materials and Manufacturing Process
The same materials (ASP, MCC, and MgS), API milling, and sieving process were used as described in “Materials and Methods” section. The coarse ASP particles were collected from those retained on a #35 mesh screen. The fine ASP particles were collected from those passed through a 75-μm (200-mesh) sieve. The particle size was measured by laser diffraction using a Malvern Mastersizer (Malvern Inc., Worcestershire, UK). The Malvern dry powder feeder was operated at an air pressure of 60 psi. A sample size of 1 to 1.5 g was used. The sample size reduction method was cone-and-quartering. The materials were stored at room temperature in sealed plastic bags. The powders were mixed in a twin shell V-blender (8 quarts) (Patterson-Kelley Co.) for 30 min. For lubricated formulations, lubricant was added at the end of the blending time of 30 min and blended for another 30 min.
The capsules were filled at a speed of 66 capsules per minute using either a Zanasi LZ-64 (Zanasi Nigris, Bologna, Italy) or a Harro-Hofliger KFM/3 capsule-filling machine (M.O. Industries Inc., East Hanover, New Jersey). The target capsule-filling weight was from 200 to 300 mg for size #1 and 300 to 400 mg for size #0. Powder bed height was set at 40 mm for both machines and was manually controlled through the entire filling process. The piston height for Zanasi LZ-64 was set at 15 mm and the plug height was 12 mm. The piston settings for the Harro-Hofliger KFM/3 machine were as follows: 20 mm for tapping pins set 1, 15 mm for set 2, and 12 mm for set 3; these settings were chosen to match the final plug height of the Zanasi machine plugs when PH200 was used. The piston height setting contributes to the capsule fill weight. It is expected that a different combination of piston heights will affect the final capsule plug fill weight; thus, the effect of formulation and processing variables can be studied when fixed machine settings are used for all the batches manufactured. For each sampling time point, 30 capsules were collected in 1 min. A capsule sample was collected at 5- or 10-min intervals through the entire filling process and were immediately transferred into plastic Ziploc bags and stored at ambient temperature (22°C ± 2°C, 40% ± 5% RH). The manufacturing time of one batch varied from 60 to 120 min depending on the bulk density of the formulation.
Capsule Product Weight and Content Analysis
From the 30 capsules collected at each sampling time point, 10 capsules were randomly selected and numbered 1 through 10, and weighed to the nearest milligram using analytical balance. The capsules numbered 1 to 6 were used to measure content variation; these six capsules were individually analyzed for the weight of the capsule plug (i.e., without the shell) and the amount of ASP. For the ASP assay, the capsule shells were carefully opened, avoiding any powder loss. The capsule plug was dissolved in 50 mL of 0.1 N NaOH at room temperature. To extract the drug from the suspension, the sample was degassed for 5 min and then sonicated for 30 min. The suspension was centrifuged for 15 min at 2000 rpm and was diluted with 0.1 N NaOH in a 25-mL volumetric flask. The UV absorbance of the supernatant was measured at 298 nm with 0.1 N NaOH as a blank (Spectronic Genesys 2, Thermo Electron Corporation, Rochester, New York).
The drug concentration of each capsule can be calculated using the formula below:
 15.5
15.5Different from the drug amount per capsule, the drug concentration calculated here gives the drug amount per capsule normalized by capsule plug weight. This is needed when comparing the uniformity data of capsules with difference sizes.
Capsule-Filling Process Characterization and Effect of Formulation Composition on Capsule Fill Weight Variation via a DOE Approach
A previous study43 indicated that the differences in a formulation’s ST owing to PSR changes could be measured by the ASTM D 6940-04 segregation tester. In this work, powder systems with different segregation tendencies were selected to test the capsule-filling process. It has been reported39,40 that powders with large PSRs and big differences in particle density and spherical particles with smooth surfaces such as glass beads produce the most segregation. For a better understanding of powder movement in the hopper during the capsule-filling process, the movement of dyed MCC particles in the powder bed was examined. First, the purple MCC was layered at the bottom of the powder bed and covered with MCC that was not dyed at the beginning of the manufacturing process. Then, a continuous capsule-filling process was started via a Zanasi-LZ 64 machine. The capsule plugs were collected from the continuous capsule-filling process and aligned per the sequence of their manufacturing order as shown in Figure 15.7, with number “1” representing the first capsule plug collected and number “262” representing the last capsule plug collected. The picture in Figure 15.7 shows clearly that the colored powder initially placed at the bottom of the powder bed quickly migrates throughout the powder bed along with the machine parts movement during the course of the capsule-filling process. It suggests that extensive mixing occurs in the hopper.

Figure 15.7Capsule plugs collected and aligned according to their manufacture order (beginning from left to right and from top to bottom). Powder bed has purple MCC on the bottom and white MCC on the top. It is evident that two types of materials are mixed well at the end of the capsule-filling process.
A DOE was created to measure the effects of capsule-filling formulation compositions on the capsule weight and drug content uniformity, as shown in Table 15.1. The experimental results are shown in Figures 15.8 through 15.11.
Formulations Symbol | API Grade ASP% = 4% (D50) | Filler Grade FT(D50) | Lubricant Level LL (%) | Capsule Size CS |
|---|---|---|---|---|
F1 | Fine ASP (72 μm) | 2 (208 μm) | 0 | 1 |
F2 | coarse ASP (608 μm) | 2 (208 μm) | 0 | 1 |
F3 | Fine ASP (72 μm) | 1 (72 μm) | 0 | 1 |
F4 | Coarse ASP (608 μm) | 1 (72 μm) | 0 | 1 |
F5 | Fine ASP (72 μm) | 2 (208 μm) | 0.500 | 1 |
F6 | Coarse ASP (608 μm) | 2 (208 μm) | 0.500 | 1 |
F7 | Fine ASP (72 μm) | 1 (72 μm) | 0.500 | 1 |
F8 | Coarse ASP (608 μm) | 1 (72 μm) | 0.500 | 1 |
F9 | Fine ASP (72 μm) | 2 (208 μm) | 0 | 0 |
F10 | Coarse ASP (608 μm) | 2 (208 μm) | 0 | 0 |
F11 | Fine ASP (72 μm) | 1 (72 μm) | 0 | 0 |
F12 | Coarse ASP (608 μm) | 1 (72 μm) | 0 | 0 |
F13 | Fine ASP (72 μm) | 2 (208 μm) | 0.500 | 0 |
F14 | Coarse ASP (608 μm) | 2 (208 μm) | 0.500 | 0 |
F15 | Fine ASP (72 μm) | 1 (72 μm) | 0.500 | 0 |
F16 | Coarse ASP (608 μm) | 1 (72 μm) | 0.500 | 0 |

Figure 15.8The plot of the weight CVij versus formulations (region 1: unlubricated batches, region 2, lubricated batches).

Figure 15.9The plot of the content CVij versus formulations (region 1: unlubricated batches, region 2, lubricated batches).

Figure 15.10The plot of weight CVij and content CVij versus ST on a Zanasi LZ-64 machine.

Figure 15.11The relationship between the ST value and the content variation demonstrated on different equipment with size 1 or 0 capsules.
Stay updated, free articles. Join our Telegram channel

Full access? Get Clinical Tree


