CHAPTER 24
Pharmacokinetic Considerations in Oncology
ALICE C. CEACAREANU, PharmD, PhD
ZACHARY A.P. WINTROB, MSc
DOXORUBICIN
The anthracycline age began over half century ago, when a soil sample harvested near the Castel del Monte in Italy revealed Streptomyces peucetius, a new bacterial strain producing a bright red pigment that was found to have good activity against murine tumors. A mutated strain of S. peucetius was found to produce a different red compound that was named Adriamycin, after the Adriatic Sea. Today, also known as doxorubicin (DOXO), this prototype compound remains one of the most prescribed antineoplastic agents. Currently, more than 2,000 known DOXO analogues provide invaluable clinical and research applicability.
DOXO has an exceptional chemical reactivity and is able to react with several molecules within the cell, leading to a variety of toxic effects, all of which contribute to its unique antineoplastic efficacy. Beginning with polymerase inhibition and DNA intercalation and ending with perturbation of calcium homeostasis, DOXO finds itself a place in most antineoplastic combo regimens.1-5
In order to relate DOXO dosing to its therapeutic effect or occurrence of toxicity, a number of physiologically based pharmacokinetic (PBPK) models have been tested to allow for simulation and prediction of therapeutic drug or metabolite levels.6 Roughly a decade ago, Gustafson and colleagues developed a DOXO PBPK model capable to predict PK alterations in special human populations; however, despite its invaluable utility, this model is largely underutilized for clinical benefit.6 The model described here is available as a complete model code from Gustafson and others. We provide this information with the hope of promoting its utilization in direct patient care.
1. Tissue compartment mass balance:
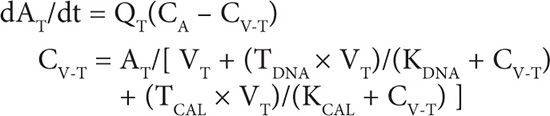
2. Blood compartment mass balance:
3. DOXO metabolism by aldo-keto reductases:
dAMAKR/dt = (VMAX-AKT × CV-T)/(KM-AKT × CV-T)
4. DOXO metabolism by aglycone:
dAMAG/dt = KMET-AG × CV-T × VT
5. Amount of DOXO eliminated in urine (U):
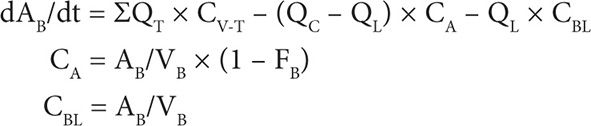
dAEU/dt = FFILT × QK × CA + (VMAX-PGP-K × CBL)/(KM-PGP-K + CBL)
6. Amount of DOXO eliminated in feces (F):
NOMENCLATURE8
Q: Blood flow (L/h)
A: Amount of drug (mols)
V: Tissue volume (L)
CA:: Arterial blood concentration of free DOXO (M)
CV: Venous blood concentration of total DOXO leaving tissues (M)
CBL: Arterial blood concentration of total DOXO (M)
FB: Fraction of DOXO bound to plasma proteins
TDNA: Tissue-specific DNA binding capacity for DOXO (M)
TCAL: Tissue-specific cardiolipin binding capacity for DOXO (M)
KDNA: Binding affinity of DOXO for DNA (M)
KCAL: Binding affinity of DOXO for cardiolipin (M)
AM: Amount metabolized (mols)
AE: Amount excreted (mols)
VMAX: Maximum rate of activity (mols/hr/L tissue)
KM: Michaelis’s constant (M)
KMET: First-order metabolic rate constant (h–1kg tissue–1)
FFILT: Fraction renal blood flow filtered at the glomerulus
Subscripts:
T: Generic tissue compartment
C: Total cardiac output
L: Liver
K: Kidney
G: Gut
B: Blood
AKR: Aldo-keto reductase
AG: Aglycone
PGP: P-glycoprotein
Given DOXO’s liver metabolism and bile elimination, dose reduction was considered a logical approach in cases with hepatic disease or liver metastases. However, dose reduction requirement has never been validated in patients with liver dysfunction and little is known about its actual clinical benefit. We provide here evidence indicating the main rationale for or against dose adjustment in various clinical circumstances.
To date a whole body of clinical practice has widely adopted DOXO dose reduction by 50 percent and 75 percent, respectively, in patients with moderately and severely impaired liver function, based on evidence provided from clinical trials research involving not more than 17 patients with liver dysfunction.7–9 Roughly two decades ago, a study including 64 patients with nonlymphocytic leukemia that evaluated the relationship between pretreatment liver function and DOXO PK indicated similar plasma levels, incidence of toxicity and complete response rate in patients with mild pretreatment liver impairment receiving full dose of DOXO and in those with normal hepatic function. Individuals with impaired liver function in which a dose reduction has been applied displayed lower plasma concentrations and less toxicity, but no significant difference in response rate when compared to those receiving full dose.10 Although beyond the study’s main goal, whether the lower-dose group encountered a shorter duration of response and survival remains unknown. Interestingly a number of subsequent studies, evaluating altogether roughly 40 patients with liver impairment, reported either normal plasma profiles or moderately increased AUC for DOXO and doxorubicinol, not justifying dose adjustment in patients with liver dysfunction receiving full DOXO dose.11-14 A significantly increased AUC and prolonged half-life time was associated with bilirubin levels sixfold higher than normal.14
Considering these data together with the evidence of anthracycline-induced cardiomyopathy unveils interesting clues. The recommended maximum cumulative lifetime dose of 450–550 mg/m2 DOXO and 400–550 mg/m2 daunorubicin was the result of a documented frequency of 5 percent of patients developing congestive cardiac failure when treated with this dose. Although cardiac failure incidence up to 50 percent was observed in cases receiving 1,000 mg/m2, a significant improvement was found to be associated with administration of a weekly dose or >24-hour continuous infusion as opposed to bolus.15,16 Potentially the cause for lower cardiotoxicity incidence observed in a modified administration schedule is the additional time that allows the slow formation and elimination of doxorubicinol. Its formation was shown to be slower in patients with elevated bilirubin and at least one study (4 out of 31 cases with impaired liver function) reported prolonged half-life time.14 Mildly abnormal liver function tests did not affect DOXO clearance and toxicity, and it is likely that any dose reduction for bilirubin levels lower than 3 are likely going to result in decreased effectiveness. High bilirubin levels have been associated with higher AUC.13,14 However, DOXO toxicities appear to be related to the peak plasma concentration rather than the AUC.17 Thus, weekly dosing administered by slow continuous infusion may provide a survival advantage over dose reduction, especially in populations with preexisting cardiac disease or concomitant or prior mediastinal or chest wall irradiation in which the maximum cumulative dose will already be reduced. In such patients who also present with impaired liver function or liver metastasis, further dose reduction should be cautiously considered.
CASE STUDIES
CASE 1
A 48-year-old Caucasian woman with a history of successfully treated breast cancer, roughly a decade ago, is diagnosed with acute myelogenous leukemia (AML). She is initiated on Ara-C standard dose (100 mg/m2) for 7 days and is to begin daunorubicin 45 mg/m2 for 3 days upon clarification of the total cumulative anthracycline dose received during her breast cancer treatment. A discussion with the oncologist who treated her for breast cancer reveals that her initial treatment included a total DOXO dose of 825 mg. He also indicates that his dosing was guarded due to patient’s history of hepatitis B and associated risk for liver failure due to virus activation. Her current liver function tests are as follows: AST = 112, ALT = 98, Alk Phos = 232, TBili = 1.7, DBili = 0.7, Albumin = 3.4.
Height = 173 cm
Weight = 212 kg
QUESTION 1
Is daunorubicin a viable option in this patient?
Answer
Daunorubicin is a significant component of the AML antineoplastic treatment; however, its use is limited by the cumulative lifetime dose of any anthracycline ever administered in that patient, regardless of the time frame since last utilization (including childhood, if applicable).
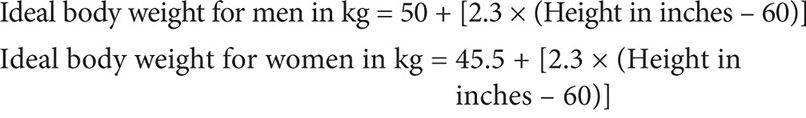
Because she received DOXO for breast cancer treatment, the utilized equivalent of daunorubicin should be calculated. Her dose per body surface area should be calculated according to her current actual body weight.18
QUESTION 2
Has she reached her lifetime cumulative dose?
Answer
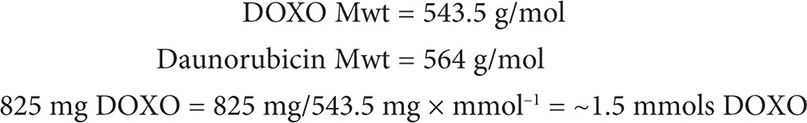
Following the chemistry law of Avogadro, 1 mol of DOXO contains the same number of molecules as 1 mol of daunorubicin. Thus, 1.5 mmols DOXO = 1.5 mmols daunorubicin.
We can now convert mmols daunorubicin into mg:
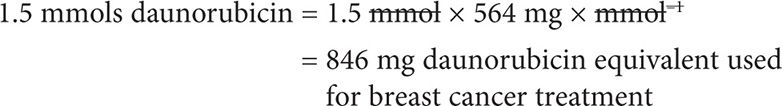
The correct answer is that patient has NOT yet reached the daunorubicin lifetime cumulative dose.
QUESTION 3
How many anthracycline cycles could she take advantage of without increasing the risk of hepatitis B reactivation?
Answer
The patient’s current BSA can be calculated with the formula:
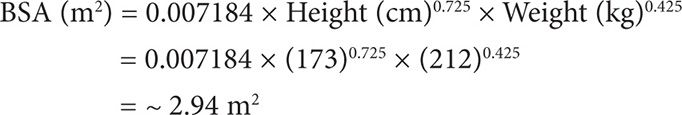
Thus, since her lifetime cumulative dose for daunorubicin is 550 mg/m2, she could in theory receive a total of 550 mg × m-2 × 2.94 m2 = 1,617 mg. Considering she already received a daunorubicin equivalent of 846 mg, she could theoretically receive up to 1,617 – 846 = 771 mg daunorubicin.
Her planned daunorubicin dose is 45 mg/m2 daily for 3 days (cycle 1). The expected dose utilization per cycle will be:
45 mg/m2 × 2.94 m2 × 3 days (cycle) = ~397 mg/cycle
Based on her liver function tests (emphasis on low albumin and slightly elevated bilirubin), it is possible that she may benefit from administration of a lower dose instead of a full 45 mg/m2 dose. A 25 percent dose reduction will allow administration of a guarded amount of anthracycline, less likely to reactivate the dormant hepatitis B virus, and also potentially allow two cycles of Ara-C + daunorubicin combination regimen, known for its increased effectiveness as compared to Ara-C alone.
CARBOPLATIN
Carboplatin holds the advantage in therapy with significantly lower numbers of nonhematological toxicities as compared to cisplatin (Figure 24-1).19 The benefit of much less nephrotoxicity and peripheral neuropathy and the similar cytotoxic activity as cisplatin facilitated the gradually increased carboplatin utilization over the last decades. With thrombocytopenia as the main dose-limiting toxicity, pretreatment renal function rather than kidney toxicity affects the extent of thrombocytopenia. Therefore, close therapeutic drug monitoring should be conducted routinely for carboplatin treatment.20,21 Renal clearance is directly associated to the glomerular filtration rate (GFR), potentially due to the lack of active renal secretion and near exclusive filtration through the glomerulus. The antineoplastic activity and toxicity will then be determined mainly by the administered dose and the pretreatment GFR. Calvert and colleagues were able to demonstrate in a retrospective study that AUC was linearly related to dose only when GRF changes have been accounted for.22 The initial Calvert formula, Dose (mg) = AUC × (1.2 × GFR + 20), was tested on 18 patients as part of the phase I evaluation. A PK prospectively designed study of 31 patients was then conducted to evaluate the dosage formula. Observed and predicted AUC values have been plotted together, demonstrating a good correlation (correlation coefficient r = 0.886, P<0.00001).
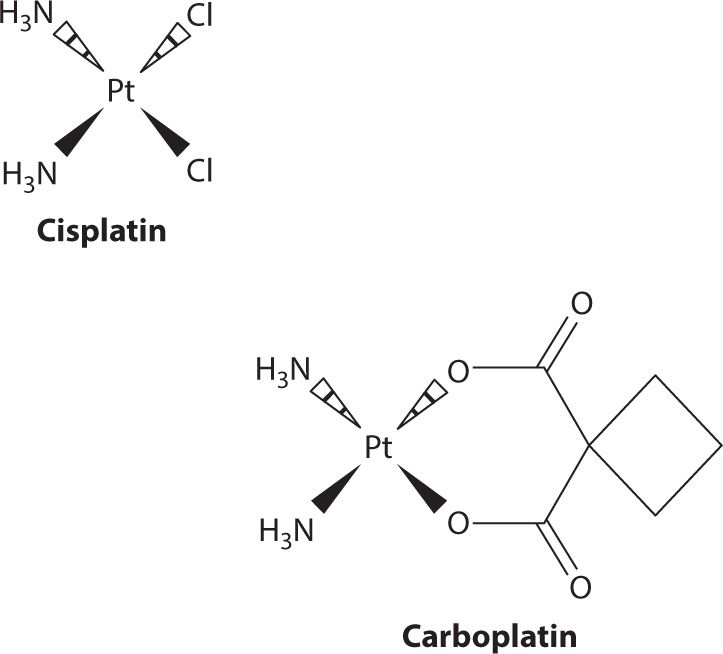
FIGURE 24-1. Structurally, carboplatin is both larger than cisplatin and less potent. The structural differences cause carboplatin to have a lower membrane permeability which results in carboplatin doses being much higher; with respect to metabolism it is also less reactive. Pharmacokinetically, this manifests in the form of a longer half-life than cisplatin and a much larger fraction being recovered in urine. Despite undergoing minimal metabolism, carboplatin is able to yield cisplatin upon incubation in solution with sodium chloride. This makes it hard to identify whether or not the portion that is not recovered unchanged in urine is the result of metabolism or simply a chemical reaction with circulating chloride ions.
In order to increase precision of the dose calculation, the nonrenal clearance for the tested cases has been measured as the difference between the renal and the total plasma clearance, with the assumption that the nonrenal clearance is constant. The formula generated was:
Dose (mg) = AUC × (A × GFR + B)
where A is the ratio of GFR to the renal clearance of the drug and B is the nonrenal clearance. The formula basically suggests that the nonrenal clearance is independent of patient characteristics.
Today A is assumed to equal 1 and, although the estimation of creatinine clearance is higher than GFR, the two values are used interchangeably for calculation of the dose by using the Calvert formula.
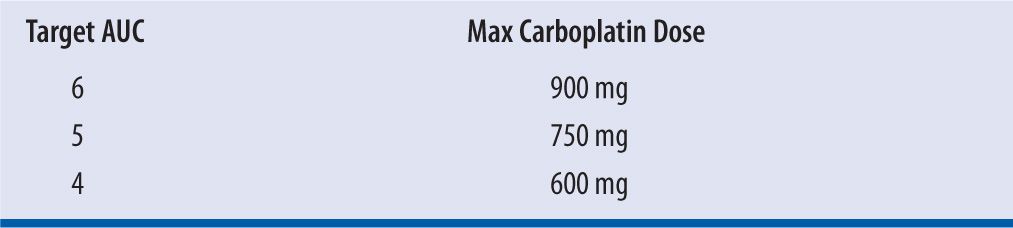
Total carboplatin dose (mg) = Target AUC × (GFR + 25)
The National Cancer Institute’s Cancer Therapy Evaluation Program recently published an action letter on AUC-based dosing of carboplatin guidelines. Through this letter it advises that GFR used in the Calvert formula should not exceed 125 mL/min, thus capping the maximum carboplatin dose based on target AUC (Table 24-1).
| TABLE 24-1 | Guidelines recommended maximum carboplatin doses per target AUCs |
This update has prompted the Gynecologic Oncology Group (GOG) to use Cockcroft-Gault instead of Jelliffe formula for GFR estimation. Because Cockcroft-Gault formula can still overestimate renal function in obese and elderly patients and further lead to carboplatin overdosing, GOG has recommended that in patients with abnormally low creatinine, a minimum serum creatinine value of 0.7 mg/dL should be used when estimating GFR. This value also accounts for the newer creatinine assay calibration system based on isotope dilution mass spectrometry.
CASE 2
A 74-year-old Caucasian male with a history of stage IIB non-small cell lung cancer, status postlobectomy one week ago, is to be started on carboplatin and paclitaxel for five cycles. He is a thin, frail man who tolerated surgery well and has unremarkable labs. The most recent serum creatinine level of 0.4 mg/dL. The oncologist wants patient to be dosed for an AUC of 5 and receive 150 mg/m2 paclitaxel.
Height = 181 cm
Weight = 65 kg
QUESTION 1
What are the doses in mg to be administered in this patient?
Answer
This dosage requires knowing the patient’s GFR, which can be sufficiently estimated by calculating the patient’s creatinine clearance based on the Cockcroft-Gault method. Because the serum creatinine level is <0.7 mg/dL, as per guidelines, 0.7 mg/dL should be used in its place in this calculation:

Therefore:
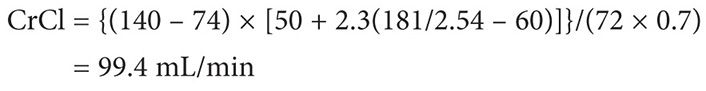
Using the Clavert formula:
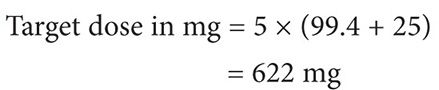
Thus the target dose for each cycle to target an AUC of 5 is 622 mg, assuming that the patient’s serum creatinine does not exceed 0.7 mg/dL.
METHOTREXATE
Methotrexate (MTX) history dates back to 1947 when Sidney Farber succeeded in extending the life of children with leukemia. Today, MTX is one of the most widely used drugs with large applicability in the treatment of various diseases, including cancer. Its utilization in oncology applies to treatment of both solid and hematologic malignancies, including osteosarcoma, breast, lung, stomach, bladder, head and neck cancers, as well as leukemia and lymphoma.
MTX is an antimetabolite drug that enters the cell primarily via the reduced folate carrier, an endocytic uptake mechanism, activated by MTX binding to the folate receptor. However, at extracellular concentrations above 20 μM MTX is able to enter the cell by passive diffusion in addition to active transport.23 Upon its penetration into the cell, MTX inhibits the conversion of dihydrofolate to tetrahydrofolate by competitive inhibition of dihydrofolate reductase.24 Methylated tetrahydrofolate is essential for the conversion of deoxyuridine monophosphate to deoxythymidine monophosphate by thymidylate synthase through reductive methylation. Subsequent phosphorylation of deoxythymidine monophosphate yields thymidine triphosphate, one of the four nucleotides used in DNA synthesis.25 By inhibiting the upstream production of substrates essential for DNA synthesis and repair, MTX inhibits cell growth, thereby inducing apoptosis in rapidly proliferating cancer cells.
In addition to inhibiting DNA synthesis, MTX can be polyglutamated by folypolyglutamate synthetase. Long-chain polyglutamated MTX then also interferes with de novo purine synthesis and inhibits RNA production by inhibiting glycinamide ribunucleotide transformylase, the enzyme that catalyzes the transfer of a formyl group from formyl tetrahydrofolate to glycinamide ribonucleotide. Importantly, the inhibition of this reaction prevents the production of formyl-glycinamide ribonucleotide, a purine precursor, and tetrahydrofolate, preventing the downstream biosynthesis of inosine monophosphate.26 Polyglutamated MTX also provides the advantage of an increased intracellular mean residence time, thereby allowing a greater intracellular exposure. However, polyglutamates can be cleaved by γ-glutamyl hydrolase yielding a lower number of glutamates bound to MTX.23 Both MTX and its polyglutamates have dramatically greater affinity, between 1,000- and 10,000-fold, for dihydrofolate reductase than does dihydrofolate, its natural substrate.24,27 However, in order to have the desired effect MTX must first make it to the tumor cell. This process, for oral formulations, requires absorption from the gut into the blood stream and then surviving the “first-pass effect” of the liver before it reaches the tumor.
The structure of MTX is charged at physiologic pH (Figure 24-1). Both carboxyl groups, as well as nitrogen 1 and 10, are deprotonated at physiologic pH and thus MTX is anionic with a negative 2 charge.27,28 As a result MTX is prevented from easily diffusing across intestinal membranes and thus the primary method of absorption is active transport. This transport is saturable and, therefore, creates an inverse relationship between bioavailability and dose whereby the bioavailability of MTX decreases with high doses. Gastrointestinal bacteria are also responsible for metabolizing approximately 5 percent of the dose before it is ever absorbed. Bioavailability of oral MTX ranges from as low as 12 percent at doses exceeding 40 mg/m2 to almost 90 percent at doses less than one quarter of that, but high MTX doses used in cancer treatment typically range from 1 to 12 g/m2, which necessitate intravenous infusion (Figure 24-2).
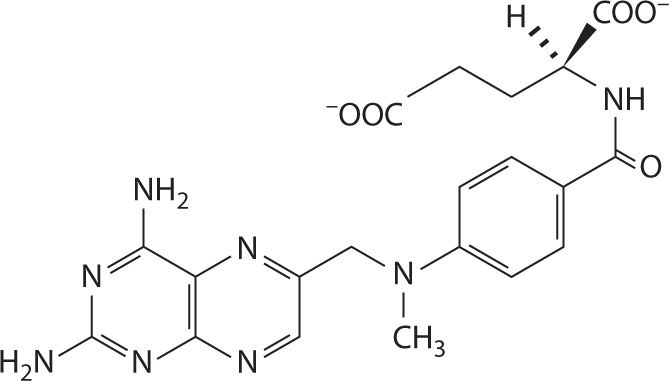
FIGURE 24-2. The structure of MTX at physiologic pH. The α-carboxyl group has a pKa of 4.70 ± 0.10 and the γ-carboxyl group has a pKa of 3.36 ± 0.20.28 At pH values of 5.5–8, MTX is anionic, thus predominantly absorbed by saturable active transport in the gut.
MTX has also been demonstrated to be a substrate for a number of efflux and chemo-resistant transporters from the ATP-binding cassette (ABC) superfamily of membrane transporters, including multidrug-resistant protein 2 (MRP2)29 and breast cancer resistance protein (BCRP).30,31 These transporters play a major role in the distribution of MTX throughout the body. While biliary clearance is only a minor route of elimination, responsible for less that 10 percent of MTX clearance, MRP2 is expressed in a number of tissues and tumors.32-35 Overexpression and overactive alleles of efflux transporters, such as the BCRP encoded by a single nucleotide polymorphism C >T (rs717620) in the 5’ untranslated region, result in approximately a 30 percent increase in clearance and 40 percent increase in volume of distribution.31 Even though these alleles are associated with preventing delayed elimination, the main risk factor for toxicity, they are also associated with decreased exposure, the main risk factor for relapse and death.
Regardless of transporter variation, the predominant route of elimination for MTX is glomerular filtration with approximately 90 percent of the dose being eliminated unchanged in the urine.36 The predominance of renal excretion raises real concerns regarding nephrotoxicity. Due to the relatively high pKa of MTX and its metabolite 7-hydroxy MTX, it may become protonated in low-pH urine, which can result in precipitation and kidney injury. For this reason, urine alkalization is mandatory prior to MTX infusion. Genetic polymorphisms in transporters are also associated with delayed elimination by the kidney. The most profound is a common functional C667T substitution in methylenetetrahydrofolate reductase. This polymorphism does not directly affect secretion by the kidney; it is rather an upstream target of MTX therapy. It is nonetheless associated with a 50 percent increase in half-life, a threefold increase in AUC, and a fourfold decrease in glomerular filtration rate.37
The most employed tool to prevent toxicity and prevent underdosing is now utilization of therapeutic drug monitoring algorithms that have been developed using pharmacokinetic-based Bayesian estimation. For years, associations between pharmacokinetics and both disease response and toxicity have been studied with some conflicting results. Reports dating back to 2004 suggest that pharmacokinetic parameters such as AUC and Cmax are useful for predicting outcomes, as well as toxic side effects such as mucocitis.38-41 Other reports indicate that pharmacokinetic monitoring was of little benefit for predicting outcomes or toxicity.42 What is important to recognize is that the study by Martelli and colleagues, who found little benefit, used a maximum dose of 4.5 g/m2 over 24 hours, while the studies by others had maximum doses of 8–12 g/m2 over the same time frame. The effect is that the AUCs achieved in the study by Martelli did not reach the threshold set by previous studies to detect the improved outcomes. The threshold suggested by Aquerreta and colleagues is an AUC of 4,000 mmol·hr/L, while Martelli had a mean AUC of 1,810 mmol·hr/L with a range of 622–4,964 mmol·hr/L. At the opposite end, other studies that also have difficulty discriminating benefit in survival use a default dosing of 12 g/m2 that only observes AUCs between 10,000 and 16,000 mmol·hr/L.43
Regardless, when taken together, all the studies share similar survival AUC relationships. Despite the studies not finding significant differences in survival based on the quartiles or median splits they observed, the Kaplan-Meier survival curves for the AUCs observed are comparable to those of the relevant quartile observed by those that found a difference. That is to say, regardless of the study, an AUC of 4,000 mmol·hr/L has comparable survival to another AUC of 4,000 mmol·hr/L. This finding builds a strong rationale for pharmacokinetic dosing of MTX.
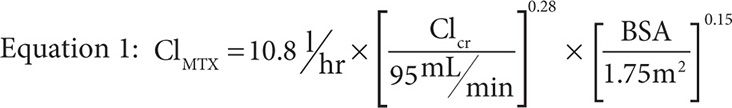
MTX concentrations are well described by a two-compartment mammillary model with an alpha and beta phase of elimination. The alpha phase is typically short and thus most sampling schemes miss it entirely because dosing algorithms are based on pharmacokinetic parameters at 24 and 48 hours postinfusion. As a result, little is reported about the alpha phase except that the half-life during this elimination phase is approximately 3.5 hours in patients with normal elimination as compared to the terminal half-life seen during the beta phase of approximately 12.5 hours. The main driver of the half-life is clearance, commonly measured during the beta phase to be between 8 and 11 L/hr,41,44-46 and predicted by Equation 1 where ClMTX is the clearance of MTX, ClCr is the creatinine clearance in mL/min as calculated by the Cockroft-Gault method with a maximum value of 140 mL/min, and BSA is body surface area in m2 as calculated by the DuBois and DuBois method.47
When dosing MTX, however, it is impractical to routinely monitor blood levels as one would in a pharmacokinetic study and, therefore, the implementation of sparse sampling at either 24 hours or 48 hours is used to assess whether a patient is having delayed elimination. In such cases, the dose can be adjusted for future administrations but leucovorin rescue must be initiated to offset the MTX toxicity that is likely to be experienced in cases of delayed elimination. Table 24-2 summarizes the published studies regarding delayed elimination of MTX and dose or leucovorin rescue adjustment.
| TABLE 24-2 | Summary of MTX PK-based dosing recommendations |
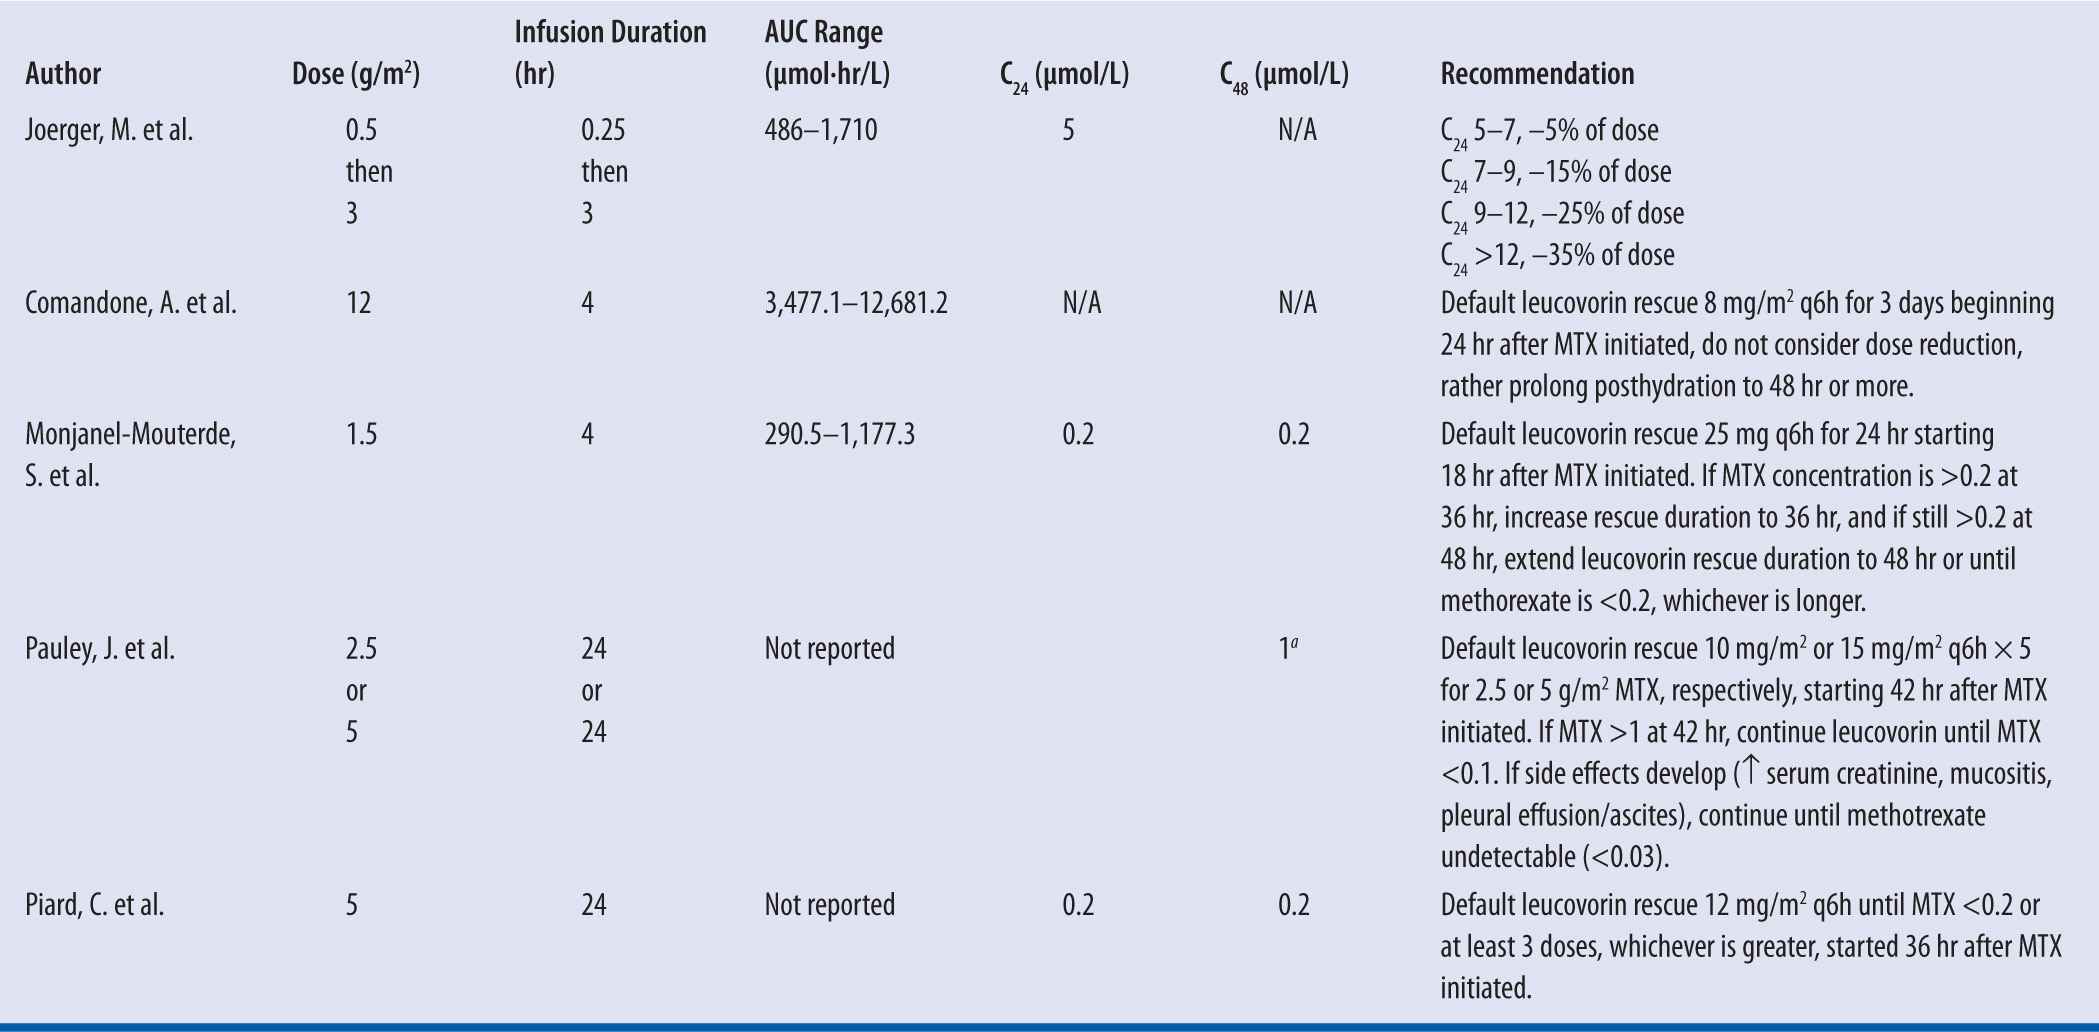
C24 is the MTX concentration at 24 hr and C48 is the MTX concentration at 48 hr.
aRecorded at 42 hr not 48 hr.
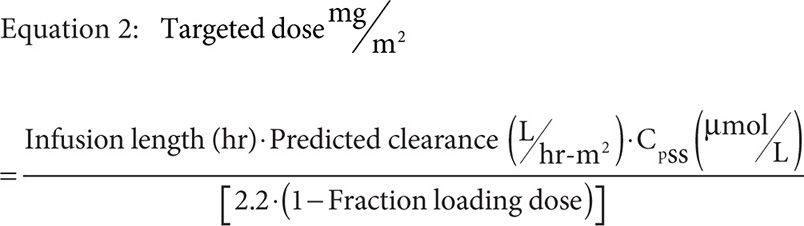
Only Pauley and colleagues present a method used for dose optimization based on a target steady-state concentration (CpSS) during infusion. This method increased the number of patients within the desired range by approximately 17 percent. Such a method requires gathering pharmacokinetic data at multiple time points, at least three or four, during a previous round of MTX therapy to fit using a two-compartment mammillary infusion model that can then be used to target a dose for a particular CpSS range. The proposed sampling strategy included a level drawn just prior to infusion, at 6 hours, at 23 hours, and at 42 hours. The draw at 23 hours was just prior to the end of the 24-hour infusion, and likely to be considered a confirmation of the calculated CpSS. Using the pharmacokinetic information gathered during the previous MTX administration and model fitting, specifically BSA normalized clearance, one can target the next dose using Equation 2.
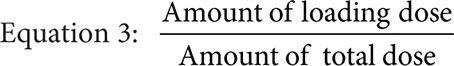
Where the infusion length is the total infusion time in hours minus the infusion time of the loading dose in hours, the fraction loading dose is given by Equation 3, and predicted clearance is given by either the previously measured value or Equation 4 if targeting a CpSS >33 μM with a previously measured clearance <7.5 L/hr·m2.
Equation 4: 104.349+0.1152· Log(Previous Clearance)–0.3422• SrCr–0.239·Bilirubin–0.000582· SGPT
where the previous clearance and the predicted clearance are both BSA normalized, SrCr is the serum creatinine in units of mg/dL, bilirubin is in units of mmol/L, and SGPT is the serum glutamic pyruvic transaminase in units of units/L.
It is important to note the units of the target dose are mg/m2 not g/m2 and so represent one place where a dosing error could be made because MTX is typically dosed as g/m2 not mg/m2. Furthermore, the drug concentration in the central compartment of a two-compartment infusion model, while the infusion is running, is described by Equation 5, where Q is the infusion rate, α and β are the initial phase and the terminal phase residual slopes, respectively, and k21 is the first-order exchange rate constant between the peripheral compartment and the central compartment.

If we set the time equal to infinity, Equation 5 reduces to Equation 6.
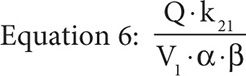
Because the elimination rate constant, ke, is equal to (α × β)/k21 and with the assumption that the concentration at time infinity is steady state, if the assumption that the MTX concentration at 23 hours is also steady state holds, then by substitution we obtain Equation 7.
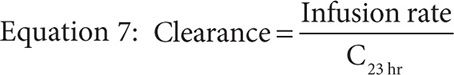
The equation allows an estimation of the previous clearance knowing only one steady-state MTX concentration and the infusion rate for use in the dose adjustment calculated by Equation 2. Pauley and colleagues point out that if the calculated target dose is more than a 50 percent increase or decrease, then the dose change should be limited to no more than 50 percent. Important to note is that Equation 7 assumes linear elimination kinetics, which may not necessarily be true. Tubular reabsorption is saturable at doses as low as 7.5 mg. Also the metabolism to 7-hydroxy-MTX and subsequent biliary excretion are also saturable, but the doses employed in the oncology setting exceed 7.5 mg by about 100- to 3,000-fold and biliary excretion is responsible for less than 10 percent of the total clearance, so it seems likely that any error introduced by Equation 7 would be negligible.48,49 Nonlinearity can also be introduced by saturable protein binding, and MTX is known to be albumin bound. However, Lee and colleagues demonstrated that in analbuminemic rats, MTX had the same fraction bound to plasma proteins because the lack of albumin binding was able to be compensated by β-plus and γ-globulins. Furthermore, plasma protein binding has been demonstrated to be linear for MTX at concentrations ranging from 100 pM to 1 mM, ranges that could be expected to be observed in MTX treatment, with 1 mM being about five- to tenfold higher than a CpSS targeted by a 24-hour infusion.50
CASE 3
Stay updated, free articles. Join our Telegram channel

Full access? Get Clinical Tree


