Pharmacodynamics: Molecular Mechanisms of Drug Action
Pharmacodynamic Concepts
Pharmacodynamics is the study of the biochemical and physiological effects of drugs and their mechanisms of action. The effects of most drugs result from their interaction with macromolecular components of the organism. The term drug receptor or drug target denotes the cellular macromolecule or macromolecular complex with which the drug interacts to elicit a cellular response. Drugs commonly alter the rate or magnitude of an intrinsic cellular response rather than create new responses. Drug receptors are often located on the surface of cells, but may also be located in specific intracellular compartments such as the nucleus.
Many drugs also interact with acceptors (e.g., serum albumin) within the body. Acceptors are entities that do not directly cause any change in biochemical or physiological response. However, interactions of drugs with acceptors can alter the pharmacokinetics of a drug’s actions.
PHYSIOLOGICAL RECEPTORS
Many drug receptors are proteins that normally serve as receptors for endogenous regulatory ligands. These drug targets are termed physiological receptors. Drugs that bind to physiological receptors and mimic the regulatory effects of the endogenous signaling compounds are termed agonists. If the drug binds to the same recognition site as the endogenous agonist, the drug is said to be a primary agonist. Allosteric (or allotopic) agonists bind to a different region on the receptor referred to as an allosteric or allotopic site. Drugs that block or reduce the action of an agonist are termed antagonists. Antagonism generally results from competition with an agonist for the same or overlapping site on the receptor (a syntopic interaction), but can also occur by interacting with other sites on the receptor (allosteric antagonism), by combining with the agonist (chemical antagonism), or by functional antagonism by indirectly inhibiting the cellular or physiological effects of the agonist. Agents that are only partly as effective as agonists are termed partial agonists. Many receptors exhibit some constitutive activity in the absence of a regulatory ligand; drugs that stabilize such receptors in an inactive conformation are termed inverse agonists (Figure 3–1). In the presence of a full agonist, partial and inverse agonists will behave as competitive antagonists.
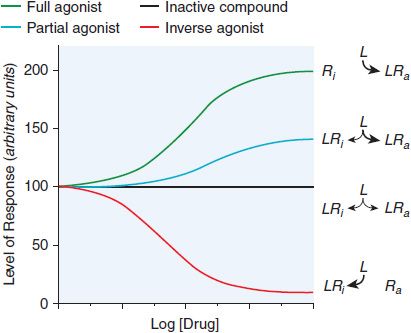
Figure 3–1 Regulation of the activity of a receptor with conformation-selective drugs. The ordinate is the activity of the receptor produced by Ra, the active receptor conformation (e.g., stimulation of adenylyl cyclase by a β adrenergic receptor). If a drug L selectively binds to Ra, it will produce a maximal response. If L has equal affinity for Ri and Ra, it will not perturb the equilibrium between them and will have no effect on net activity; L would appear as an inactive compound. If the drug selectively binds to Ri, then the net amount of Ra will be diminished. If L can bind to receptor in an active conformation Ra but also bind to inactive receptor Ri with lower affinity, the drug will produce a partial response; L will be a partial agonist. If there is sufficient Ra to produce an elevated basal response in the absence of ligand (agonist-independent constitutive activity), then activity will be inhibited; L will then be an inverse agonist. Inverse agonists selectively bind to the inactive form of the receptor and shift the conformational equilibrium toward the inactive state. In systems that are not constitutively active, inverse agonists will behave like competitive antagonists, which helps explain why the properties of inverse agonists and the number of such agents previously described as competitive antagonists were only recently appreciated. Receptors that have constitutive activity and are sensitive to inverse agonists include benzodiazepine, histamine, opioid, cannabinoid, dopamine, bradykinin, and adenosine receptors.
SPECIFICITY OF DRUG RESPONSES
The strength of the reversible interaction between a drug and its receptor, as measured by the dissociation constant, is defined as the affinity of one for the other. Both the affinity of a drug for its receptor and its intrinsic activity are determined by its chemical structure. The chemical structure of a drug also contributes to the drug’s specificity. A drug that interacts with a single type of receptor that is expressed on only a limited number of differentiated cells will exhibit high specificity. Conversely, drugs acting on a receptor expressed ubiquitously throughout the body will exhibit widespread effects.
Many clinically important drugs exhibit a broad (low) specificity because they interact with multiple receptors in different tissues. Such broad specificity might enhance the clinical utility of a drug, but also contribute to a spectrum of adverse side effects because of off-target interactions. One example of a drug that interacts with multiple receptors is amiodarone, an agent used to treat cardiac arrhythmias. Amiodarone also has a number of serious toxicities, some of which are caused by the drug’s structural similarity to thyroid hormone and its ability to interact with nuclear thyroid receptors. Amiodarone’s salutary effects and toxicities may also be mediated through interactions with receptors that are poorly characterized or unknown. Some drugs are administered as racemic mixtures of stereoisomers. The stereoisomers can exhibit different pharmacodynamic as well as pharmacokinetic properties. For example, the anti-arrhythmic drug sotalol is prescribed as a racemic mixture; the D– and L-enantiomers are equipotent as K+ channel blockers, but the L-enantiomer is a much more potent – adrenergic antagonist (see Chapter 29). A drug may have multiple mechanisms of action that depend on receptor specificity, the tissue-specific expression of the receptor(s), drug access to target tissues, drug concentration in different tissues, pharmacogenetics, and interactions with other drugs.
Chronic administration of a drug may cause a downregulation of receptors or desensitization of response that can require dose adjustments to maintain adequate therapy. Chronic administration of nitrovasodilators to treat angina results in the rapid development of complete tolerance, a process known as tachyphylaxis. Drug resistance may also develop because of pharmacokinetic mechanisms (i.e., the drug is metabolized more rapidly with chronic exposure), the development of mechanisms that prevent the drug from reaching its receptor (i.e., increased expression of the multidrug resistance transporter in drug-resistant cancer cells; see Chapter 5), or the clonal expansion of cancer cells containing drug-resistant mutations in the drug receptor.
Some drug effects do not occur by means of macromolecular receptors; aluminum and magnesium hydroxides [Al(OH)3 and Mg(OH)2] reduce gastric acid chemically, neutralizing H+ with OH– and raising gastric pH. Mannitol acts osmotically to cause changes in the distribution of water to promote diuresis, catharsis, expansion of circulating volume in the vascular compartment, or reduction of cerebral edema (see Chapter 25). Anti-infective drugs such as antibiotics, antivirals, and antiparasitics target receptors or cell processes that are critical for the growth or survival of the infective agent but are nonessential or lacking in the host organism. Resistance to antibiotics, antivirals, and other drugs can result through a variety of mechanisms including mutation of the target receptor, increased expression of enzymes that degrade or increase efflux of the drug from the infective agent, and development of alternative biochemical pathways that circumvent the drug’s effects on the infective agent.
STRUCTURE-ACTIVITY RELATIONSHIPS AND DRUG DESIGN
The receptors responsible for the clinical effects of many drugs have yet to be identified. Conversely, sequencing of the entire human genome has identified novel genes related by sequence to known receptors, for which endogenous and exogenous ligands are unknown; these are called orphan receptors.
Both the affinity of a drug for its receptor and its intrinsic activity are determined by its chemical structure. This relationship frequently is quite stringent. Relatively minor modifications in the drug molecule may result in major changes in its pharmacological properties based on altered affinity for 1 or more receptors. Exploitation of structure-activity relationships has frequently led to the synthesis of valuable therapeutic agents. Because changes in molecular configuration need not alter all actions and effects of a drug equally, it is sometimes possible to develop a congener with a more favorable ratio of therapeutic to adverse effects, enhanced selectivity among different cells or tissues, or more acceptable secondary characteristics than those of the parent drug. Therapeutically useful antagonists of hormones or neurotransmitters have been developed by chemical modification of the structure of the physiological agonist.
With information about the molecular structures and pharmacological activities of a relatively large group of congeners, it is possible to use computer analysis to identify the chemical properties (i.e., the pharmacophore) required for optimal action at the receptor: size, shape, position, and orientation of charged groups or hydrogen bond donors, and so on. Advances in molecular modeling of organic compounds and the methods for drug target (receptor) discovery and biochemical measurement of the primary actions of drugs at their receptors have enriched the quantitation of structure-activity relationships and its use in drug design. Such information increasingly is allowing the optimization or design of chemicals that can bind to a receptor with improved affinity, selectivity, or regulatory effect. Similar structure-based approaches also are used to improve pharmacokinetic properties of drugs, particularly if knowledge of their metabolism is known. Knowledge of the structures of receptors and of drug-receptor complexes, determined at atomic resolution by X-ray crystallography, is even more helpful in the design of ligands and in understanding the molecular basis of drug resistance and circumventing it. Emerging technology in the field of pharmacogenetics (see Chapter 7) is improving our understanding of the nature of and variation in receptors.
QUANTITATIVE ASPECTS OF DRUG INTERACTIONS WITH RECEPTORS
Receptor occupancy theory assumes that response emanates from a receptor occupied by a drug, a concept that has its basis in the law of mass action. The dose-response curve depicts the observed effect of a drug as a function of its concentration in the receptor compartment. Figure 3–2 shows a typical dose-response curve.
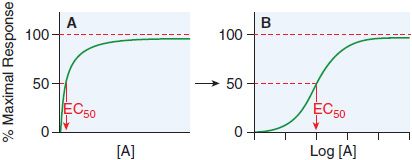
Figure 3–2 Graded responses (y axis as a percentage of maximal response) expressed as a function of the concentration of drug A present at the receptor. The hyperbolic shape of the curve in panel A becomes sigmoid when plotted semi-logarithmically, as in panel B. The concentration of drug that produces 50% of the maximal response quantifies drug activity and is referred to as the EC50 (effective concentration for 50% response). The range of concentrations needed to fully depict the dose-response relationship (~3 log10 [10] units) is too wide to be useful in the linear format of Figure 3–2A; thus, most dose-response curves use log [Drug] on the x axis, as in Figure 3–2B. Dose-response curves presented in this way are sigmoidal in shape and have 3 properties: threshold, slope, and maximal asymptote. These 3 parameters quantitate the activity of the drug.
Some drugs cause low-dose stimulation and high-dose inhibition of response. These U-shaped relationships for some receptor systems are said to display hormesis. Several drug-receptor systems can display this property (e.g., prostaglandins, endothelin, and purinergic and serotonergic agonists), which may be at the root of some drug toxicities.
AFFINITY, EFFICACY, AND POTENCY. In general, the drug-receptor interaction is characterized by (1) binding of drug to receptor and (2) generation of a response in a biological system, as illustrated in Equation 3–1 where the drug or ligand is denoted as L and the inactive receptor as R. The first reaction, the reversible formation of the ligand-receptor complex LR, is governed by the chemical property of affinity.

LR* is produced in proportion to [LR] and leads to a response. This simple relationship illustrates the reliance of the affinity of the ligand (L) with receptor (R) on both the forward or association rate (k+1) and the reverse or dissociation rate (k–1). At any given time, the concentration of ligand-receptor complex [LR] is equal to the product of k+1[L][R], the rate of formation of the bimolecular complex LR, minus the product k–1[LR], the rate dissociation of LR into L and R. At equilibrium (i.e., when δ[LR]/δt = 0), k+1[L][R] = [k–1[LR]. The equilibrium dissociation constant (KD) is then described by ratio of the off and on rate constants (k–1/k+1).
Thus, at equilibrium,
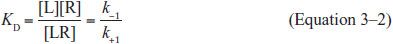
The affinity constant or equilibrium association constant (KA) is the reciprocal of the equilibrium dissociation constant (i.e., KA = 1/KD); thus, a high-affinity drug has a low KD and will bind a greater number of a particular receptor at a low concentration than a low-affinity drug. As a practical matter, the affinity of a drug is influenced most often by changes in its off-rate (k–1) rather than its on-rate (k+1).
Equation 3–2 permits us to write an expression of the fractional occupancy (f) of receptors by agonist:

This can be expressed in terms of KA (or KD) and [L]:
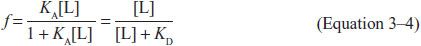
From this relationship, it follows that when the concentration of drug equals the KD (or 1/KA), f = 0.5, that is, the drug will occupy 50% of the receptors. This relationship describes only receptor occupancy, not the eventual response that may be amplified by the cell. Many signaling systems reach a full biological response with only a fraction of receptors occupied.
Potency is defined by example in Figure 3–3. Basically, when 2 drugs produce equivalent responses, the drug whose dose-response curve (plotted as in Figure 3–3A) lies to the left of the other (i.e., the concentration producing a half-maximal effect [EC50] is smaller) is said to be the more potent.
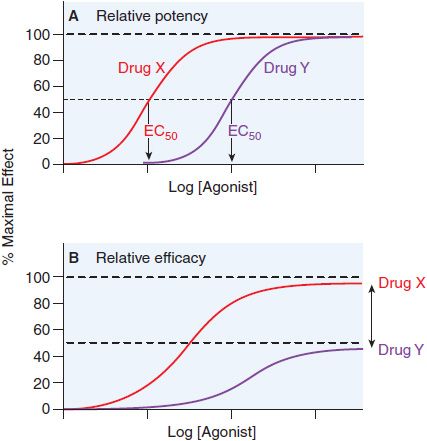
Figure 3–3 Two ways of quantifying agonism. A. The relative potency of 2 agonists (Drug X, red line; Drug Y, purple line) obtained in the same tissue is a function of their relative affinities and intrinsic efficacies. The EC50 of Drug X occurs at a concentration that is one-tenth the EC50 of Drug Y. Thus, Drug X is more potent than Drug Y. B. In systems where the 2 drugs do not both produce the maximal response characteristic of the tissue, the observed maximal response is a nonlinear function of their relative intrinsic efficacies. Drug X is more efficacious than Drug Y; their asymptotic fractional responses are 100% (Drug X) and 50% (Drug Y).
Efficacy reflects the capacity of a drug to activate a receptor and generate a cellular response. Thus, a drug with high efficacy may be a full agonist, eliciting, at some concentration, a full response. A drug with a lower efficacy at the same receptor may not elicit a full response at any dose (see Figure 3–1). A drug with a low intrinsic efficacy will be a partial agonist. A drug that binds to a receptor and exhibits zero efficacy is an antagonist.
QUANTIFYING AGONISM. When the relative potency of 2 agonists of equal efficacy is measured in the same biological system, and downstream signaling events are the same for both drugs, the comparison yields a relative measure of the affinity and efficacy of the 2 agonists (see Figure 3–3). We often describe agonist response by determining the half-maximally effective concentration (EC50) for producing a given effect. We can also compare maximal asymptotes in systems where the agonists do not produce maximal response (Figure 3–3B). The advantage of using maxima is that this property depends solely on efficacy, whereas drug potency is a mixed function of both affinity and efficacy.
QUANTIFYING ANTAGONISM. Characteristic patterns of antagonism are associated with certain mechanisms of blockade of receptors. One is straightforward competitive antagonism, whereby a drug with affinity for a receptor but lacking intrinsic efficacy competes with the agonist for the primary binding site on the receptor. The characteristic pattern of such antagonism is the concentration-dependent production of a parallel shift to the right of the agonist dose-response curve with no change in the maximal response (Figure 3–4A). The magnitude of the rightward shift of the curve depends on the concentration of the antagonist and its affinity for the receptor. A competitive antagonist will reduce the response to zero.
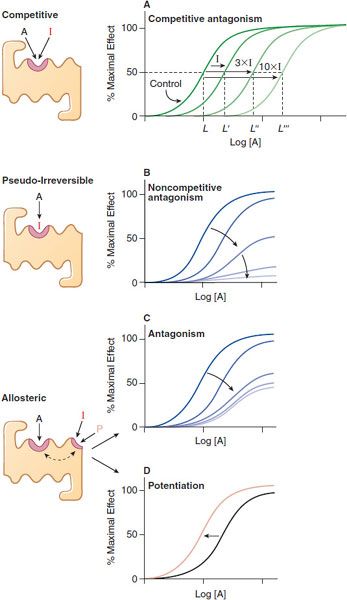
Figure 3–4 Mechanisms of receptor antagonism. A. Competitive antagonism occurs when the agonist A and antagonist I compete for the same binding site on the receptor. Response curves for the agonist are shifted to the right in a concentration-related manner by the antagonist such that the EC50 for the agonist increases (e.g., L versus L′, L″, and L″′) with the concentration of the antagonist. B. If the antagonist binds to the same site as the agonist but does so irreversibly or pseudo-irreversibly (slow dissociation but no covalent bond), it causes a shift of the dose-response curve to the right, with further depression of the maximal response. Allosteric effects occur when an allosteric ligand I or P binds to a different site on the receptor to either inhibit (I) the response (see panel C) or potentiate (P) the response (see panel D). This effect is saturable; inhibition or potentiation reaches a limiting value when the allosteric site is fully occupied.
A partial agonist similarly can compete with a “full” agonist for binding to the receptor. However, increasing concentrations of a partial agonist will inhibit response to a finite level characteristic of the drug’s intrinsic efficacy. Partial agonists may be used therapeutically to buffer a response by inhibiting excessive receptor stimulation without totally abolishing receptor stimulation.
An antagonist may dissociate so slowly from the receptor that its action is exceedingly prolonged. In the presence of a slowly dissociating antagonist, the maximal response to the agonist will be depressed at some antagonist concentrations (Figure 3–4B). Operationally, this is referred to as noncompetitive antagonism, although the molecular mechanism of action cannot be inferred unequivocally from the effect. An irreversible antagonist competing for the same binding site as the agonist can produce the pattern of antagonism shown in Figure 3–4B. Noncompetitive antagonism can be produced by an allosteric or allotopic antagonist, which binds to a site on the receptor distinct from that of the primary agonist, thereby changing the affinity of the receptor for the agonist. In the case of an allosteric antagonist, the affinity of the receptor for the agonist is decreased by the antagonist (Figure 3–4C). In contrast, a drug binding at an allosteric site could potentiate the effects of primary agonists (Figure 3–4D); such a drug would be referred to as an allosteric agonist or co-agonist.
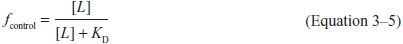
The affinity of a competitive antagonist (Ki) for its receptor can be determined in radioligand binding assays or by measuring the functional response of a system to a drug in the presence of the antagonist. Concentration curves are run with the agonist alone and with the agonist plus an effective concentration of the antagonist (see Figure 3–4A). As more antagonist (I) is added, a higher concentration of the agonist (A) is needed to produce an equivalent response (the half-maximal or 50%, response is a convenient and accurately determined level of response). The extent of the rightward shift of the concentration-dependence curve is a measure of the affinity of the inhibitor, and a higher-affinity inhibitor will cause a greater rightward shift than a lower-affinity inhibitor at the same inhibitor concentration. Using Equations 3–3 and 3–4, one may write mathematical expressions of fractional occupancy (f) of the receptor by agonist for the agonist alone (control) and agonist in the presence of inhibitor.
For the agonist drug (L) alone,
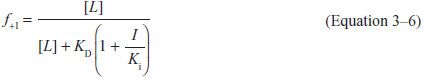
For the case of agonist plus antagonist (I),
Assuming that equal responses result from equal fractional receptor occupancies in both the absence and presence of antagonist, one can set the fractional occupancies equal at agonist concentrations (L and L’) that generate equivalent responses in Figure 3–4A. Thus,
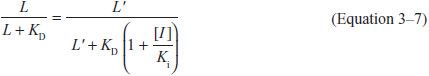
Simplifying, one gets:
where all values are known except Ki. Thus, one can determine the Ki for a reversible, competitive antagonist without knowing the KD for the agonist and without needing to define the precise relationship between receptor and response.
PHARMACODYNAMIC VARIABILITY: INDIVIDUAL AND POPULATION PHARMACODYNAMICS
Individuals vary in the magnitude of their response to the same concentration of a single drug, and a given individual may not always respond in the same way to the same drug concentration. Drug responsiveness may change because of disease or because of previous drug administration. Receptors are dynamic, and their concentration and function may be up- or downregulated by endogenous and exogenous factors.
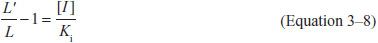
Data on the correlation of drug levels with efficacy and toxicity must be interpreted in the context of the pharmacodynamic variability in the population (e.g., genetics, age, disease, and the presence of coadministered drugs). The variability in pharmacodynamic response in the population may be analyzed by constructing a quantal concentration-effect curve (Figure 3–5A). The dose of a drug required to produce a specified effect in 50% of the population is the median effective dose (ED50; see Figure 3–5A). In preclinical studies of drugs, the median lethal dose (LD50) is determined in experimental animals (Figure 3–5B). The LD50/ED50 ratio is an indication of the therapeutic index, which is a statement of how selective the drug is in producing its desired effects versus its adverse effects. A similar term, the therapeutic window, is the range of steady-state concentrations of drug that provides therapeutic efficacy with minimal toxicity (Figures 2–6 and 3–6). In clinical studies, the dose, or preferably the concentration, of a drug required to produce toxic effects can be compared with the concentration required for therapeutic effects in the population to evaluate the clinical therapeutic index. The concentration or dose of drug required to produce a therapeutic effect in most of the population usually will overlap the concentration required to produce toxicity in some of the population, even though the drug’s therapeutic index in an individual patient may be large. Thus, a population therapeutic window expresses a range of concentrations at which the likelihood of efficacy is high and the probability of adverse effects is low (see Figure 3–6); it does not guarantee efficacy or safety. Therefore, use of the population therapeutic window to adjust dosage of a drug should be complemented by monitoring appropriate clinical and surrogate markers for drug effect(s).
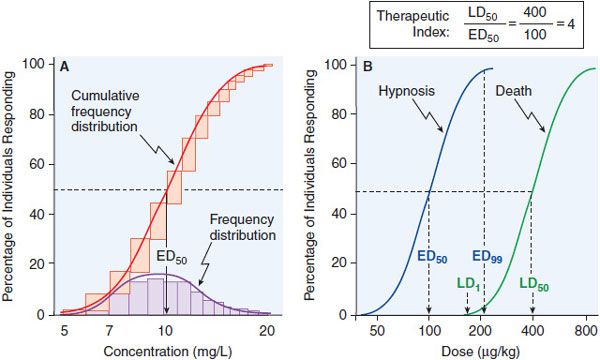
Figure 3–5 Frequency distribution curves and quantal concentration-effect and dose-effect curves. A. Frequency distribution curves. An experiment was performed on 100 subjects, and the effective plasma concentration that produced a quantal response was determined for each individual. The number of subjects who required each dose was plotted, giving a log-normal frequency distribution (purple bars). The normal frequency distribution, when summated, yields the cumulative frequency distribution—a sigmoidal curve that is a quantal concentration-effect curve (red bars, red line). B. Quantal dose-effect curves. Animals were injected with varying doses of a drug and the responses were determined and plotted. The calculation of the therapeutic index, the ratio of the LD50 to the ED50, is an indication of how selective a drug is in producing its desired effects relative to its toxicity. See text for additional explanation.
Figure 3–6 Relation of the therapeutic window of drug concentrations to therapeutic and adverse effects in the population. The ordinate is linear; the abscissa is logarithmic.
Stay updated, free articles. Join our Telegram channel

Full access? Get Clinical Tree


