Other Related Techniques
With the advances in computational resources, there is an increasing urge among the computational researchers to make the in silico approaches fast, convenient, reproducible, acceptable, and sensible ones. Along with the typical two-dimensional (2D) and three-dimensional (3D) quantitative structure–activity relationship (QSAR) methods, approaches like pharmacophore, structure-based docking studies, and combinations of ligand- and structure-based approaches like comparative residue interaction analysis (CoRIA) and comparative binding energy analysis (COMBINE) have gained a significant popularity in the computational drug design process. A pharmacophore can be developed either in a ligand-based method, by superposing a set of active molecules and extracting common chemical features which are vital for their bioactivity; or in a structure-based manner, by probing probable interaction points between the macromolecular target and ligands. The interaction of protein and ligand molecules with each other is one of the interesting studies in modern molecular biology and molecular recognition. This interaction can well be explained with the conceptof a docking study to show how a molecule can bind to another molecule to exert the bioactivity. Docking and pharmacophore are non-QSAR approaches in in silico drug design that can support the QSAR findings. Approaches like CoRIA and COMBINE can use information generated from the ligand–receptor complexes to extract the critical clue concerning the types of significant interaction at the level of both the receptor and the ligand. Employing the abovementioned ligand- and structure-based methodologies and chemical libraries, virtual screening (VS) emerged as an important tool in the quest to develop novel drug compounds. VS serves as an efficient computational tool that integrates structural data with lead optimization as a cost-effective approach to drug discovery.
Keywords
COMBINE; CoRIA; database mining; docking; pharmacophore; virtual screening
10.1 Introduction
Computer-assisted tools in drug design and discovery, with an incredible modernization of computational resources, are very much appreciated throughout the world. Both ligand- and structure-based approaches are increasingly being used for the design of small lead and druglike molecules with anticipated multitarget activities [1]. Various ligand-based methods have been developed for effective and comprehensive application in virtual screening (VS), de novo design, and lead optimization. Pharmacophore has become one of the major ligand-based tools in computational chemistry for the drug research and development process [2]. Again, molecular recognitions, including enzyme–substrate, drug–protein, drug–nucleic acid, protein–nucleic acid, and protein–protein interactions, play significant roles in many biological responses. As a consequence, identification of the binding mode and affinity of the drug molecule is crucial to understanding the underlying mechanism of action in the respective therapeutic response. In this perspective, structure-based drug design is always a front-runner among all the available drug design approaches. Molecular docking is one of the largely acclaimed structure-based approaches, widely used for the study of molecular recognition, which aims to predict the binding mode and binding affinity of a complex formed by two or more constituent molecules with known structures [3].
There are a handful of novel techniques invented in the last decade employing the combined information computed from receptors and ligands. These tools can be defined as a combination of structure- and ligand-based design tools in the evolution of drug discovery techniques. Undoubtedly, methods like comparative binding energy analysis (COMBINE) [4] and comparative residue interaction analysis (CoRIA) [5] are the front-runners in the abovementioned approach with encouraging successful applications in drug discovery.
In silico screening is generally defined as VS, which is used rationally to select compounds for biological in vitro/in vivo testing from chemical libraries and databases of hundreds of thousands of compounds [6]. The VS approach is used for computationally prioritizing drug candidate molecules for future synthesis by using certain filters. The filters may be created by employing knowledge about the protein target (in structure-based VS) or known bioactive ligands (in ligand-based VS). These computational methods are powerful tools, as they supply a straightforward way to estimate the properties of the molecules and establish them as probable drug candidates from a huge number of compounds in no time in a cost-effective way. A combination of bioinformatics and chemoinformatics is crucial to the success of VS of chemical libraries, which is an alternative and complementary approach to high-throughput screening (HTS) in the lead discovery process [7]. Simply stated, the VS attempts to improve the probability of identifying bioactive molecules by maximizing the true positive rate—that is, by ranking the truly active molecules as high as possible.
10.2 Pharmacophore
10.2.1 Concept and definition
One of the most promising in silico concepts of computer-aided drug design (CADD) is that of the pharmacophore. The term pharmacophore was first coined by Paul Ehrlich in the early 1900s, but it was Monty Kier [8,9] who introduced the physical chemical concept of pharmacophore in a series of papers published between 1967 and 1971. The pharmacophore technique in modern drug discovery is extremely useful as an interface between the medicinal chemistry and computational chemistry, both in VS and library design for efficient hit discovery, as well as in the optimization of lead compounds to final drug candidates. Recent research has focused on the practice of parallel screening using pharmacophore models for bioactivity profiling and early-stage risk assessment of probable adverse effects and toxicity due to interaction of drug candidates with antitargets.
The hypothesis of pharmacophore is based on that the molecular recognition of a biological target by a class of compounds can be explained by a set of common features that interact with a set of complementary sites on the biological target [10]. Along with the features, their three-dimensional (3D) relationship with each of the features is another crucial component of the pharmacophore concept. It is closely linked to the widely used principle of bioisosterism, which can be adopted by medicinal chemists while designing bioactive compound series.
The pharmacophore can be simply defined by the following, as stated in the International Union of Pure and Applied Chemistry (IUPAC) definition of the term given in Wermuth et al. [11]:
A pharmacophore is the ensemble of steric and electronic features that is necessary to ensure the optimal supramolecular interactions with a specific biological target structure and to trigger (or to block) its biological response.
A pharmacophore does not represent a real molecule or a real association of functional groups, but a purely abstract concept that accounts for the common molecular interaction capacities of a group of compounds toward their target structure.
A pharmacophore can be considered as the largest common denominator shared by a set of active molecules. This definition discards a misuse often found in the medicinal chemistry literature, which consists of naming as pharmacophores simple chemical functionalities such as guanidines, sulfonamides, or dihydroimidazoles (formerly imidazolines), or typical structural skeletons such as flavones, phenothiazines, prostaglandins, or steroids.
A pharmacophore is defined by pharmacophoric descriptors, including H-bonding, hydrophobic, and electrostatic interaction sites, defined by atoms, ring centers, and virtual points.
The pharmacophore describes the essential steric and electronic, function-determining points necessary for an optimal interaction with a relevant pharmacological target. It can also be thought of as a template, a partial description of a molecule where certain blanks need to be filled. The types of ligand molecules and the size and diversity of the data set have a great impact on the resulting pharmacophore model. Although a pharmacophore model signifies the key interactions between a ligand and its biological target, neither the structure of the target nor its identity is required to construct a handy pharmacophore model. As a consequence, pharmacophore approaches are often considered to be vital when the accessible information is very restricted. For example, when one knows nothing more than the structures of active ligands, a pharmacophore is the answer.
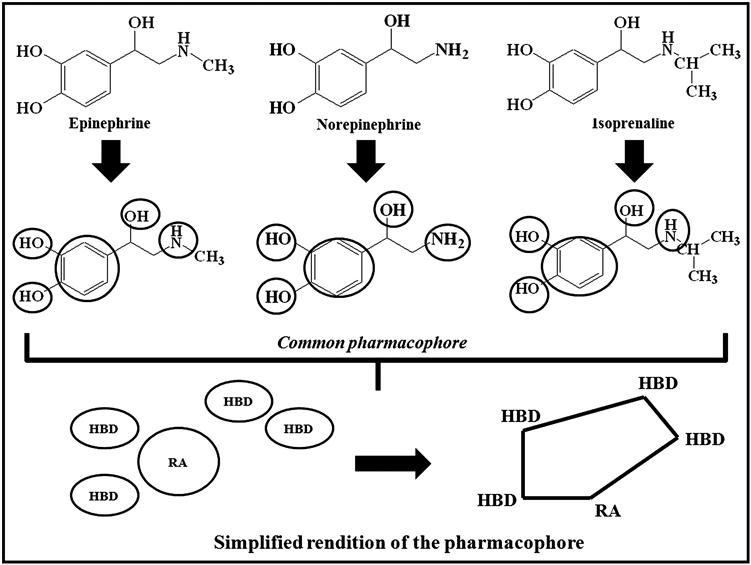
A simple hypothetical example is illustrated to define the common pharmacophores of three well-known compounds (namely, epinephrine, norepinephrine, and isoprenaline) in Figure 10.1.
10.2.2 Background and early days of pharmacophore
Introducing the term pharmacophore in the year 1909, Ehrlich [12], nicknamed the “father of drug discovery,” defined it as “a molecular framework that carries (phoros) the essential features responsible for a drug’s (pharmacon) biological activity.” Although the first definition of the term was credited to Ehrlich, it was Kier who introduced the physical chemical concept in the late 1960s and early 1970s when describing common molecular features of ligands of important central nervous system receptors. This was labeled as “muscarinic pharmacophore” by Kier [8,9].
In the past, pharmacophore models were mainly worked out manually, assisted through the use of simple interactive molecular graphics visualization programs. Later, the growing complexities of molecular structures required refined computer programs for the determination and use of pharmacophore models. In the evolution of computational chemistry, the fundamental perception of a pharmacophore model as a simple geometric depiction of the key molecular interactions remains unchanged. With the advances in computational chemistry in the past 20 years, a variety of automated tools for pharmacophore modeling and applications emerged. A considerable number of studies have been carried out since the development of the pharmacophore approach [13]. Pharmacophore approaches have been used comprehensively in VS, de novo design, as well as in lead optimization and multitarget drug design [14].
10.2.3 Methodology of pharmacophore mapping
10.2.3.1 Diverse conformation generation
Conformational expansion is the most critical step, since the goal is not only to have the most representative coverage of the conformational space of a molecule, but also to have either the bioactive conformation as part of the set of generated conformations or at least a cluster of conformations that are close enough to the bioactive conformation. This conformational search can be divided into four categories: (i) systematic search in the torsional space, (ii) clustering (if wanted or needed), (iii) stochastic methods, such as Monte Carlo (MC), sampling, and Poling, and (iv) molecular dynamics [15]. Commonly employed conformational search methods are BEST, FAST, and conformer algorithms based on energy screening and recursive buildup (CAESAR) [16], all of which generate conformations that provide broad coverage of the accessible conformational space. The FAST conformation generation method searches conformations only in the torsion space and takes less time. The BEST method provides a complete and improved coverage of conformational space by performing a rigorous energy minimization and optimizing the conformations in both torsional and Cartesian space using the Poling algorithm. CAESAR is based on a divide-and-conquer and recursive conformation approach. This approach is also combined in cases of local rotational symmetry so that conformation duplicates due to topological symmetry in a systematic search can be efficiently eliminated.
10.2.3.2 Generation of 3D pharmacophore
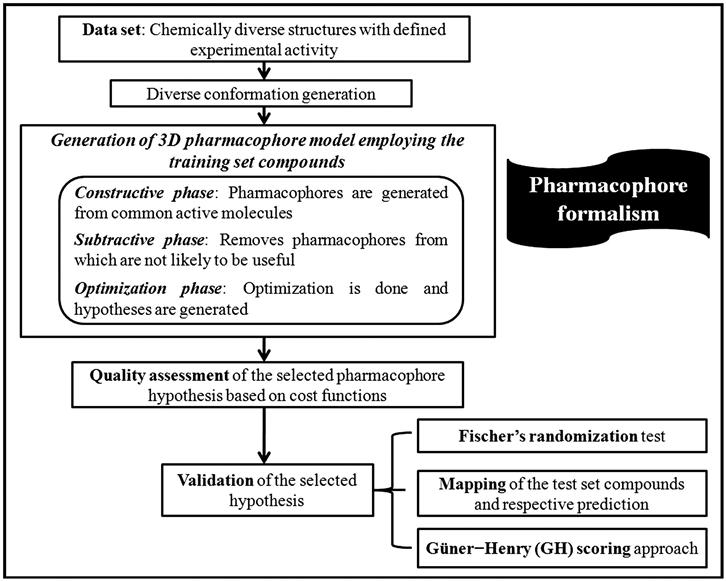
The next step is three-dimensional (3D) pharmacophore generation, where Hypogen and HipHop are the two most commonly used algorithms [17,18]. Predictive 3D pharmacophores are generated in three phases: a constructive, a subtractive, and an optimization phase, as follows:
Constructive phase: HipHop is intended to derive common feature hypothesis-based pharmacophore models using information from a set of active compounds. HipHop does not require the selection of a template; rather, each molecule is treated as a template in turn. Different configurations of chemical features are identified in the template molecule using a pruned exhaustive search, which starts with small sets of features and then extends until no larger configuration is found. Next, each configuration is compared with the remaining molecules to identify configurations that are common to all molecules. The resulting pharmacophores are ranked using a combination of how well the molecules in the training set map onto the pharmacophore model. In HipHop, the user can define how many molecules must map completely or partially to a pharmacophore configuration. Again, HypoGen [18] is an algorithm that uses the activity values of the small compounds in the training set to generate hypotheses to build 3D pharmacophore models. HypoGen identifies all allowable pharmacophores consisting of up to five features among the two most active compounds and investigates the remaining active compounds in the list.
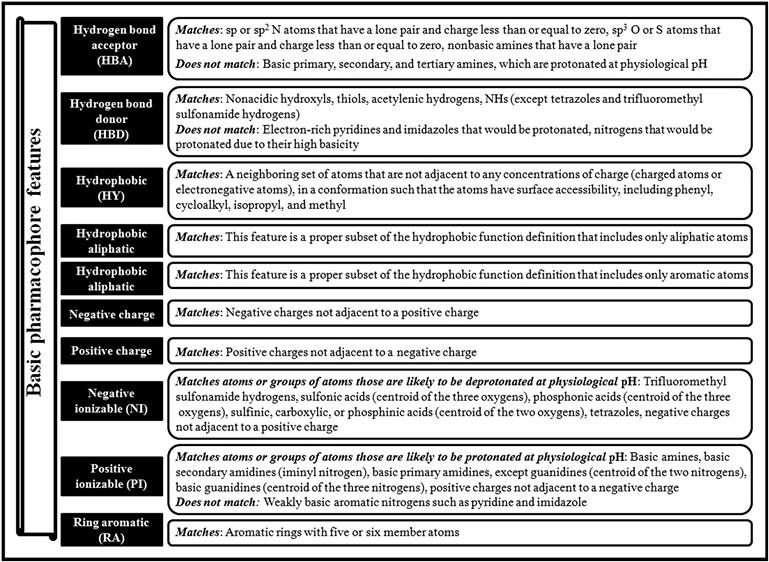
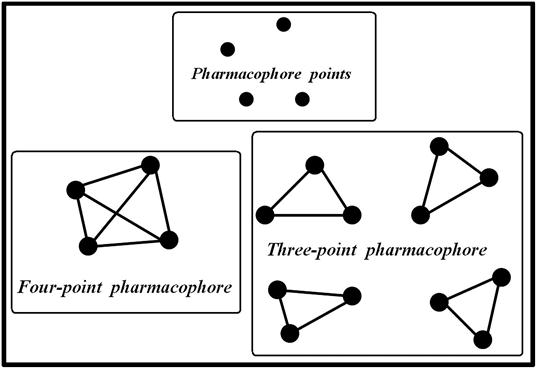
The basic pharmacophore features are illustrated in Figure 10.2. Pharmacophore models are usually labeled based on the number of features. For example, pharmacophore models consisting of three and four features are termed as three-point pharmacophore and four-point pharmacophore, respectively. A simple graphical representation is shown in Figure 10.3.
10.2.3.3 Assessment of the quality of pharmacophore hypotheses
The HypoGen module performs a fixed cost calculation that represents the simple model that fits all the data, and a null cost calculation that assumes that there is no relationship in the data set and that the experimental activities are normally distributed about their average value. A small range of the total hypothesis cost obtained for each of the hypotheses indicates homogeneity of the corresponding hypothesis, and the training set selected for the purpose of pharmacophore generation is adequate. Again, values of total cost close to those of fixed cost indicate the fact that the hypotheses generated are statistically robust [19,20]. The total cost of a hypothesis is calculated as per Eq. (10.1):
 (10.1)
 where e, w, and c are the coefficients associated with the error (E), weight (W), and configuration (C) components, respectively. The other two important costs involved are the fixed cost and null cost. The fixed cost represents the simplest model that perfectly fits the data and is calculated by Eq. (10.2):
 (10.2)
 where x is the deviation from the expected values of weight and error. The null cost is the cost of a pharmacophore when the activity data of every molecule in the training set is the average value of all activities in the set and the pharmacophore has no features. Therefore, the contribution from the weight or configuration component does not apply. The null cost is calculated as per Eq. (10.3):
 (10.3)
 where χest is the averaged scaled activity of the training set molecules. It has been suggested that the differences between cost of the generated hypothesis and the null hypothesis should be as large as possible; a value of 40–60 bits difference may indicate that it has a 75–90% chance of representing a true correlation in the data set used. The total cost of any hypothesis should be toward the value of fixed cost to represent any meaningful model. Two other very important output parameters are the configuration cost and the error cost. Any value of configuration cost higher than 17 may indicate that the correlation from any generated pharmacophore is most likely due to chance. The error cost increases as the value of the root mean square (RMS) increases. The RMS deviations (RMSDs) represent the quality of the correlation between the estimated and the actual activity data.
10.2.3.4 Validation of the pharmacophore model
The pharmacophore models selected based on the acceptable correlation coefficient (R) and cost analysis, should be validated in three subsequent steps: (i) Fischer’s randomization test, (ii) test set prediction, and (iii) Güner–Henry (GH) scoring method.
Fischer’s randomization test: First, cross-validation is performed and statistical significance of the structure–activity correlation is estimated by randomizing the data using the Fischer’s randomization test [20]. This is done by scrambling the activity data of the training set molecules and assigning them new values, followed by the generation of pharmacophore hypotheses using the same features and parameters as those used to develop the original pharmacophore hypothesis. The original hypothesis is considered to be generated by mere chance if the randomized data set results in the generation of a pharmacophore with better or nearly equal correlation compared to the original one.
Test set prediction: The purpose of the pharmacophore hypothesis generation is not only to predict the activity of the training set compounds [21], but also to predict the activities of external molecules. With the objective of verifying whether the pharmacophore is able to predict the activity of test set molecules in agreement with the experimentally determined value, the activities of the test set molecules are estimated based on the mapping of the test set molecules to the developed pharmacophore model. The conformers are generated for the test set molecules based on the method that is used during the conformer generation of the training set, and they are mapped using the corresponding pharmacophore models. Thus, the predictive capacity of the models is judged based on the predictive R2 values ( with a threshold value of 0.5) or classification-based methods (such as sensitivity, specificity, precision, and accuracy). The test set should cover similar structural diversity as the training set in order to establish the broadness of the pharmacophore predictability.
GH scoring: The GH scoring method is employed following test set validation to evaluate the quality of the pharmacophore models [22–24]. The GH score can be successfully applied to quantify model selectivity precision of hits and the recall of actives from a directory of useful decoys (DUD) data set [25] consisting of known actives and inactives. The DUD is a publicly available database for free use, generated based on the observation that physical characteristics of the decoy background can be used for the classification of different compounds. The DUD can be downloaded from http://dud.docking.org.
The method involves evaluation of the following: the percent yield of actives in a database (%Y, recall), the percent ratio of actives in the hit list (%A, precision), the enrichment factor E, and the GH score. The GH score ranges from 0 to 1, where a value of 1 signifies the ideal model. The following are the metrics used for analyzing hit lists by a pharmacophore model–based database search:
 (10.4)
  (10.5)
  (10.6)
  (10.7)
 In these equations, %A is the percentage of known active compounds retrieved from the database (precision); Ha is the number of actives in the hit list (true positives); A is the number of active compounds in the database; %Y is the percentage of known actives in the hit list (recall); Ht is the number of hits retrieved; D is the number of compounds in the database; and E is the enrichment of the concentration of actives by the model relative to random screening without any pharmacophoric approach.
The basic steps of pharmacophore formalism are represented in Figure 10.4.
10.2.4 Types of pharmacophore
A pharmacophore model can be generated in two ways. The first method is ligand-based modeling, where a set of active molecules are superimposed and common chemical features are extracted that are necessary for their bioactivity; the second is structure-based modeling performed by probing possible interaction points between the macromolecular target and ligands.
10.2.4.1 Ligand-based pharmacophore modeling
Ligand-based pharmacophore (LBP) modeling has become an important computational tool for assisting drug discovery in the case of nonavailability of a macromolecular target structure [26,27]. The LBP is usually carried out by extracting common chemical features from the 3D structures of a known set of ligands representative of fundamental interactions between the ligands and a specific macromolecular target. In the case of LBP modeling, pharmacophore generation from multiple ligands involves two major steps: First, creation of the conformational space for each ligand in the training set to represent conformational flexibility of the ligands and to align the multiple ligands in the training set, and second, determination of the essential common chemical features to build the pharmacophore model. The conformational analysis of ligands and performing molecular alignment are the key techniques as well as the main complexities in any LBP modeling.
A few challenges still exist in spite of the great advances of LBP modeling:
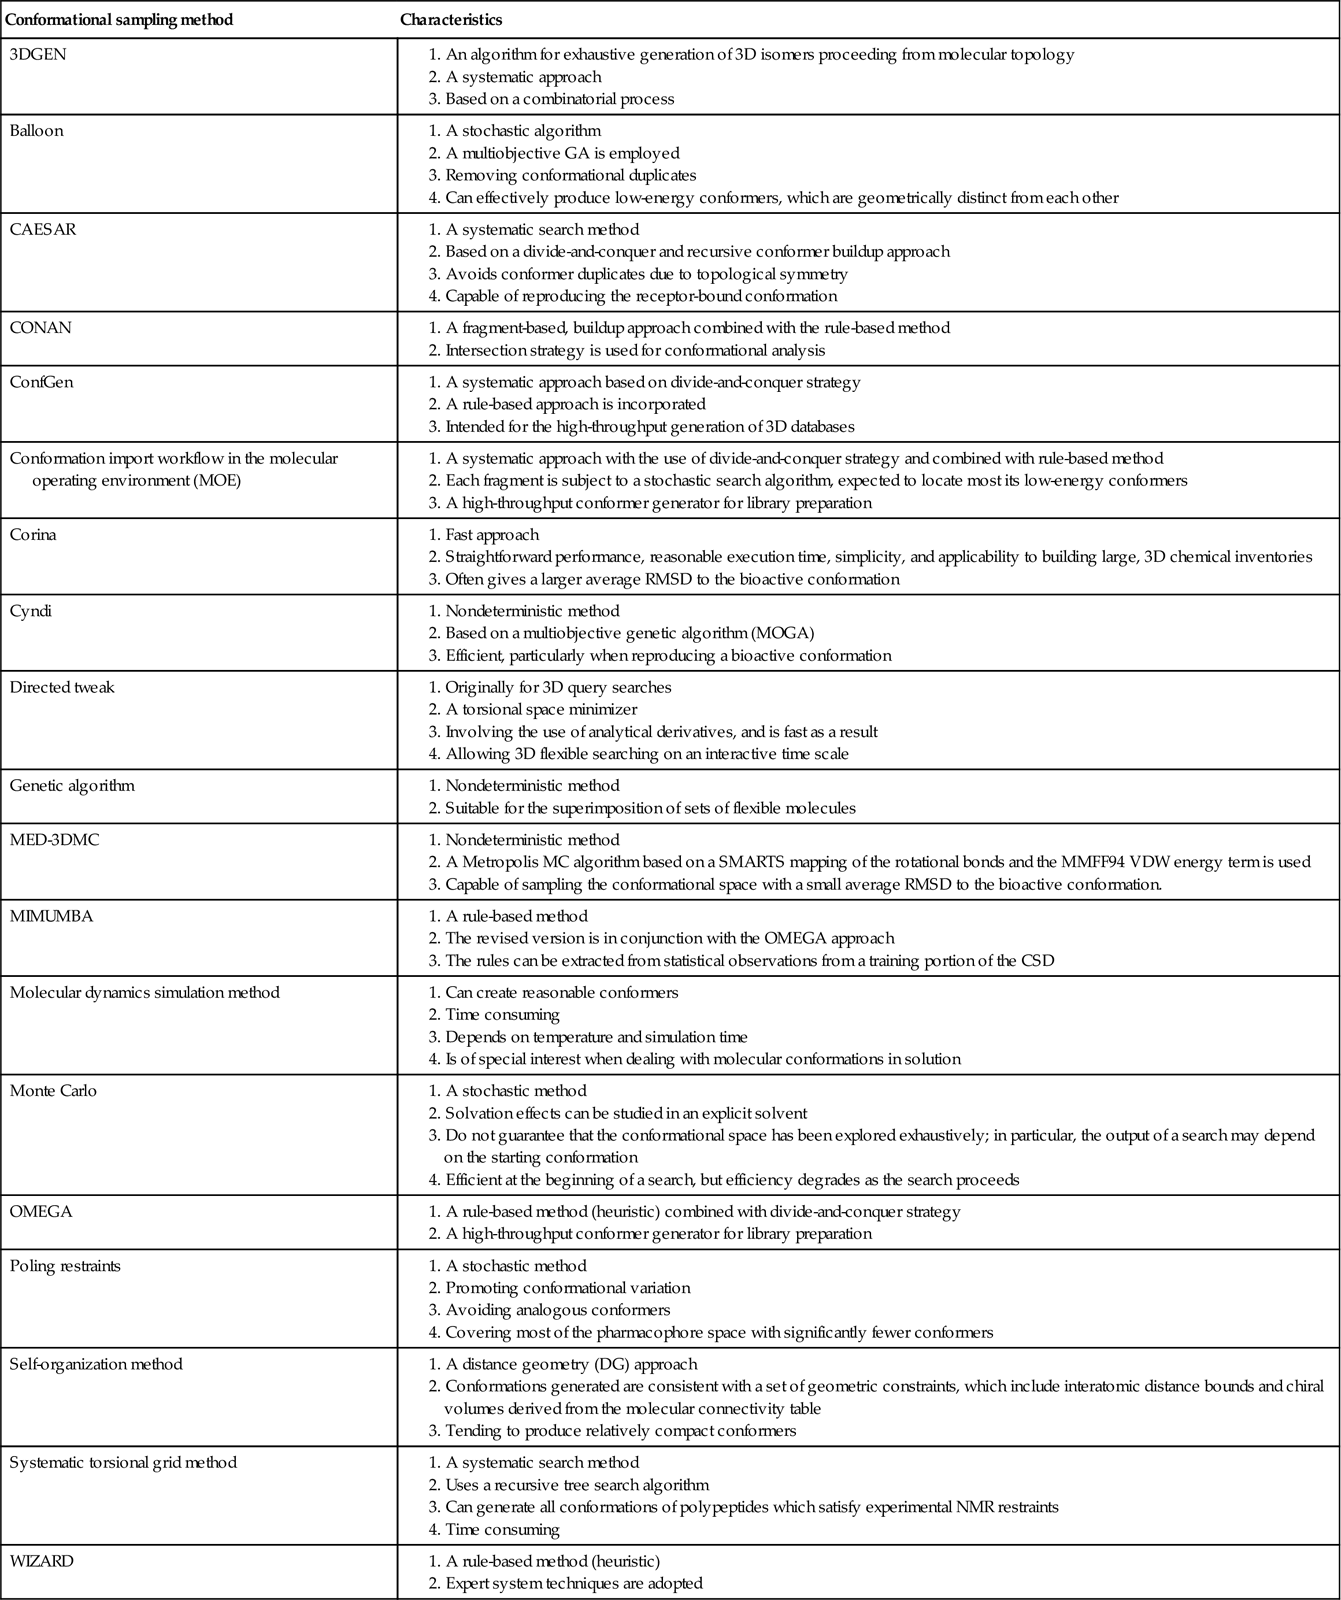
a. The first problem, and one of the most serious, is the modeling of ligand flexibility. Presently, two strategies are utilized to deal with this problem. The first is the preenumerating method, in which multiple conformations for each ligand are precomputed and saved in a database [28]. The advantage of this approach is lower computing cost for conducting molecular alignment at the expense of a possible need for a mass storage capacity. The second approach is the on-the-fly method, in which the conformation analysis is carried out in the pharmacophore modeling process [28]. This approach does not need mass storage but might need higher central processing unit (CPU) time for conducting meticulous optimization. It has been demonstrated that the preenumerating method outperforms the on-the-fly calculation approach [29]. Recently, a considerable number of advanced algorithms [14] have been established to sample the conformational spaces of small molecules, which are listed in Table 10.1.
Most importantly, a good conformation generator should ensure the following conditions: (i) proficiently generating all the putative bound conformations that small molecules adopt when they interact with macromolecules, (ii) keeping the list of low-energy conformations as short as possible to avoid the combinational explosion problem, and (iii) being less time consuming for the conformational calculations.
b. Molecular alignment is the second issue of concern in LBP modeling. The alignment methods can be classified into two approaches in terms of their elementary nature: point-based and property-based [29]. The points of the point-based method can be further discriminated as atoms, fragments, or chemical features [30]. In the point-based algorithms, pairs of atoms, fragments, or chemical feature points are usually superimposed employing a least-squares fitting. The major disadvantage of this approach is the requirement for predefined anchor points because the generation of these points can become problematic in the case of different ligands. Consequently, the property-based algorithms utilize molecular field descriptors, generally represented by sets of Gaussian functions, to generate alignments. Recently, new alignment methods have been developed, including stochastic proximity embedding [31], atomic property fields [32], fuzzy pattern recognition [33], and grid-based interaction energies [34].
c. The third challenge lies in the appropriate selection of training set compounds. Although this problem is simple and nontechnical, but it often puzzles researchers nonetheless. The type of ligand molecules, the size of the data set, and its chemical diversity largely affect considerably the final generated pharmacophore model [28].
Table 10.1
Various conformational sampling methods
10.2.4.2 Structure-based pharmacophore modeling
Structure-based pharmacophore (SBP) modeling is directly dependent on the 3D structures of macromolecular targets or macromolecule–ligand complexes. As the number of experimentally determined 3D structure of targets has grown to a very large number, SBP methods have attracted significant interest in the last decade. The approach is considered as the complementary one to the docking procedures, providing the same level of information as well as less demanding with respect to required computational resources. The protocol of SBP modeling involves analyzing the complementary chemical features of the active site and their spatial relationships, and developing a pharmacophore model assembly with selected features [2].
SBP modeling can be further classified into two subclasses: macromolecule–ligand–complex based and macromolecule (without ligand) based. The macromolecule–ligand–complex-based approach is suitable in identifying the ligand binding site of the macromolecular target and determining the key interaction points between ligands and the target protein. LigandScout [35] is an excellent software program that incorporates the macromolecule–ligand–complex-based scheme. Programs like Pocket v.2 [36] and GBPM [37] are based on the same approach. The major limitation of this process is the requirement for the 3D structure of the macromolecule–ligand complex. As a consequence, it cannot be applied to cases when no ligands targeting the binding site of interest are known. This can be solved by the macromolecule-based approach. The SBP method implemented in the Discovery Studio software [18] is a typical example of a macromolecule-based approach [38].
The most commonly encountered difficulty for SBP modeling is the identification of too many chemical features for a specific binding site of the macromolecular target. A pharmacophore model consisting of too many chemical features (e.g., more than seven) is not appropriate for practical applications (e.g., 3D database screening). Therefore, it is always important to pick a restricted number of chemical features (usually three to seven) to create a reliable pharmacophore hypothesis. One more significant drawback is that the obtained pharmacophore hypothesis cannot replicate the quantitative structure–activity relationship (QSAR) because the model is generated based just on a single macromolecule–ligand complex or a single macromolecule.
10.2.5 Application of pharmacophore models
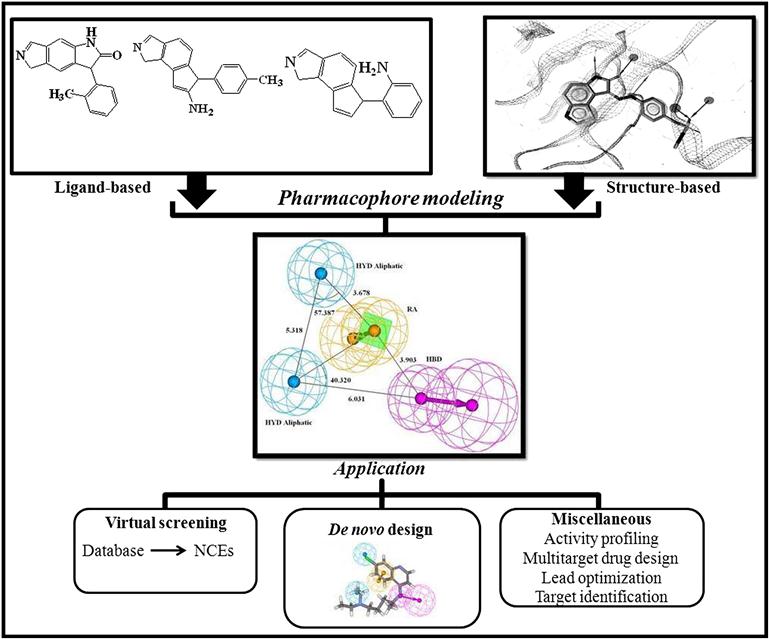
Enrichment in the pharmacophore techniques in the last two decades has made the approach one of the most significant tools in drug discovery. In spite of the advances in key techniques of pharmacophore modeling, there is space for additional improvement to derive more precise and best possible pharmacophore models, which include better handling of ligand flexibility, proficient molecular alignment algorithms, and more precise model optimization. Along with the pharmacophore-based VS and de novo design, the applications of pharmacophore have been extended to lead optimization [39], multitarget drug design [40], activity profiling [41], and target identification [42]. Application of the pharmacophore technique is demonstrated in a schematic way in Figure 10.5.
10.2.5.1 Pharmacophore model–based VS
Pharmacophore models can be used for querying the 3D chemical database to search for potential ligands; this process is termed pharmacophore-based VS. In the case of the pharmacophore-based VS approach, a pharmacophore hypothesis is taken as a template. The intention behind the screening is actually to discover such hits that have chemical features similar to those of the template. Sometimes these hits might be related to known active compounds, but few have completely novel scaffolds. The screening process involves two major difficulties: handling the conformational flexibility of small molecules and pharmacophore pattern identification.
The flexibility of small molecules is handled either by preenumerating multiple conformations for each molecule or conformational sampling at search time. Pharmacophore pattern identification, usually known as substructure searching, is performed to check whether a query pharmacophore is present in a given conformer of a molecule. The commonly used approaches for substructure searching are Ullmann [43], the backtracking algorithm [44], and the Generic Match Algorithm (GMA) [45].
The most challenging problem for pharmacophore-based VS is that few percentages of the virtual hits are really bioactive. In simpler words, the screening results produce a higher false-positive rate, a higher false-negative rate, or both. Many factors like the quality and composition of the pharmacophore model and the macromolecular target information can contribute to this problem. The most probable factors are as follows:
c. The flexibility of target macromolecule in pharmacophore approaches is handled by introducing a tolerance radius for each pharmacophoric feature, which is unlikely to entirely account for macromolecular flexibility in some cases. Recent attempts [46] to integrate molecular dynamics simulation (MDS) into pharmacophore modeling have recommended that the pharmacophore models generated from MDS trajectories explain the considerably enhanced representation of the flexibility of pharmacophores.
10.2.5.2 Pharmacophore-based de novo design
Another vital application of pharmacophore is de novo design of ligands. In the case of pharmacophore-based VS, the obtained compounds are generally existing chemicals that might be patent protected. On the contrary, the de novo design approach can be used to generate entirely novel candidate structures that match to the requirements of a given pharmacophore. The first pharmacophore-based de novo design program is NEWLEAD [47]. It uses a set of disconnected molecular fragments that are consistent with a pharmacophore model as input. The selected sets of disconnected pharmacophore fragments are subsequently connected by using various linkers (such as atoms, chains, or ring moieties).
The limitation with NEWLEAD is that it can only handle cases in which the pharmacophore features are functional groups (not typical chemical features). The additional inadequacy of the NEWLEAD program is that the sterically illicit region of the binding site is not considered. As a result, the compounds created by the NEWLEAD program might be tricky to chemically synthesize. There are programs like LUDI [10] and BUILDER [48] that can also be used to amalgamate identification of SBP with de novo design. Both programs require knowledge of the 3D structures of the macromolecular targets.
More recently, a program called PhDD (a pharmacophore-based de novo design method of druglike molecules) has been designed by Huang et al. [49], to overcome the limitations of the present pharmacophore-based, de novo design software tools. PhDD can involuntarily create druglike compounds that satisfy the necessities of an input pharmacophore hypothesis. The pharmacophore used in PhDD can be consisted of a set of abstract chemical features and excluded volumes which are the sterically forbidden region of the binding site. In the case of PhDD, it first generates a set of new molecules that entirely conform to the requirements of the given pharmacophore model. Thereafter, a series of evaluation to the generated molecules are carried out, including the assessments of drug-likeness, bioactivity, and synthetic convenience.
10.2.6 Advantages and limitations of pharmacophore
Like any other approach, pharmacophore has both advantages and disadvantages. The major advantages and limitations are as follows:
• Pharmacophore models can be used for VS on a large database.
• It can be used for the design, optimization of drugs, and scaffolds hopping.
• It can conceptually be obtained even for 2D structural representation.
• 2D pharmacophore is faster but less accurate than 3D pharmacophore.
10.2.7 Software tools for pharmacophore analysis
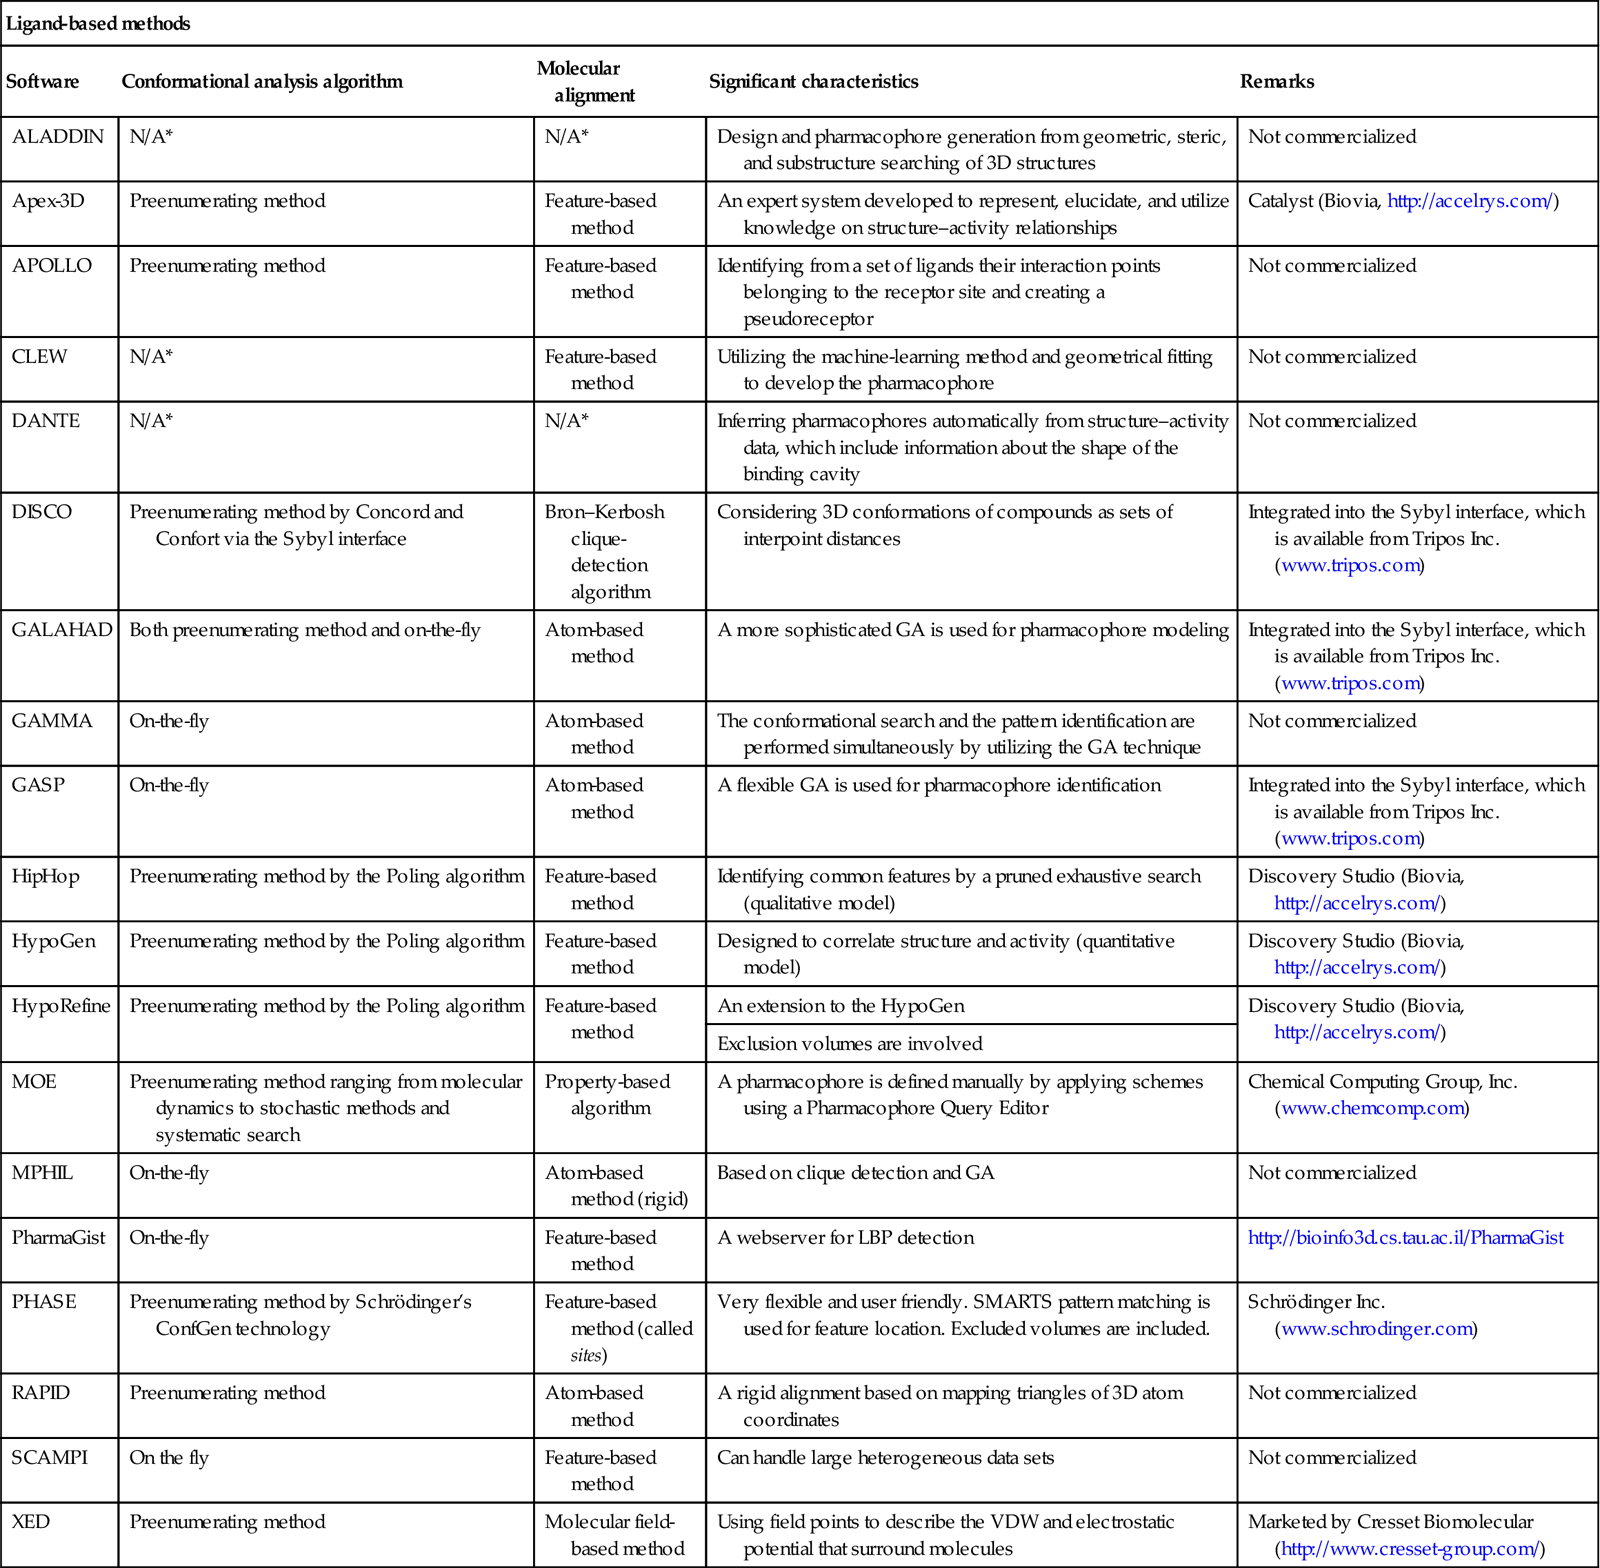
Pharmacophore modeling is extensively used because of its immense accessibility through commercial software packages. Also, there is a freely available web server called PharmaGist (http://bioinfo3d.cs.tau.ac.il/PharmaGist/) for detecting a pharmacophore from a group of ligands known to bind to a particular target. A complete list of different commercialized and freely available software and program modules [19,35–38]) used for pharmacophore modeling is given in Table 10.2.
Table 10.2
Software and programs for pharmacophore modeling
| Ligand-based methods | ||||
| Software | Conformational analysis algorithm | Molecular alignment | Significant characteristics | Remarks |
| ALADDIN | N/A* | N/A* | Design and pharmacophore generation from geometric, steric, and substructure searching of 3D structures | Not commercialized |
| Apex-3D | Preenumerating method | Feature-based method | An expert system developed to represent, elucidate, and utilize knowledge on structure–activity relationships | Catalyst (Biovia, http://accelrys.com/) |
| APOLLO | Preenumerating method | Feature-based method | Identifying from a set of ligands their interaction points belonging to the receptor site and creating a pseudoreceptor | Not commercialized |
| CLEW | N/A* | Feature-based method | Utilizing the machine-learning method and geometrical fitting to develop the pharmacophore | Not commercialized |
| DANTE | N/A* | N/A* | Inferring pharmacophores automatically from structure–activity data, which include information about the shape of the binding cavity | Not commercialized |
| DISCO | Preenumerating method by Concord and Confort via the Sybyl interface | Bron–Kerbosh clique-detection algorithm | Considering 3D conformations of compounds as sets of interpoint distances | Integrated into the Sybyl interface, which is available from Tripos Inc. (www.tripos.com) |
| GALAHAD | Both preenumerating method and on-the-fly | Atom-based method | A more sophisticated GA is used for pharmacophore modeling | Integrated into the Sybyl interface, which is available from Tripos Inc. (www.tripos.com) |
| GAMMA | On-the-fly | Atom-based method | The conformational search and the pattern identification are performed simultaneously by utilizing the GA technique | Not commercialized |
| GASP | On-the-fly | Atom-based method | A flexible GA is used for pharmacophore identification | Integrated into the Sybyl interface, which is available from Tripos Inc. (www.tripos.com) |
| HipHop | Preenumerating method by the Poling algorithm | Feature-based method | Identifying common features by a pruned exhaustive search (qualitative model) | Discovery Studio (Biovia, http://accelrys.com/) |
| HypoGen | Preenumerating method by the Poling algorithm | Feature-based method | Designed to correlate structure and activity (quantitative model) | Discovery Studio (Biovia, http://accelrys.com/) |
| HypoRefine | Preenumerating method by the Poling algorithm | Feature-based method | An extension to the HypoGen | Discovery Studio (Biovia, http://accelrys.com/) |
| Exclusion volumes are involved | ||||
| MOE | Preenumerating method ranging from molecular dynamics to stochastic methods and systematic search | Property-based algorithm | A pharmacophore is defined manually by applying schemes using a Pharmacophore Query Editor | Chemical Computing Group, Inc. (www.chemcomp.com) |
| MPHIL | On-the-fly | Atom-based method (rigid) | Based on clique detection and GA | Not commercialized |
| PharmaGist | On-the-fly | Feature-based method | A webserver for LBP detection | http://bioinfo3d.cs.tau.ac.il/PharmaGist |
| PHASE | Preenumerating method by Schrödinger’s ConfGen technology | Feature-based method (called sites) | Very flexible and user friendly. SMARTS pattern matching is used for feature location. Excluded volumes are included. | Schrödinger Inc. (www.schrodinger.com) |
| RAPID | Preenumerating method | Atom-based method | A rigid alignment based on mapping triangles of 3D atom coordinates | Not commercialized |
| SCAMPI | On the fly | Feature-based method | Can handle large heterogeneous data sets | Not commercialized |
| XED | Preenumerating method | Molecular field-based method | Using field points to describe the VDW and electrostatic potential that surround molecules | Marketed by Cresset Biomolecular (http://www.cresset-group.com/) |
| Structure-based methods | |||
| Software | Molecular alignment | Significant characteristics | Remarks |
| GBPM | Complex-based | Based on logical and clustering operations with 3D maps computed by the GRID program on structurally known molecular complexes. Particularly suitable for identifying protein–protein interaction areas. | Not commercialized |
| LigandScout | Complex-based | Incorporating a complete definition of 3D chemical features. Pharmacophoric feature points-based pattern-matching alignment algorithm is used. Intuitive and easy to use. | Marketed by Inte:Ligand (www.inteligand.com/ligandscout/) |
| Pocket v.2 | Complex-based | Capable to generate a pharmacophore model with a rational number of features when one complex structure is available. | Not commercialized |
| SBP | Apoprotein-based | Directly converting LUDI interaction maps within the protein binding site into Catalyst pharmacophoric features. | Discovery Studio (Biovia, http://accelrys.com/) |

N/A*: Not applicable or the exact information is not available.
10.3 Structure-Based Design–Docking
10.3.1 Concept and definition of docking
Molecular docking is the study of how two or more molecular structures (e.g., drug and enzyme or protein) fit together [50]. In a simple definition, docking is a molecular modeling technique that is used to predict how a protein (enzyme) interacts with small molecules (ligands). The ability of a protein (enzyme) and nucleic acid to interact with small molecules to form a supramolecular complex plays a major role in the dynamics of the protein, which may enhance or inhibit its biological function. The behavior of small molecules in the binding pockets of target proteins can be described by molecular docking. The method aims to identify correct poses of ligands in the binding pocket of a protein and to predict the affinity between the ligand and the protein. Based on the types of ligand, docking can be classified as
Protein–small molecule (ligand) docking represents a simpler end of the complexity spectrum, and there are many available programs that perform particularly well in predicting molecules that may potentially inhibit proteins. Protein–protein docking is typically much more complex. The reason is that proteins are flexible and their conformational space is quite vast.
Docking can be performed by placing the rigid molecules or fragments into the protein’s active site using different approaches like clique-searching, geometric hashing, or pose clustering. The performance of docking depends on the search algorithm [e.g., MC methods, genetic algorithms (GAs), fragment-based methods, Tabu searches, distance geometry methods, and the scoring functions like force field (FF) methods and empirical free energy scoring functions]. The first step of docking is the generation of composition of all possible conformations and orientations of the protein paired with the ligand. The second step is that the scoring function takes input and returns a number indicating favorable interaction [51].
To identify the active site of the protein, first, selection of the required X-ray cocrystallized structure from the protein data bank (PDB) is performed, and then extracting the bound ligand, one can optimize the protein active site of interest. But the process of identification of the active site in a protein is critical when the bound ligand is absent in the crystal structure. In that case, one has to do the following procedures:
Stay updated, free articles. Join our Telegram channel

Full access? Get Clinical Tree


