Introduction to 3D-QSAR
With the advancement of computational resources, there is a gradual uplifting of the used dimensions of quantitative structure–activity relationship (QSAR) descriptors. The two-dimensional (2D) and lower-dimensional models suffer from various drawbacks that led to the introduction of 3D-QSAR. This approach has been enhanced with significant advancements in order to study multiple three-dimensional (3D) features of chemicals, establishing a correlation between structure and biological activity. The 3D-QSAR techniques are broadly divided into alignment-based methods [comparative molecular field analysis (CoMFA), self-organizing molecular field analysis (SOMFA), comparative molecular similarity indices analysis (CoMSIA), receptor surface analysis (RSA), and molecular shape analysis (MSA)] and alignment-independent methods [comparative molecular moment analysis (CoMMA), weighted holistic invariant molecular (WHIM) descriptor analysis, VolSurf, Compass, comparative spectral analysis (CoSA), grid-independent descriptors (GRIND)]. The fundamental concept, methodology, and limitations of some of the major approaches are discussed in this chapter to give an overview of this topic.
Keywords
3D-QSAR; comparative molecular field analysis (CoMFA); comparative molecular moment analysis (CoMMA); comparative molecular similarity indices analysis (CoMSIA); comparative spectral analysis (CoSA); molecular shape analysis (MSA); receptor surface analysis (RSA); self-organizing molecular field analysis (SOMFA); weighted holistic invariant molecular (WHIM)
8.1 Introduction
The basic principle of a quantitative structure–activity relationship (QSAR) study is that the deviations in biological response among a series of compounds are accountable for the differences in the structural properties. In the classical QSAR studies, biological responses have been correlated with atomic, group, or molecular properties such as lipophilicity, polarizability, electronic, and steric properties (Hansch analysis) or with certain structural features (Free–Wilson analysis). However, in these techniques, one cannot ignore their limited utility for designing diverse functional new molecules due to the lack of consideration of the three-dimensional (3D) structures of the molecules. As a consequence, 3D-QSAR has emerged as a natural extension to the classical Hansch and Free–Wilson approaches that exploits the 3D properties of the ligands to predict their biological response by employing robust chemometric tools. The 3D-QSAR is a broad term encompassing all those QSAR methods that correlate macroscopic target properties with computed atom-based descriptors derived from the spatial representation of the molecular structures. These approaches have served as a valuable predictive tool in the design of pharmaceuticals and agrochemicals [1–3].
The prime goal of any 3D-QSAR method is to establish the relationship between biological activity and spatial properties of chemicals like steric, electrostatic, and lipophilic ones. The 3D-QSAR methodology is computationally more exhaustive and complex than 2D-QSAR approaches. Normally, it consists of several steps to acquire numerical descriptors from the compound structures:
2. An alignment of the conformers in the data set has to be generated in 3D-space.
3. The space with an immersed conformer is probed computationally for generating various descriptors.
It is interesting to point out that some methods, independent of the alignment strategy, have also been developed with the progress of 3D-QSAR approaches [4].
One has to understand that the QSAR model is not a substitute for the experimental assays, although experimental techniques are also not free of inaccuracies. However, QSAR researchers are trying to develop a model that is as close as possible to the real one, and for this purpose, the 3D-QSAR techniques have to rely on some basic assumptions, which are illustrated here:
• The geometry of the receptor binding site is considered rigid, though there are a few exceptions.
• The protein binding site is assumed to be the same for all of the studied ligands.
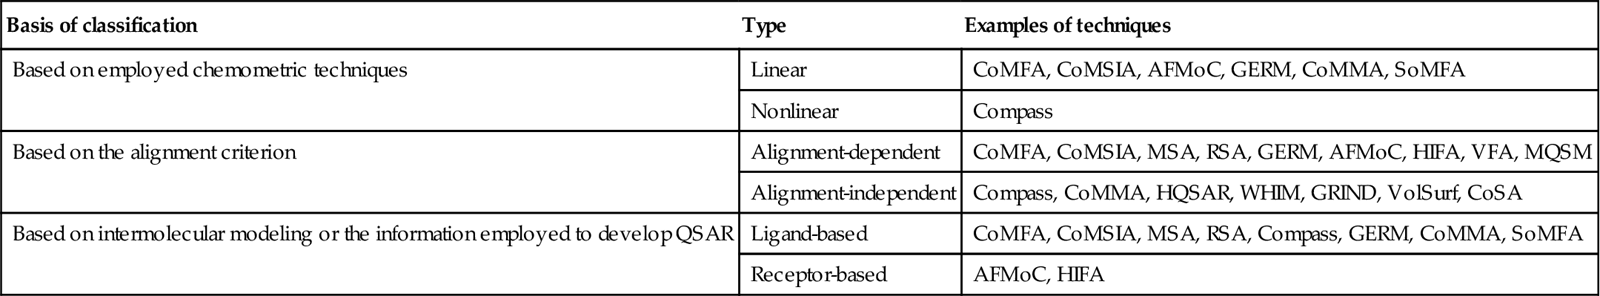
The 3D-QSAR methods can be classified based on a variety of criteria, as given in Table 8.1. Most commonly and successfully employed 3D-QSAR methods are discussed in the following sections of this chapter.
Table 8.1
Categorization of 3D-QSAR techniques
| Basis of classification | Type | Examples of techniques |
| Based on employed chemometric techniques | Linear | CoMFA, CoMSIA, AFMoC, GERM, CoMMA, SoMFA |
| Nonlinear | Compass | |
| Based on the alignment criterion | Alignment-dependent | CoMFA, CoMSIA, MSA, RSA, GERM, AFMoC, HIFA, VFA, MQSM |
| Alignment-independent | Compass, CoMMA, HQSAR, WHIM, GRIND, VolSurf, CoSA | |
| Based on intermolecular modeling or the information employed to develop QSAR | Ligand-based | CoMFA, CoMSIA, MSA, RSA, Compass, GERM, CoMMA, SoMFA |
| Receptor-based | AFMoC, HIFA |
8.2 Comparative Molecular Field Analysis
8.2.1 Concept of CoMFA
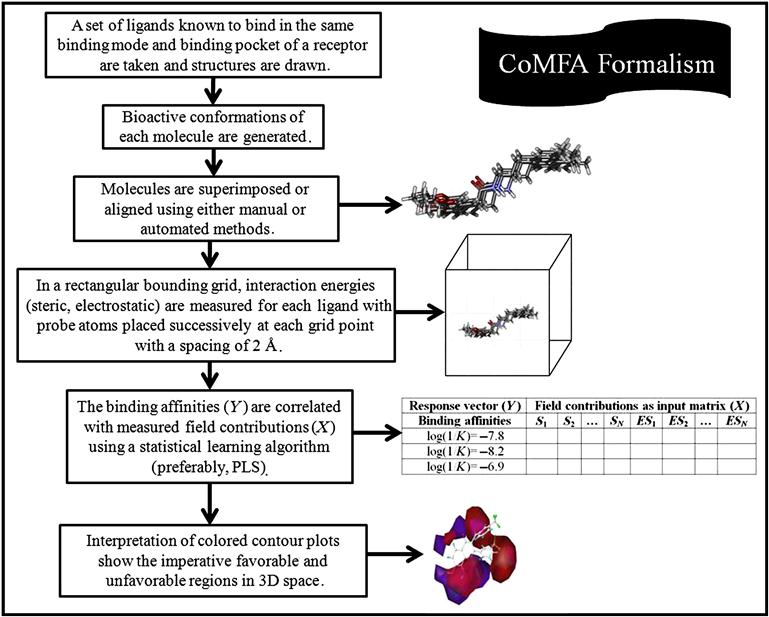
Comparative molecular field analysis (CoMFA) is a molecular field–based, alignment-dependent, ligand-based method developed by Cramer et al. [5], which helps in building the quantitative relationship of molecular structures and its response property. The method mostly focuses on ligand properties like steric and electrostatic ones, and the resulting favorable and unfavorable receptor–ligand interactions. As CoMFA is an alignment-dependent, descriptor-based method, all aligned ligands are placed in an energy grid, and by placing an appropriate probe at each lattice point, energy is calculated. The resultant energy calculated at each unit fraction corresponds to electrostatic (Coulombic) and steric (van der Waals) properties. These computed values serve as descriptors for model development. These descriptor values are then correlated with biological responses employing a robust linear regression method like partial least squares (PLS). The PLS results serve as an important signal to identify the favorable and unfavorable electrostatic and steric potential and also correlate it with biological responses.
8.2.2 Methodology of CoMFA
The formalism of the CoMFA methodology is described next:
a. Structures of all molecules are drawn using any structure-drawing software.
b. The bioactive conformation of each molecule is generated and energy minimization is carried out.
 (8.1)
(8.1)
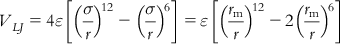
In Eq. (8.1), ε is the depth of the potential well, σ is the finite distance at which the interparticle potential is zero, r is the distance between the particles, and rm is the distance at which the potential reaches its minimum. At rm, the potential function has the value −ε. The distances are given as rm=21/6σ.
Again, computation of electrostatic field follows the Coulombic interaction equation as follows:
 (8.2)
(8.2)where q1 and q2 denote point charges, r is the distance between charges, and ε is the dielectric constant of the medium.
The CoMFA formalism is schematically illustrated in Figure 8.1.
8.2.3 Factors responsible for the performance of CoMFA
There are diverse factors that can control the complete performance of the constructed CoMFA model. These are described in the next sections.
8.2.3.1 Biological data
Like any 2D-QSAR method, one has to use precise activity data in order to create a good 3D-QSAR model. The following conditions should be fulfilled for maintaining the accuracy and appropriateness of the biological response data [3,6]:
• All molecules should belong to a congeneric series.
8.2.3.2 Optimization of 3D structure of the compounds
Representing the initial molecular structure is an important issue in 3D-QSAR analysis. This can be done by both experimental and computational approaches. A huge number of experimentally determined crystal structures are accessible in databases like the Cambridge Structural Database [7] and the Protein Data Bank [8]. The obtainable crystal structures present the benefit that some conformational information about the flexible molecule is included. Computationally, the 3D structures can be generated by three methods:
Once the starting 3D molecular structures are generated, their geometries are refined by minimizing their conformational energies using following structure optimization techniques, including:
8.2.3.3 Conformational analysis of compounds
The following conformational search methods can be implemented:
8.2.3.4 Determination of bioactive conformations
The bioactive conformation defines a particular conformation of the molecule in which it is bound to the receptor. The intrinsic forces between the atoms in the molecule, as well as extrinsic forces between the molecule and its surrounding environment, considerably influence the bioactive conformation of the molecule [6]. Bioactive conformations of the compounds can be attained both by experimental and theoretical techniques. Experimental methods for creating bioactive conformations comprise the techniques described.
8.2.3.4.1 X-ray crystallography
The precise 3D structure of the macromolecules can be obtained by this method. Drug–receptor complexes generated by X-ray crystallography logically offer the exact information, but this method has several disadvantages:
• There is a chance of structural distortion due to crystal packing.
• The positions of hydrogen atoms are tricky to be determined.
• There is a possibility of errors in determining the structure of the ligand.
8.2.3.4.2 NMR spectroscopy
The 3D structural data is obtained in the solution and is a method of selection when the molecule cannot be crystallized through experimental ways, as in the case of the membrane-bound receptors or receptors, which have not yet been isolated due to stability, resolution, or other issues. The imperative features of this method are:
• Significant information regarding dynamic aspects of molecular motion can be obtained.
• It requires much less time but applicable to small molecules only.
• The positions of hydrogen atoms can be resolved.
• Apolar solvents may lead to an overprediction of hydrogen-bonding phenomena.
Stay updated, free articles. Join our Telegram channel

Full access? Get Clinical Tree


