Newer QSAR Techniques
Quantitative structure–activity relationship (QSAR) analysis has speeded up the lead optimization process by multiple degrees in the last two decades. QSAR as a tool is gaining increasing acceptance with medicinal chemists and researchers in the allied fields due to the increased understanding of the underlying science by which one can develop mathematical (QSAR) models in order to accurately predict the biological activity or potency of new or untested compounds. QSAR has the capability to prioritize ideas in lead optimization and virtual screening. Thus, there is a constant effort among QSAR experts to develop more efficient QSAR techniques to make in silico drug discovery approaches more reliable and dependable for medicinal chemists in practice. New QSAR techniques such as hologram-based QSAR (HQSAR) and group-based QSAR (G-QSAR), as well as some other less known relatively newer QSAR approaches, are discussed in this chapter.
Keywords
eQSAR; G-QSAR; HQSAR; MIA-QSAR; LQTA-QSAR; 4D-QSAR; 5D-QSAR; 6D-QSAR; 7D-QSAR
9.1 Introduction
Drug design is driven by innovation and technological advancement involving a combination of sophisticated experimental and computational approaches. Innovation in medicinal chemistry and biology has generated an imperative foundation in the search for new drug candidates. With the advances in scientific knowledge, high-performance hardware, and sophisticated software, a new wave of drug discovery has emerged in pharmaceutical research and development (R&D) through computational chemistry [1]. Quantitative structure–activity relationship (QSAR) methods are among the most important computational strategies that have been applied for the identification of hits, generation of leads, and finally optimization of these leads into drug candidates over the past 10 years [2].
Among the newer QSAR techniques, hologram-based QSAR (HQSAR) has emerged as one of the powerful new two-dimensional (2D) fragment-based QSAR (FB-QSAR) techniques where specialized molecular fragments are employed. HQSAR is fast and easy to use, and it can accurately predict activity for lead identification, facilitating future synthesis programs. A number of recent publications have shown that HQSAR can give results comparable to complicated and exhaustive 3D-QSAR techniques, but the former is much easier to use [3,4]. A new method called group-based QSAR (G-QSAR) uses descriptors evaluated for the fragments of the molecules generated using specific fragmentation rules [5]. Another simple QSAR method based on 2D image analysis for congeneric series of compounds is known as multivariate image analysis QSAR (MIA-QSAR) developed by Freitas et al. [6]. MIA has been used in chemical problems by using spectral data and widely used in the fields of scientific imaging for a long time. With the advancement of computation tools, new methods like Laboratório de QuimiometriaTeórica e Aplicada QSAR (LQTA-QSAR) [7], ensemble QSAR (eQSAR) [8], and other novel approaches like FB-QSAR, fragment-similarity-based QSAR (FS-QSAR), self-organizing map QSAR (SOM-QSAR), QUASAR (5D-QSAR), 6D-QSAR, and 7D-QSAR have been introduced by QSAR researchers with the intention of making the study of QSAR more useful, productive, and interpretable for designing new drug candidates with enhancement of the general acceptability of QSARs to the scientific community [9,10].
9.2 HQSAR
9.2.1 Concept of HQSAR
HQSAR is a modern technique based on the concept of using molecular substructures expressed in a binary pattern (i.e., fingerprints) as descriptors in QSAR models. HQSAR is a 2D FB-QSAR method that employs specialized molecular 2D fingerprints. HQSAR [11] does not require any physicochemical descriptors or three-dimensional (3D) structures to generate the structure–activity model. In this method, 2D structures and biological activity are used as inputs and the structures are converted to all possible linear, branched, and overlapping fragments. These fragments are assigned to integer values using a cyclic redundancy check algorithm, and these integer values are used to make a fixed-length integer array. These arrays are known as molecular holograms, and space occupancies of the molecular holograms are used as descriptors. The fundamental difference from other fragment-based techniques is that it encodes all possible fragments, including overlapping fragments. Partial least squares (PLS) regression is used to build the model, which is validated by the leave-one-out (LOO) method. The final model (as represented in the following equation) is obtained using PLS:
 (9.1)
(9.1) In Eq. (9.1), Ai is the activity of compound i, Xil is the hologram occupancy value at position i or bin l, C is a constant, Cil is the coefficient for the corresponding bin from the PLS run, and L is the hologram length.
9.2.2 How to develop an HQSAR model
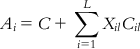
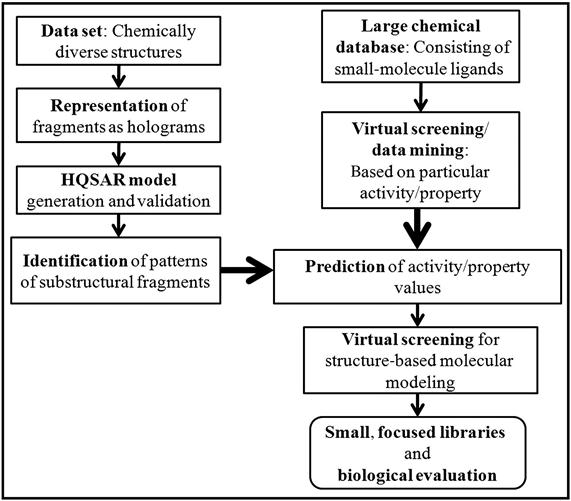
The HQSAR technique involves three main steps [12]: (i) generation of substructural fragments for each of the training set molecules, (ii) representation of the fragments in the form of holograms, and (iii) correlation of the molecular holograms with the activity data of the training set compounds using the PLS technique to generate an HQSAR model. The bin occupancies of the molecular holograms are the structural descriptors encoding the specific compositional and topological molecular information. A graphical illustration of the generation of molecular holograms and the HQSAR model is demonstrated in Figure 9.1.
The number and nature of fragments denoting the molecular fingerprint are specified based on the minimum (M) and maximum (N) number of atoms in a fragment. The substructure fingerprints are then hashed into hologram bins of varying lengths (L), such as 53, 59, 61, 71, and 97. A hologram bin is an integer array with a fixed length ranging from 50 to 500. The molecular fingerprint maintains a count of the frequency of the various molecular fragment types occupying each bin of the fixed-length array. The array refers to the molecular hologram, while the bin occupancies represent the descriptor variables.
The various type of fragments thus obtained are placed into different bins, with similar ones occupying the same bin. The molecular holograms are then correlated with the activity data based on PLS analysis, and the number of components yielding optimally predictive models is determined using the LOO cross-validation (LOO-CV) technique. The graphical display of the HQSAR analysis provides a color-coded structure of the molecules, where the degree of contribution of the different fragments to the overall molecular activity is denoted by a specific color. As an example, we can cite that in the case of SYBYL software [13], the colors at the red end of the spectrum reflect poor contributions, while those at the green end show favorable contributions; and white atoms signify intermediate contributions and cyan ones refer to the common skeleton shared by all training set compounds. It is interesting to point out that the color codes may vary from software to software. The chance of overfitting the developed model should be reduced by limiting the maximum number of components to R/5 (with R being the number of training set compounds). Followed by the selection of the component number, the QSAR analysis should be redone and the final PLS model obtained with the optimum component number based on the specific fragment distinction parameters, fragment size, and bin length. A statistically significant HQSAR model with an optimum number of components should be selected based on the maximum value of Q2 and the minimum value of cross-validated standard error (SEcv). The HQSAR model should be validated using the test set compounds, and the accuracy of prediction of the test set activity data is judged based on the value of the  (
( ) parameter.
9.2.3 HQSAR parameters
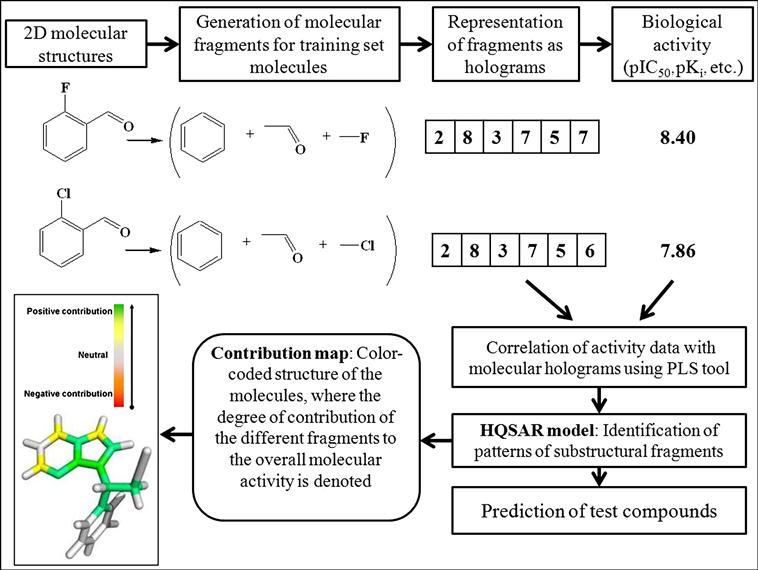
HQSAR models can be affected by a number of parameters considering hologram generation [11,12]. All the parameters are demonstrated through a graphical illustration in Figure 9.2. The parameters are discussed in detail in the next sections of this chapter.
9.2.3.1 Hologram length
Hologram length is a user-defined parameter that controls the number of bins in the hologram fingerprint. As the hologram length (L) is considerably less than the number of fragments in most of the compounds, modifying it will cause the pattern of bin occupancies in data-set holograms to change. Certain patterns of fragment disposition in the molecular holograms enable PLS to more readily detect the relationship between fragments present in the data set and the variance in the biological activity.
9.2.3.2 Fragment size
Fragment size controls the minimum and maximum lengths of fragments to be included in the hologram fingerprint. Molecular holograms are produced by the generation of all linear and branched fragments between M and N atoms in size. The parameters M and N can be changed to include smaller or larger fragments in the holograms.
9.2.3.3 Fragment distinction
HQSAR allows fragments to be distinguished based on various parameters, which are defined in Table 9.1.
Table 9.1
Fragment distinction parameters
| Atoms | The atoms parameter allows fragments to be determined based on elemental atom types—for example, allowing O to be distinguished from N. |
| Bonds | The bonds parameter enables fragments to be distinguished based on bond orders—for example, in the absence of hydrogen, allowing pentane to be distinguished from 2-pentene. |
| Connections | The connections parameter provides a measure of atomic hybridization states within fragments. Thus, connections cause HQSAR to identify how many connections are made to constituent atoms, as well as the bond order of those connections. |
| Hydrogens | HQSAR overlooks hydrogen atoms during fragment generation. |
| Chirality | The chirality parameter enables fragments to be distinguished based on atomic and bond stereochemistry. Thus, stereochemistry allows to distinguish cis structures from trans counterparts, and R-enantiomers to be distinguished from S at all chiral centers. |
| Donor and acceptor | The donor and acceptor parameters flag distinguishing atoms matching the donor and acceptor properties. |
9.2.4 Why use HQSAR over other techniques?
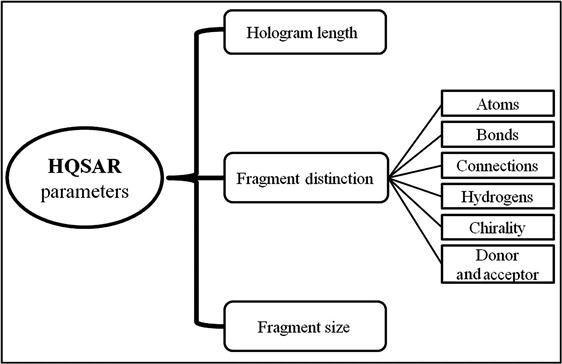
A key dissimilarity between HQSAR fingerprints and traditional 2D fingerprints is that 2D fingerprints are binary strings that record the presence or absence of substructures, while molecular holograms contain all possible molecular fragments within a molecule and maintain a count of the number of times each unique fragment occurs. HQSAR encodes all possible fragments within a molecule, as well as each of the constituent subfragments. This feature allows HQSAR to encode imperative regiospecific information about fragments [11,12].
Activity variation with the shift of a substituent around a ring system can be readily identified by the HQSAR approach. In addition, HQSAR can distinguish fragments using stereochemical and hybridization state information features that have not been incorporated in other fragment-based methods. HQSAR typically produces correlations that are comparable to 3D-QSAR techniques, such as comparative molecular field analysis (CoMFA), but avoids the time-consuming step of 3D model generation and mutual alignment in 3D space [12]. The technique offers the following advantages over complex 3D techniques:
• It is applicable to large data sets as well as traditional-size sets.
• It allows rapid identification of the structure–activity relationship profile of a data set.
• It searches databases to make predictions for collections of structures.
The advantages of HQSAR over the traditional 2D fingerprints and 3D-QSAR techniques are graphically illustrated in Figure 9.3.
9.2.5 Application of HQSAR models
The main purpose of studying HQSAR is to explore individual atomic contribution to molecular bioactivity with a visual display of active centers in the compounds. Thus, the drug design process can be very fruitfully facilitated by studying QSAR. HQSAR has been successfully applied in different stages of drug discovery by various groups of researchers.
9.2.5.1 A flexible tool in drug design
Many HQSAR models have been generated for a variety of ligands of important molecular targets, including cases where the crystal structure of the target protein is not yet available [14–17]. One has to recognize that along with the prediction of potency and affinity of untested compounds, HQSAR models can provide useful insight into the relationships between structural fragments and biological activity. These fragments can be simply visualized through the generation of contribution maps that replicate the individual contribution of each atom or structural fragment for a query compound. This information, combined with synthetic and medicinal chemistry knowledge, could lead to the synthesis of new drug molecules with improved potency. Thus, HQSAR can be considered a flexible tool in drug design.
As an example, we can cite that the most potent compound of a large collection of 9-substituted-9-deazaguanine analogs that inhibit human purine nucleoside phosphorylase (PNP) enzyme has been identified by Castilho et al. [3] with the application of the 2D-HQSAR contribution map. The contribution map allowed the recognition of key structural components essential for intermolecular interactions in the protein active site. Analyzing the contribution map of the most potent inhibitor, the authors concluded that the molecular fragments for the purine ring and cyanil moieties are strongly involved in the inhibitory profile of the compound. Thus, it is possible to identify responsible atomic contributions of a query molecule of increased potency in the absence of the 3D crystal structure of PNP or any other 3D structural information. On the other hand, when 3D structural information is present, this allows a comparison of the HQSAR results to determine if they are in agreement with the 3D chemical environment of the target protein.
HQSAR models have been used in combination with both classical 2D-QSAR and 3D-QSAR methods, suggesting that this method is a valuable tool for lead optimization and drug design process [15–18]. These complementary methods have effectively allowed the integration of additional features in the interpretation of HQSAR models in terms of their chemical and biological significance [19]. As a descriptive example of the amalgamation of QSAR strategies, a study of a large series of flavanoids, dihydrobenzoxathiins, and dihydrobenzodithiins as estrogen receptor (ER) modulators demonstrated that HQSAR and CoMFA can be carried out concurrently to search for a potent drug molecule [4]. The molecular fragments identified by the HQSAR model are strongly correlated to the binding affinity of this series of ligands, which is in accordance with the CoMFA results shown in the steric and electrostatic contour maps. In another study, Avery et al. [20] reported 3D-QSAR (CoMFA) and HQSAR models for a series of 211 artemisinin analogs to develop more potent and less neurotoxic agents for the oral treatment of drug-resistant malaria. The authors found that predictions made with CoMFA and HQSAR models on the test set compounds were in reasonable agreement with the experimentally determined values.
The role of HQSAR in the drug design is evident, and it is enormously vital to realize that the information collected from the patterns of substructural fragments is associated with essential ligand–receptor interactions. We can cite here that in the absence of tubulin-bound discodermolide crystal structures, Salum et al. [21] recently utilized HQSAR to generate molecular recognition patterns that were then combined with molecular modeling studies as a step for the understanding of crucial discodermolide–tubulin interactions associated with the high antiproliferative activity of discodermolide analogs.
9.2.5.2 Mathematical correlation to activity/property prediction
HQSAR has been employed to construct models with internal and external robustness, as well as predictivity. The basic approach of HQSAR can be tactically applied in virtual screening (VS) strategies for the identification of hits [22–24]. The analysis of large data sets generated by combinatorial chemistry and high-throughput screening (HTS) techniques has demonstrated the versatility and range of applications of HQSAR. HQSAR includes several desirable characteristics, such as versatility and reliability. The method is suitable for the identification of important structural fragments and for the rapid evaluation and prediction of large chemical libraries, as well as for database mining.
The originality of this method is that it can distinguish the most important structural fragments related to activity and associate them with unique 2D structural characteristics, which can be found in data sets of chemically diverse compounds. Importantly, HQSAR models carry a set of 2D chemical and structural features that can be quantitatively translated into specific 3D ligand–protein interactions. Furthermore, the attribution of diverse weights to differentiate the relative contribution of molecular fragments is directed by experimental values. Statistically robust HQSAR models have been generated for a set of indole derivatives consisting potent anticancer activity for accurate prediction of the activity [25,26].
The computational approach can be employed to search large chemical databases to identify probable hits for a given biological target. Identified molecular recognition patterns from HQSAR models can be combined with the structure-based VS, which is graphically illustrated in Figure 9.4. The integration of fragment-based methods and structure-based VS strategies can be utilized successfully in the coming years.
9.2.5.3 Pharmacokinetic studies and ADME prediction
Along with properties like efficacy, potency, and selectivity, a drug should possess desirable pharmacokinetic/dynamic characteristics and safety. Properties such as absorption, distribution, metabolism, and excretion (ADME) have been recently considered in early phases of drug discovery, as undesirable pharmacokinetic properties can negatively affect the clinical development of new drug molecules [27,28]. In terms of resources, reagents, and detection techniques, in vitro and in vivo ADME assays are quite lengthy, complex, and relatively expensive. In this perspective, a variety of useful in silico ADME models have been developed for the screening of large data sets of compounds, which can be used as faster, simpler, and cheaper tools than the experimental ones [28].
More recently, it has been observed that reliable HQSAR models have been successfully developed and validated for data sets of highly diverse compounds belonging to various therapeutic classes [29,30]. It is interesting to point out that the HQSAR patterns of substructural fragments could also be useful in pharmacokinetic studies comparing traditional mechanism-based pharmacodynamic modeling. The identified substructural patterns for a particular class of chemicals can be employed as ADME filters in the process of chemical library design and VS. The high chemical diversity and the conformation-independent characteristics signify distinctive advantages in the application of the HQSAR method for ADME property prediction.
9.3 G-QSAR
9.3.1 Concept of G-QSAR
G-QSAR [5] is a novel extrapolation of the FB-QSAR technique that allows establishing a correlation of chemical group variation at different molecular sites of interest with the corresponding biological activity. The technique aims at deriving a quantitative relationship between the activity and descriptors calculated for various molecular fragments of interest using specific fragmentation rules. It provides an ease of interpretation of the essential requisites of the different substituents by not only suggesting the important descriptors, but also reflecting the site where they have to be optimized for the design of new molecules. G-QSAR uses the known 2D/3D descriptors for the different fragments and also includes interaction of fragments using cross-terms that are evaluated as products of vectors of fragment descriptors and used as descriptors.
The advantage of the G-QSAR technique is that it considers the substituent interactions as fragment-specific descriptors to account for the fragment interactions in QSAR model. The 2D-QSAR approaches could only suggest important descriptors, whereas the G-QSAR approach not only reflects the descriptors, but also the site where they have to be optimized for the design of new molecules [5]. Thus, it may be inferred that the G-QSAR approach is a modification of the classical QSAR concept of Hansch, which deals with the calculation of physicochemical and structural parameters specific for the position and type of substitution.
9.3.2 Background of evaluation of G-QSAR method
In the classical Hansch method, substituent properties like Hammett and Taft constants, which are related to chemical environment and steric properties of groups, are used as descriptors for QSAR [31]. The interesting point here is that the substituent constants are completely independent of each other and interactions among them are completely ignored. Again, usually QSAR models are developed from several molecular descriptors such as topological, electronic, structural, and spatial, but the major problem is that these descriptors represent the properties of the whole molecule, ignoring corresponding group contributions. Whole-molecular descriptors have played a significant role in developing quantitative relationship with the activity, but the true interpretation of these traditional QSAR models has always been a challenge to QSAR researchers. The major drawback of these models is that they do not specify the site at which modification is required for the future design of the drug entity.
Consequently, one of the 3D-QSAR techniques, CoMFA, considered descriptors like steric and electrostatic fields calculated at the grid points generated from aligned molecules [32]. As the descriptor space is huge, to reduce dimensionality, models are developed by using regression methods such as PLS. The major advantage of this method is that the model can provide good clues for designing new drug entities by specifying a position along with its steric and electrostatic requirements. However, the major limitations of this method are its dependency on molecular alignment and selection of conformers for the alignment. This feature becomes critical in two cases: first, when the information of bioactive conformation is absent; and second, when the molecule framework is not rigid.
Thus, a QSAR method that allows flexibility to study molecular sites of interest and capture interactions among them is needed. Again, unlike 3D-QSAR methods, this method should not rely on conformational analysis and molecular alignment to identify the sites and way of interactions liable for the activity difference. With this as the background, Ajmani et al. [5] have developed G-QSAR, which allows easy interpretation, unlike any conventional QSAR method. The foremost advantage of this method is that it reflects the site where it has to be optimized for the design of new molecules. The advantage of G-QSAR over HQSAR is that G-QSAR considers the substituent interactions as fragment-specific descriptors when accounting for the fragment interactions in the QSAR model.
9.3.3 G-QSAR methodology
Existing methods like the Free–Wilson approach and HQSAR (as discussed earlier) use fragment descriptors for the generation of QSAR models [5,33–35]. However, the relatively new method G-QSAR differs from them in two ways:
G-QSAR methodology can be precisely explained in three steps, which are detailed in the next sections.
9.3.3.1 Molecular fragmentation
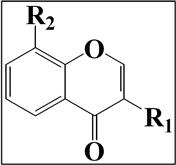
The G-QSAR technique begins with the fragmentation of the molecules under study [5]. The fragmentation of a molecule becomes simple while working with a set of congeneric molecules. The number of sites at which the substituents are present form the different fragments for a given molecule. For example, we can demonstrate that R1 and R2 are the substitution sites of a congeneric series of chromone derivatives for antioxidant activity (Figure 9.5). For the G-QSAR study of this set of compounds, the molecules can be divided into two fragments composed of various substitutions at two sites R1 and R2.
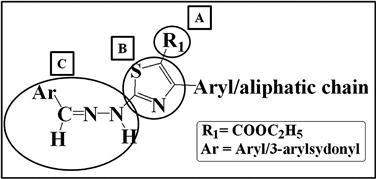
On the other hand, for a noncongeneric set of molecules (chemically diverse structures or different templates), breaking up of a set of molecules is performed with a predefined set of chemical rules. Here, molecules are considered to consist of different fragments, as presented in Figure 9.6 with a simple example of 3-arylsydonyl and aryl-substituted hydrazine thiazoles with three fragments. To consider the environment of the neighboring fragments, the attachment point atoms are incorporated in the fragments. With respect to steric and electrostatic environments, fragment B will be different from fragments A and C, as it will include the attachment atoms of both A and C. On the other hand, fragments A and C have the attachment atom from the B fragment only.
Stay updated, free articles. Join our Telegram channel

Full access? Get Clinical Tree


