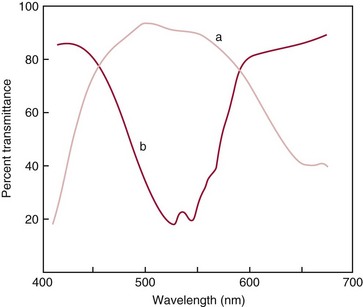
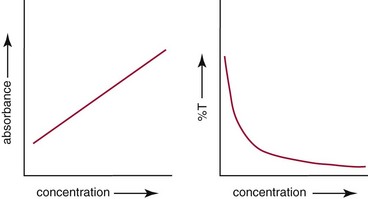
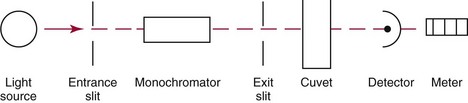
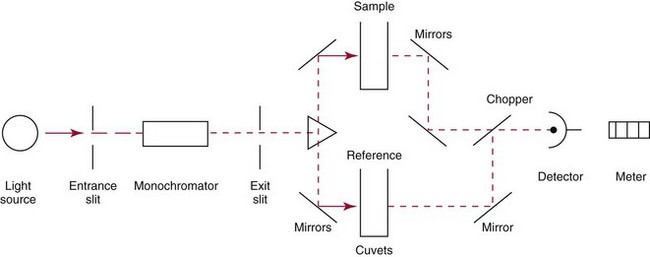
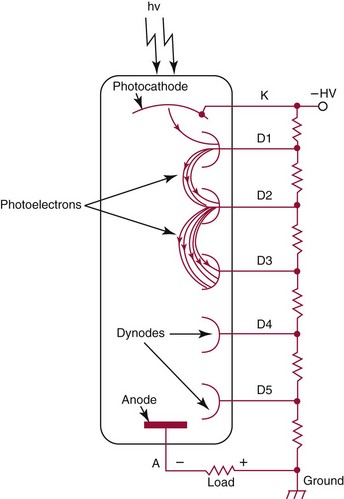
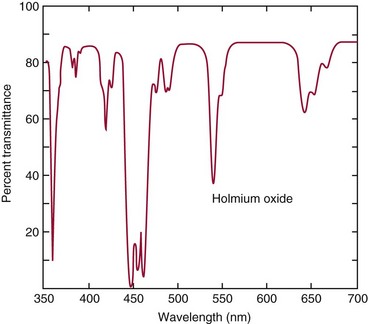
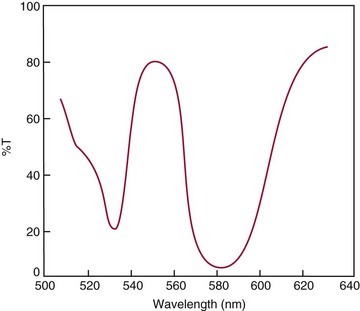
Optical Techniques

Chapter 10


Optical Techniques


Many determinations made in the clinical laboratory are based on measurements of radiant energy emitted, transmitted, absorbed, scattered, or reflected under controlled conditions. The principles involved in such measurements are considered in this chapter.


Nature of Light


Electromagnetic radiation includes radiant energy that extends from cosmic rays with wavelengths as short as 10 nm up to radio waves longer than 1000 km. However, in this chapter, the term light is used to describe radiant energy from the ultraviolet and visible portions of the spectrum (180 to 800 nm).


The wavelength of light is defined as the distance between two peaks as the light travels in a wavelike manner. This distance is expressed in nanometers (nm) for wavelengths commonly used in photometry. Other units include


image


In addition to possessing wavelength characteristics, light has properties that indicate that it is composed of discrete energy packets called photons. The relationship between the energy of photons and their frequency is given by the equation


image (1)


where E = energy in ergs, ν = frequency of light in cycles per second, and h = Planck’s constant (6.62 × 1027 erg seconds). The frequency of light (ν) is related to the wavelength by an equation


image (2)


where c = speed of light in a vacuum (3 × 1010 cm/s), and λ = wavelength in centimeters. Combining equations (1) and (2) results in


image (3)


This equation shows that the energy of light is inversely proportional to the wavelength. For example, ultraviolet (UV) radiation at 200 nm possesses greater energy than infrared (IR) radiation at 750 nm.


The human eye is able to detect radiant energy with wavelengths between about 380 and 750 nm, but modern instrumentation permits measurements at both shorter wavelength (UV) and longer wavelength (IR) portions of the spectrum. Sunlight, or light emitted from a tungsten filament, is a mixture of wavelengths or a spectrum of radiant energy of different wavelengths that the eye recognizes as “white.” Table 10-1 shows approximate relationships between wavelengths and color characteristics for the UV, visible, and short IR portions of the spectrum. Thus a solution will appear green when viewed against white light if it transmits light maximally between 500 and 580 nm but absorbs light at other wavelengths. Similarly, a solid object appears green if it reflects light in this region (500 to 580 nm) but absorbs light at other portions of the spectrum. In general, if we compare the intensity of light transmitted by a colored solution versus that of a reference solution over the entire spectrum, we obtain a typical spectral transmittance curve characteristic for that spectrum. Such curves are shown in Figure 10-1 for solutions of nickel sulfate (a) and potassium permanganate (b). Inspection of the curves should lead us to predict that the color of solution a is green because light is transmitted maximally near the green portion of the spectrum. Curve b, on the other hand, illustrates the spectrum of a solution that transmits light maximally in the blue, violet, and red portions of the spectrum. The eye recognizes this mixture of colors as purple.


Spectrophotometry


Photometry is defined as the measurement of light; spectrophotometry is defined as the measurement of the intensity of light at selected wavelengths. Spectrophotometric analysis is a widely used method of quantitative and qualitative analysis in the chemical and biological sciences. The method depends on the light-absorbing properties of the substance or a derivative of the substance being analyzed. The intensity of transmitted light passing through a solution containing an absorbing substance (chromogen) is decreased by the absorbed fraction. This fraction is detected, measured, and used to relate the light transmitted or absorbed to the concentration of the analyte in question.


Basic Concepts


Consider an incident light beam with intensity I0 passing through a square cell containing a solution of a compound that absorbs light of a certain wavelength, λ. Given that the intensity of the transmitted light beam is IS, then transmittance (T) of light is defined as


image (4)


A portion of the incident light, however, may be reflected by the surface of the cell or may be absorbed by the cell wall or solvent. To focus attention on the compound of interest, elimination of these factors is necessary. This is achieved using a reference cell identical to the sample cell, except that the compound of interest is omitted from the solvent in the reference cell. The transmittance (T) through this reference cell is IR divided by IO; the transmittance for the compound in solution then is defined as I divided by IR. In practice, the light beam is blocked and the detector signal set to zero transmittance, then a reference cell is inserted and the detector signal adjusted to an arbitrary scale reading of 100 (corresponding to 100% transmittance), followed by the cell containing the sample to be measured, and the percent transmittance reading is made on the sample. As we increase the concentration of the compound in solution, we find that transmittance varies inversely and logarithmically with concentration (Figure 10-2). Consequently, it is more convenient to define a new term, absorbance (A), which will be directly proportional to the concentration. Thus the amount of light absorbed (A) as the incident light passes through the sample is equivalent to


image (5)


Analytically, the amount of light absorbed or transmitted is related mathematically to the concentration of the analyte in question by Beer’s law.


Beer’s Law—Relationship Between Transmittance, Absorbance, and Concentration


Beer’s law (also known as the Beer-Lambert law) states that the concentration of a substance is directly proportional to the amount of light absorbed or inversely proportional to the logarithm of the transmitted light (see Figure 10-2). Mathematically, Beer’s law is expressed as


image (6)


where


This equation forms the basis of quantitative analysis by absorption photometry. When b is 1 cm and c is expressed in moles per liter, the constant a is called the molar absorptivity. The value for a is a constant for a given compound at a given wavelength under prescribed conditions of solvent, temperature, pH, and so forth. The nomenclature of spectrophotometry is summarized in Table 10-2. Values for a are useful for characterizing compounds, establishing their purity, and comparing the sensitivity of measurements obtained on derivatives. Pure bilirubin, for example, when dissolved in chloroform at 25 °C, has a molar absorptivity of 60,700 ± 1600 at 453 nm. The molecular weight of bilirubin is 584. Hence a solution containing 5 mg/L (0.005 g/L) should have an absorbance of


image (7)


The molar absorptivity of the complex between ferrous iron and s-tripyridyltriazine is 22,600, whereas that with 1,10-phenanthroline is 11,000. Thus for a given concentration of iron, s-tripyridyltriazine produces a complex with an absorbance about twice that of the complex with 1,10-phenanthroline. Consequently, s-tripyridyltriazine is a more sensitive reagent to use in the measurement of iron.


Application of Beer’s Law


In practice, a calibration relationship between absorbance and concentration is established experimentally for a given instrument under specified conditions using a series of reference solutions that contain increasing concentrations of analyte. Frequently, a linear relationship exists up to a certain concentration or absorbance. When this linear relationship exists, the solution is said to obey Beer’s law up to this point. Within this limitation, a calibration constant (K) may be derived and used to calculate the concentration of an unknown solution by comparison with a calibrating solution.


Certain precautions must be observed with the use of such calibration constants. For example, under no circumstances should the calibration constants be used when the calibrator or unknown readings exceed the linear portion of the calibration relationship. In other words, calibration constants are used only when the curve obeys Beer’s law. At least two and preferably more calibrators should be included in each series of determinations to permit direct comparison of unknown readings with calibrators or to calculate the calibration constant. These multiple calibrators are necessary because variations in reagents, working conditions, and cell diameters and deterioration or changes in instruments may result in day-to-day changes in the absorbance value for the calibrator. A nonlinear calibration curve may be used if a sufficient number of calibrators of varying concentrations are included to cover the entire range encountered for readings on unknowns.


In some cases, a pure reference material may not be readily available, and constants may be provided that were obtained on pure materials and reported in the literature. In general, published constants should be used only if the method is followed in detail and readings are made on a spectrophotometer capable of providing light of high spectral purity at a verified wavelength. Use of broader-band light sources usually leads to some decrease in absorbance. For example, the absorbance of nicotinamide adenine dinucleotide (NADH) at 340 nm is frequently used as a reference for determination of enzyme activity, based on a molar absorptivity of 6.22 × 10³ (see Chapter 15). This value is acceptable only under the carefully controlled conditions previously described and should not be used unless these conditions are met. Published values for molar absorptivities and absorption coefficients should be used only as guidelines until they are verified by readings on pure reference materials for a given instrument. In addition, Beer’s law is followed only if the following conditions are met:


Instrumentation


Modern instruments isolate a narrow wavelength range of the spectrum for measurements. Those that use filters for this purpose are referred to as filter photometers; those that use prisms or gratings are called spectrophotometers. Spectrophotometers are classified as single or double beam.


The major components of a single-beam spectrophotometer are shown schematically in Figure 10-3. In such an instrument, a beam of light is passed through a monochromator that isolates the desired region of the spectrum to be used for measurements. The light next passes through an absorption cell (cuvet), where a portion of the radiant energy is absorbed, depending on the nature and concentration of the substance in the solution. Any light not absorbed is transmitted to a detector, which converts light energy to electrical energy that is registered on a meter or recorder or digitally displayed.


In operation, an opaque block is substituted for the cuvet, so that no light reaches the photocell, and the meter is adjusted to read 0% T. Next, a cuvet containing a reagent blank is inserted, and the meter is adjusted to read 100% T (zero absorbance). The composition of the reagent blank should be identical to that of calibrating or unknown solutions except for the substance to be measured. Calibrating solutions containing various known concentrations of the substance are inserted, and readings are recorded. Finally, a reading is made of the unknown solution, and its concentration is determined by comparison with readings obtained on the calibrators. In most spectrophotometers, digital hardware and software are integral components and perform these functions automatically.


Figure 10-4 illustrates schematically a typical double-beam instrument that uses a light-beam chopper (a rotating wheel with alternate silvered sections and cutout sections) inserted after the exit slit. A system of mirrors passes portions of the light reflected off the chopper alternately through the sample and a reference cuvet onto a common detector. The chopped-beam approach, using one detector, compensates for light source variation and for sensitivity changes in the detector.


Components


The basic components of a spectrophotometer include (1) a light source, (2) a device to isolate light of a desired wavelength, (3) a cuvet, (4) a photodetector, (5) a readout device, and (6) a data system.


Light Sources

Types of light sources used in spectrophotometers include incandescent lamps, xenon discharge lamps, light-emitting diodes, and lasers.


Incandescent, Arc, and Cathode Lamps: The light source for measurements in the visible portion of the spectrum is usually a tungsten light bulb. The lifetime of a tungsten filament is greatly increased by the presence of a low pressure of iodine or bromine vapor within the lamp. An example is the quartz-halogen lamp, which has a fused-silica envelope and which provides high-intensity light over a wide spectrum for extended operating periods (2000 to 5000 hours) before replacement is necessary.


However, a tungsten light source does not supply sufficient radiant energy for measurements in the UV region (below 320 nm). In the UV region of the spectrum, hydrogen and deuterium lamps, as well as high-pressure mercury and xenon arc lamps, provide sources of continuous spectra in the UV region with some sharp emission lines. These sources are more commonly used in UV absorption measurements. Low-pressure mercury vapor lamps also provide spectra in the UV region and are useful for calibration purposes, but they are not very practical for absorbance measurements, because of their limited wavelengths.


Mercury arc lamps emit an intense 254-nm resonance line and are widely used as detectors in high-performance liquid chromatography (HPLC) (see Chapter 13). Alternatively, some HPLCs employ a miniature hollow cathode lamp as a very-narrow-wavelength intense source. For example, a zinc hollow cathode lamp emits a line at 214 nm that is close to the maximum wavelength of peptide bond absorption (206 nm); this emission property permits the usage of such lamps to measure peptides and proteins. Details on the hollow cathode lamp are found in the section on “Atomic Absorption Spectrophotometry.” The hollow cathode lamp also has a long, useful lifetime if a lower-current, nonpulsed power supply is used.


Laser Sources: A laser (light amplification by stimulated emission of radiation) is a device that controls the way that energized atoms release photons; lasers are used as light sources in spectrophotometers because they provide intense light of a narrow wavelength. Through selection of different materials, different wavelength(s) of light are emitted by different types of lasers (Table 10-3).


Three properties of laser sources distinguish them from “conventional” sources: (1) spatial coherence is a property of lasers that allows beam diameters in the range of several microns; (2) lasers produce monochromatic light; and (3) lasers have pulse widths that vary from microseconds (flash lamp–pulsed lasers) to nanoseconds (nitrogen lasers) to picoseconds or less (mode-locked lasers) in duration. Air-cooled argon ion lasers produce about 25 mW of energy output at 488 nm and have plasma tube lifetimes of 6000 hours or longer. Continuous-wave dye lasers typically use an argon ion laser with an output of 1 W or less as an energy pump and use different fluorescent dyes to achieve excitation wavelength ranges of 400 to 800 nm. Helium-neon and helium-cadmium lasers are useful because of their low cost and ease of operation, and because they emit a number of excitation wavelengths; however, the power output of helium-neon lasers has been limited to about 2 mW at 594 nm.


Infrared diode lasers are used in compact disc players and laser printers, and in bar code readers (see Chapter 19). They are solid-state devices, typically constructed of gallium arsenide, and energy is pumped into them at a low potential of −1.5 V. Depending on its construction, the wavelength output of the laser ranges from 550 to 1810 nm. Development of inexpensive near-IR lasers has led to interest in using reflective techniques in the near-IR region of the spectrum (0.8 to 2.5 µm wavelength). Reflectance spectrophotometry is now used clinically for the transcutaneous measurement of bilirubin in neonates.14 Another application of reflectance spectrophotometry is measurement of blood oxygen saturation in near-IR and IR regions.


Spectral Isolation

Radiant energy of a desired wavelength can be isolated and that of other wavelengths excluded in various ways, including the use of (1) filters (interference or dichroic filters), (2) prisms, and (3) diffraction gratings. Combinations of lenses and slits may be inserted before or after the monochromatic device to render light rays parallel or to isolate narrow portions of the light beam. Variable slits may be used to permit adjustments in total radiant energy to reach the photocell.


Filters: The simplest type of filter is a thin layer of colored glass. Certain metal complexes or salts, dissolved or suspended in glass, produce colors corresponding to the predominant wavelengths transmitted. The spectral purity of a filter or other monochromator is usually described in terms of its spectral bandwidth. This is defined as the width, in nanometers, of the spectral transmittance curve at a point equal to one half the peak transmittance. Because glass filters have spectral bandwidths of approximately 50 nm, they are referred to as wide-bandpass filters.


Other glass filters include narrow-bandpass and sharp-cutoff types. Operationally, a cutoff filter typically shows a sharp rise in transmittance over a narrow portion of the spectrum and is used to eliminate light below a given wavelength. Historically, narrow-bandpass filters were constructed by combining two or more sharp-cutoff filters or regular filters. Currently, however, the availability of high-intensity light sources now favors the use of narrow-bandpass interference filters.


A narrow-bandpass interference or dichroic filter uses a dielectric material of controlled thickness sandwiched between two thinly silvered pieces of glass. The thickness of the layer determines the wavelength of energy transmitted after constructive and destructive wavelength interference caused by reflections between the glass surfaces separated by the dielectric spacing. These filters have narrow spectral bandwidths, usually from 5 to 15 nm. Because they also transmit harmonics, or multiples, of the desired wavelength, accessory glass filters are required to eliminate undesired wavelengths. Thus an interference filter designed for 620 nm will also transmit some radiation at 310 and 1240 nm unless accessory cutoff filters are provided to absorb this undesired stray light.


Prisms and Gratings: Prisms and diffraction gratings are widely used as monochromators. A prism separates white light into a continuous spectrum because shorter wavelengths are bent, or refracted, more than longer wavelengths as they pass through the prism. A diffraction grating is prepared by depositing a thin layer of aluminum-copper alloy on the surface of a flat glass plate, then ruling many small parallel grooves into the metal coating. Better gratings contain 1000 to 2000 lines/mm and must be made with great care. These are then used as molds to prepare less expensive replicas for general use in instruments.


Modern holographic gratings are made using a laser in a “high-precision machining” mode. The focused beam of the laser is accurately scanned over a photosensitive material termed a photoresist. After multiple lines have been scribed on the photoresist, chemicals are used to dissolve and elute the exposed photoresist to create channels that become the lines of the grating. A layer of a highly reflective material is then sputtered onto the surface of the laser-etched channels, and the grating is ready for use. A flat photoresistive surface or a concave surface can be used to make this type of grating. These types of gratings are extremely accurate, have low light scatter, and are widely used in the spectrophotometers found in clinical chemistry instruments. For example, most UV-visible spectrophotometers and virtually all IR spectrophotometers use reflective gratings. In addition, HPLC detectors frequently use a concave holographic reflective grating in their optical system.


Each line ruled on the grating, when illuminated, reflects light and gives rise to a tiny spectrum. An array of parallel wave fronts are formed that reinforce those wavelengths in phase and cancel those not in phase. The net result is a uniform linear spectrum. Some instruments contain diffraction gratings that produce spectral bandwidths of 20 nm or more; higher-priced instruments may have a resolution of 0.5 nm or less.


The flat surface grating discussed previously is called a plane transmission grating. Lines are engraved on the surface of a mirror, which may be a polished metal slab or a glass plate on which a thin, metallic film has been deposited. A grating may also be ruled at a specified angle, so that a maximum fraction of the radiant energy is directed into wavelengths diffracted at a selected angle. This type of grating is called an echelette and is said to have been given a blaze at a particular angle or to have been blazed at a certain wavelength (e.g., 250 nm).


Selection of a Wavelength Isolation Device: The type of monochromator chosen depends on the analytical purpose for which it is to be used. For example, narrow spectral bandwidths are required in spectrophotometers for resolving and identifying sharp absorption peaks that are closely adjacent. Lack of agreement with Beer’s law will occur when a part of the spectral energy transmitted by the monochromator is not absorbed by the substance being measured. This is more commonly observed with wide-bandpass instruments. In practice, an increase in absorbance and improved linearity with concentration are usually observed with instruments that operate at narrower bandwidths of light. This is especially true for substances that exhibit a sharp peak of absorption.


The natural bandwidth of an absorbing substance is defined as “the bandwidth of the spectral absorbance curve at a point equal to one half of the maximum absorbance.” As a general rule, for peak absorbance readings to be within 99.5% of true values, the spectral bandwidth should not exceed 10% of the natural bandwidth. For example, many chemistry procedures used in the clinical laboratory produce an absorbing species for which the natural bandwidth ranges from 40 to over 200 nm. The natural bandwidth of NADH is 58 nm (λmax = 339 nm). Therefore, for accurate measurements of this compound, a spectral bandwidth of 6 nm or less should be used.


In practice, the wavelength selected is usually at the peak of maximum absorbance to attain the maximum measurement; however, it may be desirable to choose another wavelength to minimize interfering substances. For example, turbidity readings on a spectrophotometer are greater in the blue region than in the red region of the spectrum, but the latter region is chosen for turbidity measurements to avoid absorption of light by bilirubin (460 nm) or hemoglobin (417 and 575 nm). The absorbing species developed in the alkaline picrate procedure for creatinine produces a relatively flat peak in the visible region of the spectrum at approximately 480 nm, but the reagent blank itself absorbs light strongly below 500 nm. A compromise is made by selecting a wavelength at 520 nm to minimize the contribution of the blank. Blank readings should, of course, be kept to a minimum. A small difference between two large numbers is subject to greater uncertainty; hence minimizing absorbance of the blank improves precision and accuracy. The linear working range of a method can be expanded by not measuring at the peak absorbance. However, measurements should not be taken on the steep slope of an absorption curve, because a slight error in wavelength adjustment would introduce a significant error in absorbance readings.


Cuvets

A cuvet (also often termed a cuvette) is a small vessel used to hold a liquid sample to be analyzed in the light path of a spectrometer. Cuvets may be round, square, or rectangular and are constructed from glass, silica (quartz), or plastic. Square or rectangular cuvets have plane-parallel optical surfaces and a constant light path. The most popular have a 1.0-cm light path, held to close tolerances. Ordinary borosilicate glass or plastic cuvets are suitable for measurements in the visible portion of the spectrum. For readings below 340 nm, however, quartz cells are usually required. Some plastic cells have good clarity in both the visible and UV range but can present problems related to tolerances, cleaning, etching by solvents, and temperature deformations. Many of the plastic cuvets are designed for disposable, single-use applications. However, in many clinical analyzers, cuvets are cleaned and reused many times before optical degradation requires them to be replaced.


Cuvets must be clean and optically clear, because etching or deposits on the surface affect absorbance values. Cuvets used in the visible range are cleaned by copious rinsing with tap water and distilled water. Alkaline solutions should not be left standing in cuvets for prolonged periods, because alkali slowly dissolves glass and produces etching. Cuvets may be cleaned in mild detergent or soaked in a mixture of concentrated HCl : water : ethanol (1 : 3 : 4). Cuvets should never be soaked in dichromate cleaning solution, because the solution is hazardous and tends to adsorb onto and discolor the glass.


Cuvets used for measurements in the UV region should be handled with special care. Invisible scratches, fingerprints, or residual traces of previously measured substances may be present and may absorb significantly. A good practice is to fill all such cuvets with distilled water and measure the absorbance for each against a reference blank over the wavelengths to be used. This value should be essentially zero.


Photodetectors

A photodetector is a device that converts light into an electric signal that is proportional to the number of photons striking its photosensitive surface. The photomultiplier tube is a commonly used photodetector for measuring light intensity in the UV and visible regions of the spectrum. Alternatively, photodiodes are solid-state devices that are also used in modern instruments. In older instruments, barrier layer cells (also known as photovoltaic cells) were used as photodetectors, because they were rugged and less expensive.


Photomultiplier Tubes: A photomultiplier tube (PMT) contains (1) a cathode, (2) a light-sensitive metal, and (3) a series of dynodes, all of which are enclosed in an evacuated glass enclosure. As many as 10 to 15 stages or dynodes are present in common photomultipliers. Photons that strike the photoemissive cathode emit electrons that are accelerated toward the dynodes. Additional electrons are generated at each dynode. Depending on the number of dynodes and the accelerating voltage, the cascading effect creates 105 to 107 electrons for each photon hitting the first cathode. This amplified signal is finally collected at the anode, where it can be measured.


When such a tube is operated, voltage is applied between the photocathode and each successive stage. The normal incremental increase in voltage at each photomultiplier stage is from 50 to 100 V larger than that of the previous stage (Figure 10-5). Typically, a conventional PMT tube has approximately 1500 V applied to it.


PMTs have (1) extremely rapid response times, (2) are very sensitive, and (3) are slow to fatigue. Because these tubes are very sensitive and have a rapid response, they must be carefully shielded from all stray light. A PMT with the voltage applied should never be exposed to room light because it will burn out. The rapid response times of PMTs are needed when a spectrophotometer is being used to determine an absorption spectrum of a compound. Also, PMTs are sensitive over a wide range of wavelengths.


When voltage is applied to a PMT in the absence of any incident light, some current is usually produced. This current is called dark current. It is desirable to have the dark current of a PMT at its lowest level because this current appears as background noise.


Photodiodes: Photodiodes are solid-state photodetectors that are fabricated from photosensitive semiconductor materials such as (1) silicon, (2) gallium arsenide, (3) indium antimonide, (4) indium arsenide, (5) lead selenide, and (6) lead sulfide. These materials absorb light over a characteristic wavelength range (e.g., 250 nm to 1100 nm for silicon). Their development and use as detectors in spectrophotometers have resulted in instruments capable of measuring light at a multitude of wavelengths. When a photodetector consists of two-dimensional arrays of diodes, it is known as a photodiode array. Each photodetector within the array responds to a specific wavelength. For example, photodiode arrays have been designed to have a 2-nm resolution per diode from 200 to 340 nm, and a 1-nm resolution per diode from 340 to 800 nm.


In practice, all diodes are initially charged to 5 V, and they discharge when they are struck by light. Each diode then is sequentially scanned and recharged to 5 V. The amount of energy required for recharging is proportional to the quantity of light striking that diode. Because scan time for all diodes is in the millisecond range, many scans are typically taken. The resultant data is processed using a variety of algorithms, including signal averaging, background subtraction, and correction for scattered light. Consequently, an optical spectrum of an ongoing chemical reaction can be monitored as a function of time with a high degree of resolution and accuracy.


Readout Devices

Electrical energy from a detector is displayed on some type of meter or readout system. In the past, analog devices were widely used as readout devices in spectrophotometers. However, they have been replaced by digital readout devices that provide a visual numeric display of absorbance or converted values of concentrations. Spectrophotometers may be equipped with recorders in addition to or instead of a digital display. These are synchronized to provide line traces of transmittance or absorbance as a function of time or wavelength. When a continuous tracing of absorbance versus wavelength is recorded, the resultant display is called an absorption spectrum. If a substance absorbs light, distinct peaks of absorbance will be observed (see Figure 10-1). Measuring the absorption spectra of an unknown sample and comparing them with spectra from known compounds is very useful for qualitative purposes. For example, this type of procedure is especially useful for identification of drugs that absorb in the UV region.


Performance Parameters


In most spectrophotometric analytical procedures, the absorbance of an unknown is compared directly with that of a calibrator or a series of calibrators. Under these circumstances, minor errors in wavelength calibration, variation in spectral bandwidths, and the presence of stray light are compensated for and usually do not contribute serious errors. Use of a series of calibrators covering a wide range of concentrations also provides a measure of linearity (i.e., agreement with Beer’s law for a given procedure and instrument). When calculations are based on published or previously determined values for molar absorptivities or absorption coefficients, however, the spectrophotometer must be checked more rigorously. Performance verification of spectrophotometers on a periodic basis also improves reliability of routine comparative analyses.


To verify that a spectrophotometer is performing satisfactorily, the device must be shown to be able to operate within the specifications provided for it. Parameters to be tested include (1) wavelength accuracy, (2) spectral bandwidth, (3) stray light, (4) linearity, and (5) photometric accuracy.


The National Institute of Standards and Technology (NIST) provides several standard reference materials (SRMs) for spectrophotometry that are useful in the calibration or verification of the performance of photometers or spectrophotometers (e.g., SRM 930e is for the verification and calibration of the transmittance and absorbance scales of visible absorption spectrometers) (http://www.nist.gov, accessed March 23, 2011).


The Institute for Reference Materials and Measurements (IRMM) belongs to the European Commission and provides reference materials for verification of the performance of photometers or spectrophotometers. These materials are listed in the IRMM ERM Reference Materials Catalogue (http://www.irmm.jrc.be, accessed March 23, 2011).


Wavelength Calibration

With narrow-spectral-bandwidth instruments, a holmium oxide glass may be scanned over the range of 280 to 650 nm. This material shows very sharp absorbance peaks at defined wavelengths, and the operator may compare the wavelength scale readings that produce maximum absorbance with established values. If compared values do not coincide, a calibration correction table can be constructed to relate scale readings to true wavelengths. A typical spectral transmittance curve for holmium oxide glass is shown in Figure 10-6. Selected absorption peaks for this filter, which are suitable for calibration purposes, occur at the following wavelengths: 279.3, 418.5, 287.6, 536.4, 333.8, 637.5, and 360.8 nm. Solutions of holmium oxide in dilute perchloric acid have also been recommended and may be used with any spectrophotometer.


With broader-bandpass instruments, a didymium filter may be used to verify wavelength settings. This filter should show a minimum percent transmittance at 530 nm against an air blank (Figure 10-7). Because didymium has several absorption peaks, the setting should be verified grossly by visual examination of transmitted light. This light should appear green at 530 nm.


Stray Light

Stray light, in general terms, is radiation of wavelengths outside the narrow band nominally transmitted by the monochromator that hits the detector. A perfect monochromator would transmit light only within its bandpass. In practice, scattering and diffraction inside the monochromator introduce light of other wavelengths into the exit beam. This light is further modified by other components of the spectrophotometer and by the sample itself. Stray light is usually defined as a ratio or percent to the total detected light.


Other sources of unwanted light include light leaks and fluorescence of the sample. Light leaks should be excluded by covering the cell compartments. Light arising from fluorescence can increase the signal to the detector and cause an apparent decrease in absorbance. These sources of light are not included in the usual definition of stray light.


The major effect of stray light on the performance of a spectrophotometer is an absorbance error, especially in the upper end of the absorbance range of the instrument. Most spectrophotometers are equipped with one or more stray-light filters. Thus a blue filter is used with a tungsten lamp for wavelength settings below about 400 nm. When the spectrophotometer is set to 350 nm, for example, most of the stray light is of wavelengths in the visible range. The blue filter absorbs most of the visible light but transmits well in this UV portion of the spectrum. By analogy, a red filter is used for wavelengths in the range of 650 to 800 nm.


Cutoff filters are satisfactory for the detection of stray light. These may be of glass, similar to the stray-light filters discussed previously, and produce a sharp cut in the spectrum with almost complete absorption on one side and high transmittance on the other. Liquid cutoff filters are satisfactory and convenient in the UV range, where stray light is usually more of a problem. A 50-g/L aqueous solution of sodium nitrite should show essentially 0% T when read against water over the range of 300 to 385 nm. Acetone, read against water, should show 0% T over the range of 250 to 320 nm.

Stay updated, free articles. Join our Telegram channel

Nov 27, 2016 | Posted by in GENERAL & FAMILY MEDICINE | Comments Off on Optical Techniques

Full access? Get Clinical Tree

Get Clinical Tree app for offline access