Chapter 5 Nutrition
Introduction
Diet and disease are interrelated in many ways:
 Excess energy intake contributes to a number of diseases, including ischaemic heart disease and diabetes, particularly when high in animal (saturated) fat content.

 The proportion of processed foods eaten may affect the development of disease. Some processed convenience foods have a high sugar and fat content and therefore predispose to dental caries and obesity, respectively. They also have a low fibre content, and dietary fibre can help in the prevention of a number of diseases (see p. 199).

Water and electrolyte balance
Water and electrolyte balance is dealt with fully in Chapter 13. About 1 L of water is required in the daily diet to balance insensible losses, but much more is usually drunk, the kidneys being able to excrete large quantities. The daily RNI for sodium is 70 mmol (1.6 g) but daily sodium intake varies in the range 90–440 mmol (2–10 g). These are needlessly high intakes of sodium which are thought by some to play a role in causing hypertension (see p. 778).
Dietary requirements
Energy
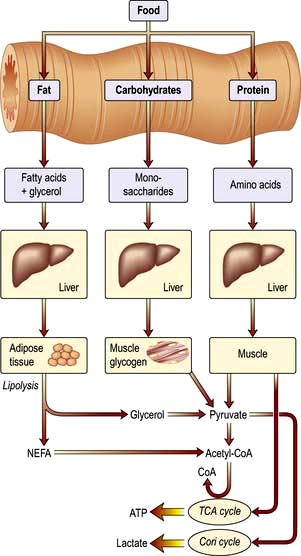
Food is necessary to provide the body with energy (Fig. 5.1). The SI unit of energy is the joule (J), and 1 kJ = 0.239 kcal. The conversion factor of 4.2 kJ, equivalent to 1.00 kcal, is used in clinical nutrition.
Energy requirements


Energy expenditure
Daily energy expenditure (Fig. 5.2) is the sum of:


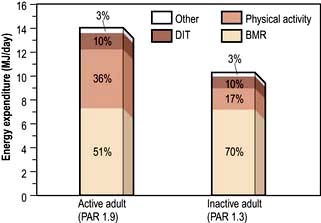
Basal metabolic rate. The BMR can be calculated by measuring oxygen consumption and CO2 production, but it is more usually taken from standardized tables (Table 5.1) that only require knowledge of the subject’s age, weight and sex.
Table 5.1 Equations for the prediction of basal metabolic rate (in MJ/day)
| Age range (years) | Equation for predicting BMRa | 95% confidence limits |
|---|---|---|
Men |
|
|
10–17 | 0.0740 × (wt) + 2.754 | ±0.88 |
18–29 | 0.0630 × (wt) + 2.896 | ±1.28 |
30–59 | 0.0480 × (wt) + 3.653 | ±1.40 |
60–74 | 0.0499 × (wt) + 2.930 | N/A |
75+ | 0.0350 × (wt) + 3.434 | N/A |
Women |
|
|
10–17 | 0.0560 × (wt) + 2.898 | ±0.94 |
18–29 | 0.0620 × (wt) + 2.036 | ±1.00 |
30–59 | 0.0340 × (wt) + 3.538 | ±0.94 |
60–74 | 0.0386 × (wt) + 2.875 | N/A |
75+ | 0.0410 × (wt) + 2.610 | N/A |
Data from Department of Health, 1991. BMR, basal metabolic rate. aBodyweight (wt) in kg.
Physical activity. The physical activity ratio (PAR) is expressed as multiples of the BMR for both occupational and non-occupational activities of varying intensities (Table 5.2).
Table 5.2 Physical activity ratio (PAR) for various activities (expressed as multiples of BMR)
| PAR | |
|---|---|
Occupational activity |
|
Professional/housewife | 1.7 |
Domestic helper/sales person | 2.7 |
Labourer | 3.0 |
Non-occupational activity |
|
Reading/eating | 1.2 |
Household/cooking | 2.1 |
Gardening/golf | 3.7 |
Jogging/swimming/football | 6.9 |

In the UK, the estimated ‘average’ daily energy requirement is:


Energy stores
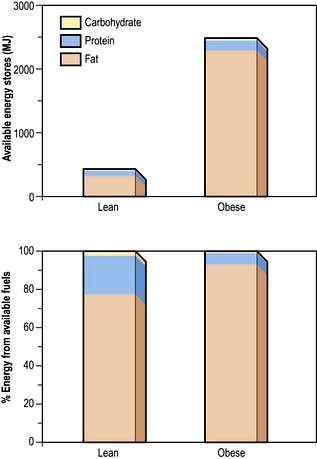
Although virtually all body fat and glycogen are available for oxidation, less than half the protein is available for oxidation. Figure 5.3 shows that fat accounts for the largest reserves of energy in both lean and obese subjects. The size of the stores determines survival during starvation.
Protein
Grams of protein required = Urinary nitrogen × 6.25 (most proteins contain about 16% of nitrogen).
Protein contains many amino acids:
 Indispensable (essential): there are nine amino acids that cannot be synthesized and must be provided in the diet: tryptophan, histidine, methionine, threonine, isoleucine, valine, phenylalanine, lysine, leucine.

Role of amino acids
 Glutamine is quantitatively the most significant in the circulation and in inter-organ exchange.

 Homocysteine is a sulphur-containing amino acid which is derived from methionine in the diet. A raised plasma concentration is an independent risk factor for vascular disease (see p. 728).
 Amino acids are utilized to synthesize products other than protein or urea. For example:
Fat
Dietary fat is chiefly in the form of triglycerides, which are esters of glycerol and free fatty acids. Fatty acids vary in chain length and in saturation (Table 5.3). The hydrogen molecules related to the double bonds can be in the cis or the trans position; most natural fatty acids in food are in the cis position (Box 5.1).
Table 5.3 The main fatty acids in foods
| Fatty acid | No. of carbon atoms : No. of double bonds | Position of double bondsa |
|---|---|---|
Saturated |
|
|
Lauric | C12:0 |
|
Myristic | C14:0 |
|
Palmitic | C16:0 |
|
Stearic | C18:0 |
|
Monounsaturated |
|
|
Oleic | C18:1 | (n-9) |
Elaidic | C18:1 | (n-9 trans) |
Polyunsaturated |
|
|
Linoleic | C18:2 | (n-6) |
α-Linolenic | C18:3 | (n-3) |
Arachidonic | C20:4 | (n-6) |
Eicosapentaenoic | C20:5 | (n-3) |
Docosahexaenoic | C22:6 | (n-3) |
a Positions of the double bonds (designated either n as here or ω) are shown counted from the methyl end of the molecule. All double bonds are in the cis position except that marked trans.
 Box 5.1
Dietary sources of fatty acids
| Type of acid | Sources |
|---|---|
Saturated fatty acids | Mainly animal fat |
n-6 fatty acids | Vegetable oils and other plant foods |
n-3 fatty acids | Vegetable foods, rapeseed oil, fish oils |
trans fatty acids | Hydrogenated fat or oils, e.g. in margarine, cakes, biscuits |


Recommendations for fat intake
The current recommendations for fat intake for the UK are shown in Box 5.2.
 Box 5.2
Recommended healthy dietary intake
| Dietary component | Approximate amounts given as % of total energy unless otherwise stated | General hints |
|---|---|---|
Total carbohydrate | 55 (55–75) | Increase fruit, vegetables, beans, pasta, bread |
Free sugar | 10 (<10) | Decrease sugary drinks |
Protein | 15 (10–15) | Decrease red meat (see fat below) |
Total fat | 30 (15–30) | Increase vegetable (including olive oil) and fish oil and decrease animal fat |
Saturated fatty acids | 10 (<10) |
|
Cis-mono unsaturated fatty acids | 20 | Mainly oleic acid (n-6) |
Cis-polyunsaturated fatty acids | 6 | Both n-6 and n-3 PUFA |
Approximate amounts |
|
|
Cholesterol | <300 (<300) mg/day | Decrease meat and eggs |
Salt | <6 (<5) g/day | Decrease prepared meats and do not add extra salt to food |
Total dietary fibre | 30 (>25) g/day | Increase fruit and vegetables and wholegrain foods |
Values in parentheses are goals for the intake of populations, as given by the WHO (including populations who are already on low-fat diets). Some of the extreme ranges are not realistic short-term goals for developed countries, e.g. 75% of total energy from carbohydrate and 15% fat. When total energy intake is 2500 kcal (10 500 kJ) per day, 55% of intake comes from carbohydrate (344 g, i.e. 1376 kcal (5579 kJ)) and 30% from fat (83 g, i.e. 747 kcal (3137 kJ)).
Cholesterol
Cholesterol is found in all animal products. Eggs are particularly rich in cholesterol, which is virtually absent from plants. The average daily intake in the UK is 300–500 mg. Cholesterol is also synthesized (see p. 306) and only very high or low dietary intakes will significantly affect blood levels.


Health promotion
Box 5.2 suggests the composition of the ‘ideal healthy diet’. The values given are based on the principle of:
 reducing total fat in the diet, particularly saturated fat
 increasing consumption of fish which contain n-3 (or ω-3) polyunsaturated fatty acids

Nutrient goals and dietary guidelines
 Nutrient goals refer to the national intakes of nutrients that are considered appropriate for optimal health in the population.
 Dietary guidelines refer to the dietary methods used to achieve these goals.
FURTHER READING
Beaglehole R, Horton R. Chronic diseases: global action must match global evidence. Lancet 2010; 376:1619–1621.
Elia M, Cummings, JH. Physiological aspects of energy metabolism and gastrointestinal effects of carbohydrates. Eur J Clin Nutr 2007; (Suppl 1):SO40–SO74.
Institute of Medicine. Dietary reference intakes for energy, carbohydrate, fiber, fat, fatty acids, protein, and amino acids. Washington, DC: The National Academies Press; 2005.
World Health Organization. Protein and amino acid requirements in human nutrition WHO Technical Report Series 935. Report of a Joint WHO/FAO/UNU Expert Consultation United Nations. Geneva: WHO; 2007.
WHO/FAO Expert Consultation. Diet, nutrition and the prevention of chronic diseases. Geneva: WHO; 2003.
Zampelas A. Eicosapentaenoic acid (EPA) from highly concentrated n-3 fatty acid ethyl esters is incorporated into advanced atherosclerotic plaques and higher plaque EPA is associated with decreased plaque inflammation and increased stability. Atherosclerosis 2010; 212:34–35.
Protein-energy malnutrition (PEM)
Developed countries
Starvation uncomplicated by disease is relatively uncommon in developed countries, although some degree of undernourishment is seen in very poor areas. Most nutritional problems occurring in the population at large are due to eating wrong combinations of foodstuffs, such as an excess of refined carbohydrate or a diet low in fresh vegetables. Undernourishment associated with disease is common in hospitals and nursing homes, and Table 5.4 gives a list of conditions in which malnutrition is often seen. Surgical complications, with sepsis, are a common cause. Many patients are admitted to hospital undernourished, and a variety of chronic conditions predispose to this state (Table 5.5).
Table 5.4 Common conditions associated with protein-energy malnutrition
| Sepsis | Dementia |
|---|---|
Trauma | Malignancy |
Surgery, particularly of GI tract with complications | Any very ill patient |
GI disease, particularly involving the small bowel | Severe chronic inflammatory diseases |
| Psychosocial: poverty, social isolation, anorexia nervosa, depression |
Table 5.5 Nutritional consequences of disease and the underlying risk factors (physical/psychosocial problems)
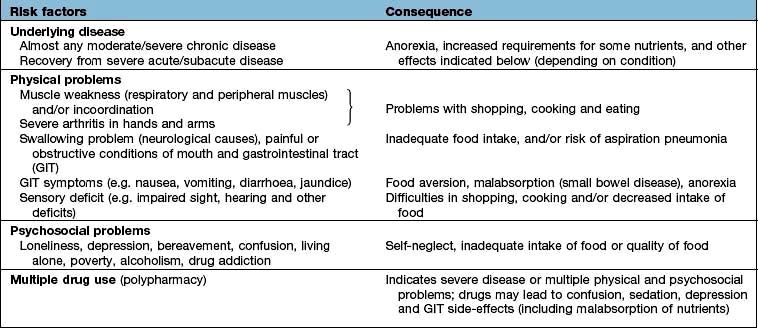 |
The majority of the weight loss, leading to malnutrition, is due to poor intake secondary to the anorexia associated with the underlying condition. Disease may also contribute by causing malabsorption and increased catabolism, which is mediated by complex changes in cytokines, hormones, side-effects of drugs, and immobility. The elderly are particularly at risk of malnutrition because they often suffer from diseases and psychosocial problems such as social isolation or bereavement (Table 5.5).
Pathophysiology of starvation (Fig. 5.4)
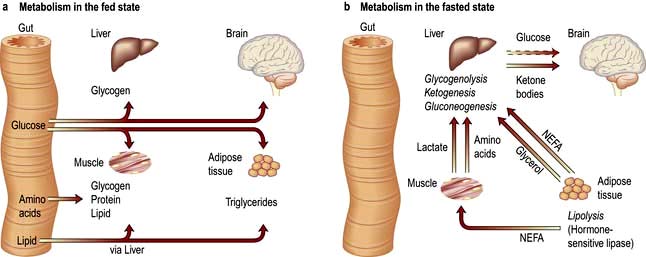
The metabolic response to prolonged starvation differs between lean and obese individuals. One of the major differences concerns the proportion of energy derived from protein oxidation, which determines the proportion of weight loss from lean tissues. This proportion may be up to three times smaller in obese subjects than lean subjects. It can be regarded as an adaptation which depends on the composition of the initial reserves (Fig. 5.3). This means that deterioration in body function is more rapid in lean subjects. Furthermore, survival time is much less in lean subjects (~2 months), compared to the obese (can be at least several months).
Regulation of metabolism
 Circulating substrate concentrations. The uptake and metabolism of ketone bodies, which serve as the major fuel for the brain during prolonged starvation, is primarily determined by the circulatory concentration which can increase up to 5 mmol/L or more. The liver is responsible for producing ketone bodies, the production of which is in turn controlled by the availability of fatty acids derived from adipose tissue. Substrates may also compete with each other for metabolism, for example glucose competes with non-esterified fatty acids for uptake and metabolism in muscle and heart (the glucose-fatty acid cycle) and this is independent of hormones.


Clinical features
Patients are sometimes seen with loss of weight or malnutrition as the primary symptom (failure to thrive in children). Mostly, however, malnourishment is only seen as an accompaniment of some other disease process, such as malignancy. Severe malnutrition is seen mainly with advanced organic disease or after surgical procedures followed by complications. Three key features which help in the detection of chronic protein-energy malnutrition (PEM) in adults are listed in Box 5.3.
 Box 5.3
Key features in detection of chronic protein-energy malnutrition (PEM) in developed countries
In patients with oedema or dehydration the BMI may be somewhat misleading.
2. Weight loss in previous 3–6 months: >10%, high risk; 5–10%, possible risk; <5% low/no risk of developing PEM.
3. Acute disease effect: diseases that have resulted or are likely to result in no dietary intake for >5 days are associated with a high risk of malnutrition (e.g. prolonged unconsciousness, persistent swallowing problems after a stroke, or prolonged ileus after abdominal surgery).
Other factors that may suggest PEM include:
 History of decreased food intake/loss of appetite
 Clothes becoming loosely fitting (weight loss) and a general appearance indicating obvious wasting
 Physical and psychosocial disturbances likely to have contributed to the weight loss.
The factors listed in Box 5.3 act as a link between detection and management (Fig. 5.5, the ‘Malnutrition Universal Screening Tool’). If the underlying physical or psychosocial problems are not adequately addressed, treatment may not be successful.
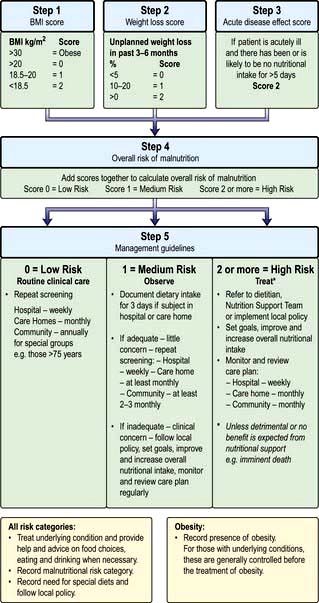
Figure 5.5 ‘Malnutrition Universal Screening Tool’ (‘MUST’)
(with permission from the British Association for Parenteral and Enteral Nutrition (BAPEN), at: http://www.bapen.org.uk).
PEM leads to a depression of the immunological defence mechanism, resulting in a decreased resistance to infection. It also detrimentally affects muscle strength and fatigue, reproductive function (e.g. in anorexia nervosa, which is common in adolescent girls; p. 1188), wound healing, and psychological function (depression, anxiety, hypochondriasis, loss of libido).
In children, growth failure is a key element in the diagnosis of PEM. New WHO standards for optimal growth in children 0–4 years have been adopted by developing and developed countries. They aim to reflect optimal rather than prevailing growth in both developed and developing countries, since they involved a healthy pregnancy and children born to non-smoking, relatively affluent mothers who breast-fed their children exclusively or predominantly for the first 6 months of life. The general principles of management of severe PEM in children are similar in developed and developing countries but resources are required to manage the problems once identified (see p. 205).
Treatment
When malnutrition is obvious and the underlying disease cannot be corrected at once, some form of nutritional support is necessary (see also pp. 221, 223). Nutrition should be given enterally if the gastrointestinal tract is functioning adequately. This can most easily be done by encouraging the patient to eat more often and by giving a high-calorie supplement. If this is not possible, a liquefied diet may be given intragastrically via a fine-bore tube or by a percutaneous endoscopic gastrostomy (PEG). If both of these measures fail, parenteral nutrition is given.
Developing countries
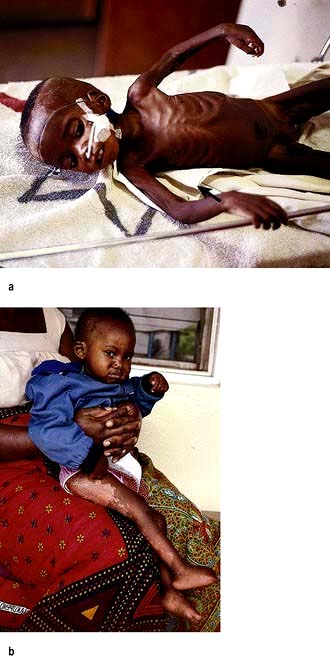
 Kwashiorkor occurs typically in a young child displaced from breast-feeding by a new baby. It is often precipitated by infections such as measles, malaria and diarrhoeal illnesses. The child is apathetic and lethargic with severe anorexia. There is generalized oedema with skin pigmentation and thickening (Fig. 5.6b). The hair is dry, sparse and may become reddish or yellow in colour. The abdomen is distended owing to hepatomegaly and/or ascites. The serum albumin is always low. The exact cause is unknown, but theories related to diet (low in protein, and high in carbohydrate) and free radical damage in the presence of inadequate antioxidant defences have been proposed.
 Marasmus is the childhood form of starvation, which is associated with obvious wasting. The child looks emaciated, there is obvious muscle wasting and loss of body fat. There is no oedema. The hair is thin and dry (Fig. 5.6a). The child is not so apathetic or anorexic as with kwashiorkor. Diarrhoea is frequently present and signs of infection must be looked for carefully.
A classification of severe malnutrition by the World Health Organization (WHO) (Table 5.6) makes no distinction between kwashiorkor and marasmus, because their approach to treatment is similar. The WHO classification of chronic undernutrition in children is based on standard deviation (SD) scores. Thus, children with an SD score between −2 and −3 (between 3 and 2 standard deviation scores below the median – corresponding to a value between 0.13 and 2.3 centile) can be regarded as being at moderate risk of undernutrition, and below an SD score of −3, of severe malnutrition. A low weight-for-height is a measure of thinness (wasting when pathological) and a low height-for-age is a measure of shortness (stunting when pathological). Those with oedema and clinical signs of severe malnutrition are classified as having oedematous malnutrition.
Table 5.6 Classification of childhood malnutrition
| Moderate malnutrition | Severe malnutritiona | |
|---|---|---|
Symmetrical oedema | No | Yes: oedematous malnutritionb |
Weight-for-height SD score | −3 to −2 (70–79%)c | |
Height-for-age SD score | −3 to −2 (85–89%)c | <−3 (<85%)c (severe stunting) |
a The diagnoses are not mutually exclusive.
b Older classifications use the terms kwashiorkor and marasmic-kwashiorkor instead.
c Percentage of the median National Centre for Health Statistics/WHO reference.
d Called marasmus (without oedema) in the Wellcome classification and grade II in the Gomez classification.
Investigations
These are not always practicable in certain settings in the developing world.

 Stools should be examined for parasitic infestations.
 Chest X-ray – tuberculosis is common and is easily missed if a chest X-ray is not performed.
Resuscitation and stabilization
The severely ill child will require:
 Correction of fluid and electrolyte abnormalities, but intravenous therapy should be avoided if possible because of the danger of fluid overload
 Treatment of shock with oxygen

Infection is common (Box 5.4). Diarrhoea is often due to bacterial or protozoal overgrowth; metronidazole is very effective and is often given routinely. Parasites are also common and, as facilities for stool examination are usually not available, mebendazole 100 mg twice daily should be given for 3 days. In high-risk areas, antimalarial therapy is given.
 Box 5.4


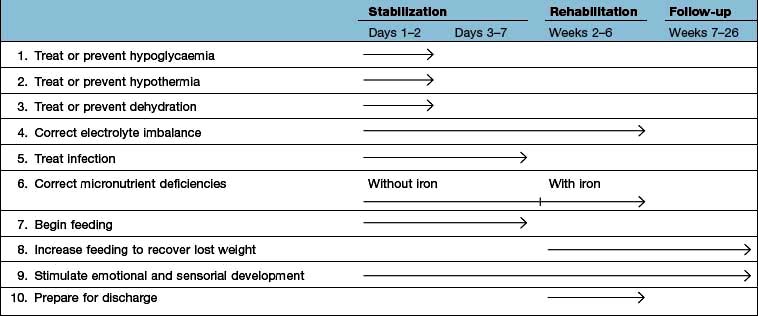
Large doses of vitamin A are also given because deficiency of this vitamin is common. After the initial resuscitation, further stabilization over the next few days is undertaken, as indicated in Table 5.7.
Table 5.7 Timeframe for the management of the child with severe malnutrition (the 10-step approach recommended by the WHO)
 |
Prevention
Prevention of PEM depends not only on adequate nutrients being available but also on education of both governments and individuals in the importance of good nutrition and immunization (Box 5.5). Short-term programmes are useful for acute shortages of food, but long-term programmes involving improved agriculture are equally necessary. Bad feeding practices and infections are more prevalent than actual shortage of food in many areas of the world. However, good surveillance is necessary to avoid periods of famine.
 Box 5.5


FURTHER READING
Bhutta ZA. Addressing severe malnutrition where it matters. Lancet 2009; 374:94–96.
Collins S, Dent N, Binns P et al. Management of severe acute malnutrition in children. Lancet 2006; 368:1992–2000.
Collins S, Sadler K, Dent N et al. Key issues in the success of community-based management of severe malnutrition. Food Nutr Bull 2006; 27:S49–S82.
Elia M, Russell CA, Stratton RJ. Malnutrition in the UK: Policies to address the problem. Proc Nutr Soc 2010; 69:470–476.
Kerac M, Egan R, Mayer S et al. New WHO growth standards: roll-out needs more resources. Lancet 2009; 374:100–102.
Stratton RJ, Elia M. Encouraging appropriate, evidence-based use of oral nutritional supplements. Proc Nutr Soc 2010; 69:477–487.
Stratton RJ, Elia M. A review of reviews: a new look at the evidence for oral nutritional supplements in clinical practice. Clin Nutr Suppl 2007; 2:5–23.
Wright CM, Williams AF, Ellman D et al. Using the new UK-WHO growth charts. BMJ 2010; 340:647–650. (The charts and supporting materials can be downloaded from: www.growthcharts.rcpch.ac.uk)
Vitamins
Deficiencies due to inadequate intake associated with PEM (Table 5.8) are commonly seen in the developing countries. This is not, however, invariable. For example, vitamin A deficiency is not seen in Jamaica, but is common in PEM in Hyderabad, India. In the West, deficiency of vitamins is less common but prominent in the specific groups shown in Table 5.9. The widespread use of vitamins as ‘tonics’ is unnecessary and should be discouraged. Toxicity from excess fat-soluble vitamins is occasionally seen.
Table 5.8 Fat-soluble and water-soluble vitamins: UK reference nutrient intake (RNI) and lower reference nutrient intake (LRNI) for men aged 19–50 yearsa
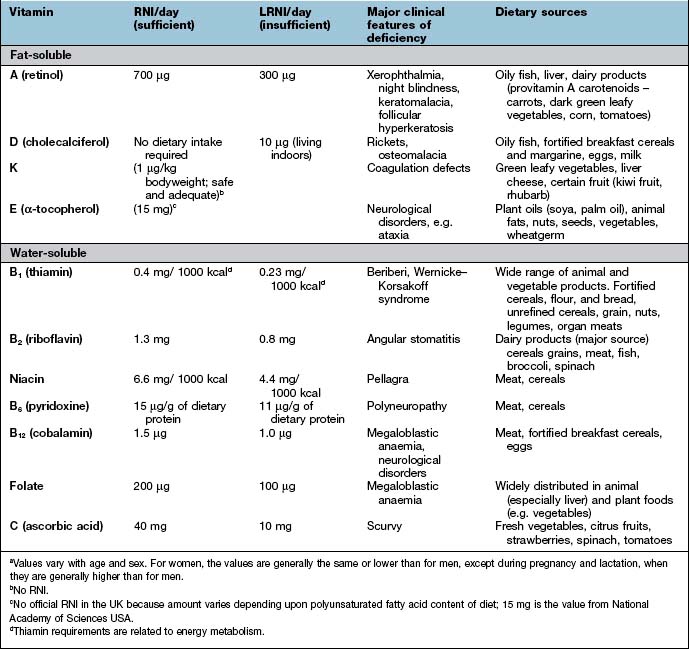
Table 5.9 Some causes of vitamin deficiency in developed countries
Fat-soluble vitamins
Vitamin A
Function
 Retinaldehyde in its cis form is found in the opsin proteins in the rods (rhodopsin) and cones (iodopsin) of the retina (p. 1055). Light causes retinaldehyde to change to its trans isomer, and this leads to changes in membrane potentials that are transmitted to the brain.
 Retinol and retinoic acid are involved in the control of cell proliferation and differentiation.
 Retinyl phosphate is a cofactor in the synthesis of most glycoproteins containing mannose.
Vitamin A deficiency
Xerophthalmia has been classified by the WHO (Table 5.10). Impaired adaptation followed by night blindness is the first effect. There is dryness and thickening of the conjunctiva and the cornea (xerophthalmia occurs as a result of keratinization). Bitot’s spots – white plaques of keratinized epithelial cells – are found on the conjunctiva of young children with vitamin A deficiency. These spots can, however, be seen without vitamin A deficiency, possibly caused by exposure. Corneal softening, ulceration and dissolution (keratomalacia) eventually occur, superimposed infection is a frequent accompaniment and both lead to blindness. In PEM, retinol-binding protein along with other proteins is reduced. This suggests vitamin A deficiency, although body stores are not necessarily reduced.
Table 5.10 Classification of xerophthalmia by ocular signs
| Ocular signs | Classification |
|---|---|
Night blindness | XN |
Conjunctival xerosis | XIA |
Bitot’s spot | X2 |
Corneal xerosis | X2 |
Corneal ulceration/keratomalacia < | X3A |
Corneal ulceration/keratomalacia > | X3B |
Corneal scar | XS |
Xerophthalmic fundus | XF |
 corneal surface
 corneal surface
From WHO/UNICEF/IVACG 1988. X, xerophthalmia.

Vitamin A deficiency. Blindness due to vitamin A deficiency and corneal scarring.
(Courtesy of Ehrnstrom P. In: Bolognia J, Jorrizzo J, Rapini R (eds). Dermatology, 2nd edn. St Louis: Mosby; 2008: Fig. 51.6.)
Stay updated, free articles. Join our Telegram channel

Full access? Get Clinical Tree


