Fig. 7.1
Preoperative nomogram based on 1978 patients treated by two high-volume surgeons between 1987 and 2003 for predicting the 10-year probability of freedom from prostate-specific antigen ( PSA) recurrence after radical prostatectomy using preoperative PSA level, number of positive and negative biopsy cores, clinical stage, and primary and secondary biopsy Gleason grade. The predictions of the model are adjusted for the year of surgery and the model assumes patients are treated in 2003 (the most recent year of treatment of patients included in this model). (Used with permission from [15])
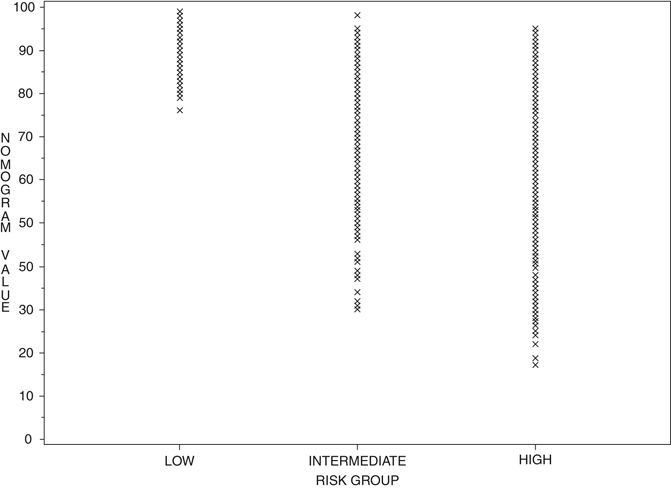
The advantage of nomograms is that they incorporate all relevant continuous predictive factors for individual patients, thus providing a more accurate prediction than models based on risk grouping. They usually also surpass clinical experts at outcome’s prediction by calculating probabilities in a uniform fashion. The superior performance has been shown by several studies comparing nomograms to risk-grouping schemata, in part, due to substantial heterogeneity within risk group categories. A good example of the heterogeneity inherent in risk groups is shown in Fig. 7.2 where the 5-year progression-free probability (PFP) after radical prostatectomy was calculated for patients classified as low-, medium-, and high-risk using the criteria by D’Amico et al. [5]. The graph shows a substantial distribution of intermediate- and high-risk patients across the spectra of nomogram probabilities; clearly, it would be incorrect to call a patient “high-risk” if their likelihood of being free of cancer progression at 5 years exceeded 90 %. This highlights the substantial heterogeneity within risk group’s categories and as such, is useful for gauging the prognosis for that specific group of patients, not necessarily the individual patient. A nomogram should be able to be tailored to an individual patient, as this is what is most important to the patient, that is his individual prognosis not that of a group.


Fig. 7.2
Five-year progression-free probability after radical prostatectomy calculated by preoperative nomogram for patients classified as low-, intermediate-, and high-risk by D’Amico et al. based on an analysis of patients from the CaPSURE database. (Used with permission from [5])
A nomogram can be used to personalize the prediction of outcomes for an individual based on his unique characteristics. The complexity of nomograms over risk groups enhances the predictive accuracy for both the patient and the physician. While cumbersome to use in paper form (and nearly impossible to calculate in one’s head!), the availability of the nomograms in on-line web format in the public domain facilitates their use in the setting of a busy clinic (http://www.nomograms.org or htttp://www.clinicriskcalculators.org).
One way to illustrate the superior predictive performance of nomograms relative to risk groups is to compare several staging nomograms to the “Partin Tables.” The Partin tables take into account serum PSA (four categories), clinical stage (seven categories), and biopsy Gleason sum (five categories) to predict pathological stage of prostate cancer. Then the patient is assigned to one of the four mutually exclusive groups (organ confined, established extraprostatic extension (EPE), seminal vesicle invasion (SVI), or lymph node involvement (LNI)). In a review of our institution’s prostate cancer database, the predictive accuracy of the “Partin Tables” for predicting organ-confined disease, SVI, and LNI was 0.71, 0.72, and 0.74, respectively [6]. These tables underestimate the probability of EPE, since a substantial proportion of patients with lymph node metastases and SVI will also have EPE. A more accurate predictive model is done with having each variable as a continuous variable. Thus, PSA, clinical stage, and Gleason sum when modeled as a continuous variable had a concordance index for predicting organ-confined disease, SVI, and LNI of 0.74, 0.84, and 0.76, respectively (Bianco FJ Jr et al., unpublished data).
Some general principles need to be taken into consideration with designing a predictive model. First is discrimination, the model should accurately predict which patients will and will not reach the endpoint. Next calibration, the model should be able to make predictions that reflect actual outcomes. And finally, validation, the model should perform consistently when applied to different data sets. Careful consideration should be taken when determining the patient population that the model will be based on. The model should have an index patient that is representative of the general population to whom the model will be applied. The treatments being received by the cohort population should mirror those of the general population. There should be a built-in broad applicability to the model. Trying to define a very specific population or to model after a population with uncommon treatment modalities will limit the model’s application to future patients. A good predictive model should not only be based on enough cases to be able to reach specific endpoints, but also have an appropriate number of variables. The model should include variables that are statistically significant and those that are not statistically significant (if there is a strong clinical rationale for including them). Including only significant variables will result in falsely narrowed confidence intervals (CI) that make the model appear more accurate than it is, secondary to the inappropriately large influence exerted by these variables. A well-constructed model will repeatedly perform with similar accuracy when applied to heterogeneous novel populations, hence exemplify generalizability. Factors that diminish this concept are when a prognostic model’s data set is too small, not all the variables are recorded correctly or large portions missing, or too many variables are used. In the clinical setting, the value of a nomogram is when it is easy to use and it uses parameters that are routinely employed and reliable. The ease of use is important, because even though a model may be very accurate, if it proves cumbersome to use, then it loses its practicality in the clinical setting.
Kattan and colleagues developed nomograms based on Cox proportional hazards or logistic regression analysis modified by restricted cubic splines. The use of cubic splines has the benefit of being able to use continuous variable while maintaining a nonlinear relationship. When using unmodified regression models, they require variables to assume linear relationships, which is not ideal because it assumes that the weight assigned to incremental changes is the same across the spectrum. For example, a rise in PSA from 3 to 6 ng/mL would have the same impact as a rise from 303 to 306 ng/mL. In theory, machine learning modeling methods (e.g., artificial neural networks) may lead to enhanced predictive accuracy as they offer greater flexibility than traditional statistical methods. This is especially true if data sets contain highly predictive nonlinear or interactive effects. In spite of this, traditional statistical methods seem to perform as well as machine learning methods and provide the added advantage of reproducibility and interpretability through the generation of hazard ratios and tests of significance for the predictors.
A benefit of nomograms is that they maximize the available information in a data set, in return obtaining the most value out of each variable. An example is when looking at a Gleason score, as it may be further defined by the primary and secondary Gleason grades and then each may be used as independent variables, rather than using the Gleason score alone, especially since various combinations of primary/secondary Gleason grades can result in the same Gleason score (e.g., 3 + 4 = 7 and 4 + 3 = 7) yet reflect quite different disease states with different prognoses [7].
Many nomograms that predict cancer recurrence incorporate an important concept of how patients who receive secondary treatment before demonstrating disease progression are classified as treatment failures. As the secondary treatment was most likely triggered by an adverse feature associated with a high risk of recurrence or some evidence of recurrence, therefore it is presumed that the treatment is given shortly before the recurrence would have declared itself [8]. One could exclude these patients from the nomogram, but censoring (or excluding) them would bias the nomogram towards improved outcomes. Including these patients but assigning treatment failure at the time of adjuvant therapy may lead to overly pessimistic predictions. A different and favored approach is to view the use of secondary therapy as a time-dependent covariate instead of as a fixed parameter like pathological stage.
Rather than the area under the receiver operator characteristic curve (AUC), the discrimination of these nomograms is measured using the concordance index (or c-index). The c-index functions in the presence of case censoring and is more appropriate for analyzing survival or time-to-event data, while the AUC requires binary outcomes (e.g., yes/no).
Nomograms are calibrated and then validated to determine accuracy. If an external validation (i.e., the gold standard) is not possible for evaluating accuracy and reproducibility, then internal validation methods may be used, such as jackknife, leave-one-out cross-validation, and bootstrapping. These are considered legitimate alternatives that can be used alone or together with external validation to assess the nomograms accuracy.
Clinical States of Prostate
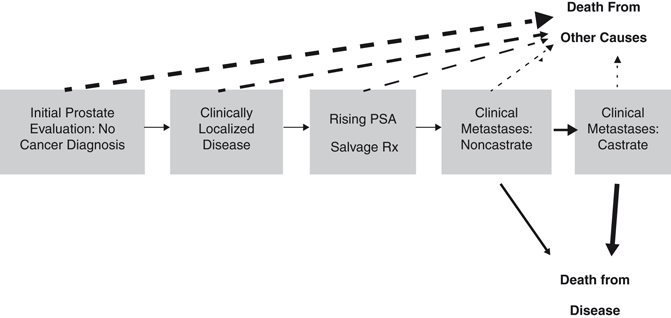
A patient-centric as opposed to treatment-centric way of thinking about prostate cancer is achieved by using a multistate model as proposed by Scher and Heller [9]. In the clinical states’ model, prostate cancer is assessed by a series of clinical states with the spectrum ranging from diagnosis to death from prostate cancer (or death from competing causes) which reflects its treated natural history (Fig. 7.3) [9]. At each state, the patient is faced with different prognoses in terms of the risk of progressing from one clinical state to the next (and ultimately dying from his disease) versus dying from competing causes. Different treatment decisions about the need of further therapy and the nature, risks, and benefits of those treatment alternatives need to be addressed. As previously discussed, accurate estimates of treatment success and side effects (and informed decision making) will determine what an appropriate treatment is for the patient at each clinical state. To our benefit, there are published validated nomograms for some of the endpoints of interest at each clinical state to help guide the clinical decision-making process in the clinical states’ model. At this time, there are well over 100 published prediction tools of various accuracy that have been developed for use in risk estimation for all clinical states of prostate cancer. We sought to review some of the prediction models in the literature for each of these clinical states with an emphasis on those focused on localized prostate cancer.


Fig. 7.3
Clinical states’ model of prostate cancer progression. Dashed line arrows indicate pathways from a clinical state to a nonprostate cancer-related mortality; solid line arrows indicate pathways from a clinical state to a prostate cancer-related mortality. PSA prostate-specific antigen. (Used with permission from [9])
Clinically Localized Disease
The first patient we will evaluate is a man with localized prostate cancer, who is interested in knowing the risk of developing symptoms and/or dying from his disease, with or without definitive local therapy. He would also determine the likelihood of treatment success with radical therapy and the short- and long-term complications of therapy. Several nomograms have been developed for prostate cancer recurrence after definitive local therapy [10]. The management of prostate cancer carries with it treatment-related morbidity. There is a need for nomograms that estimate the likelihood of treatment-related morbidity (e.g., urinary incontinence, sexual dysfunction, bowel dysfunction). The scope of this discussion will be limited to contemporary models that predict the continuous risk of disease progression, developing distant metastasis, and/or prostate cancer-specific mortality (PCSM) after definitive therapy with radical prostatectomy, external-beam radiotherapy , transperineal brachytherapy, and with expectant management. Models that evaluate PFP are mostly based on biochemical recurrence (rising PSA) posttreatment. Considering that at 15 years the risk of death from prostate cancer for men with biochemical recurrence is 33 %, just about equal to risk of death from competing causes, it is imprecise to use it as a substitute for distant metastasis and PCSM [11]. The physician can use both pretreatment and posttreatment nomograms to help decide between the various treatment alternatives for clinically localized prostate cancer and/or the need for multimodal therapy. They can also be used to determine the need for adjuvant therapy and/or the appropriate level of monitoring for posttreatment surveillance testing or imaging.
Radical Prostatectomy
Nomograms for pretreatment and posttreatment have been developed to predict the continuous probability of disease progression and PCSM after radical prostatectomy .
Pretreatment
Risk stratification based on clinical stage, biopsy Gleason score, and pretreatment serum PSA level, are known pretreatment variables associated with disease progression after radical prostatectomy. Along with the Partin et al. tables, these factors may be combined to predict the pathological stage of the prostatectomy specimen. The limit of this process is that the model is useful for surgical planning, but it often does not correlate with the risk of disease progression. It has been noted that 50 % of patients with nonorgan-confined disease were free from disease recurrence at 15 years after radical prostatectomy, confirming that the presence of extraprostatic disease does not imply definite disease progression.
The radical prostatectomy pretreatment nomogram developed by Kattan and colleagues predicts the 5-year PFP for patients based on clinical stage, biopsy Gleason score , and pretreatment PSA level. This model was designed on data from 983 patients with clinically localized prostate cancer treated by a single surgeon. The definition of disease progression was (1) an initial PSA rise to ≥ 0.4 ng/mL followed by any further rise above this level, (2) evidence of clinical recurrence (local, regional, or distant), (3) administration of adjuvant therapy, or (4) death from prostate cancer . Patients who had positive lymph nodes at the start of the prostatectomy resulting in an aborted procedure were classified as treatment failures at the time of surgery. For this cohort the overall 5-year PFP was 73 %. This model is accurate and discriminating with a concordance index ( c-index) of 0.75 when applied to an international external validation cohort [12]. It also showed good validation when taking into consideration ethnicity with a c-index of 0.74 observed with the African-American population [13].
A substantial number of patients are at risk for disease progression after 5 years; therefore, a 5-year endpoint is insufficient to predict the likelihood of cure after radical prostatectomy . However, when evaluating patients after 10 years, recurrence is rare. For patients in our series treated with radical prostatectomy, disease progression was noted in 1 % of patients who had an undetectable PSA at 10 years or later after RP [14]. Therefore, a more appropriate endpoint to estimate cure from a radical prostatectomy alone, would be the 10-year PFP.
The original model designed by Kattan et al. was updated by extending the predictions to 10 years. The model was also adjusted for the stage migration of prostate cancer which occurred since the introduction of mass PSA screening (by including year of treatment as a predictor), and including information from a systematic prostate biopsy in terms of the number of positive and negative cores (Fig. 7.1) [15]. The nomogram is based on 1978 patients treated by two high-volume surgeons and externally validated with a cohort of 1545 patients treated at a separate institution. Data from several studies state that the results of systematic prostate biopsy provide important prognostic information, yet the inclusion of the number of positive and negative cores resulted in only a mild improvement in predictive accuracy over stage, grade, and PSA in independent validation ( c-index 0.79 vs. 0.78). The model also has the ability to predict the probability of disease progression at any time point after radical prostatectomy between years 1 and 10.
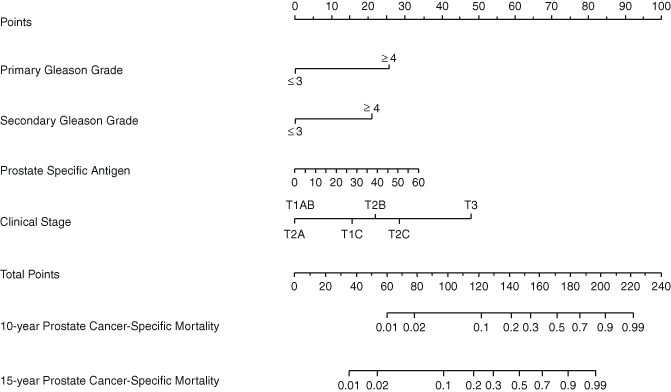
Recently, we developed a pretreatment nomogram that predicts the 15-year PCSM after radical prostatectomy based on PSA, clinical stage, biopsy Gleason score, and the year of treatment (Fig. 7.4) [16]. The nomogram is based on a cohort consisting of 6398 patients treated between 1987 and 2005 by surgeons at Memorial Sloan-Kettering Cancer Center (MSKCC) and then the model was externally validated on 6279 patients treated at Cleveland Clinic and University of Michigan during the same period. The statistically significant predictors in the nomogram were the primary and secondary Gleason grade of the biopsy, PSA, and year of treatment, with the c-index of the model being 0.84. For those patients with a risk of biochemical recurrence greater than 50 % the PCSM was predicted to be less than 20 %, and overall it was noted to be 12 %. This means that the prognosis for patients with clinically localized prostate cancer is very favorable in terms of PCSM at 15 years, with only 1980 (17 %) patients having a predicted 15-year PCSM greater than 5 %, and 467(4 %) having a probability greater than 30 %. Another variable that has been evaluated as a predictor of PCSM is pretreatment PSA velocity, yet the predictive accuracy of the nomogram was not improved when including this variable.


Fig. 7.4
Preoperative nomogram predicting 10- and 15-year prostate cancer-specific mortality after radical prostatectomy based on primary and secondary biopsy Gleason grade, preoperative PSA level, and clinical stage. The predictions of the model are adjusted for the year of surgery and the model assumes the patient is treated in 2005 (the most recent treatment year of patients included in the model). (Used with permission from [16])
Posttreatment
For posttreatment, we elaborated a nomogram to determine patients at high risk for developing disease progression after radical prostatectomy. This model uses the pretreatment PSA level, and then information from the pathology report , including: Gleason score, extraprostatic extension, margin status, SVI, and lymph node status to predict the 7-year probability of disease progression. The cohort used included 996 men with clinically localized prostate cancer treated by a single surgeon. Failure after treatment was defined as an initial PSA rise to ≥ 0.4 ng/mL followed by any further rise above this level, clinical evidence of disease progression (local or distant), initiation of adjuvant therapy, or death from prostate cancer. The 7-year PFP for this population was 73 %. The c-index for the nomogram was 0.80 when validated with an international cohort and 0.83 when validated with an African-American cohort [13].
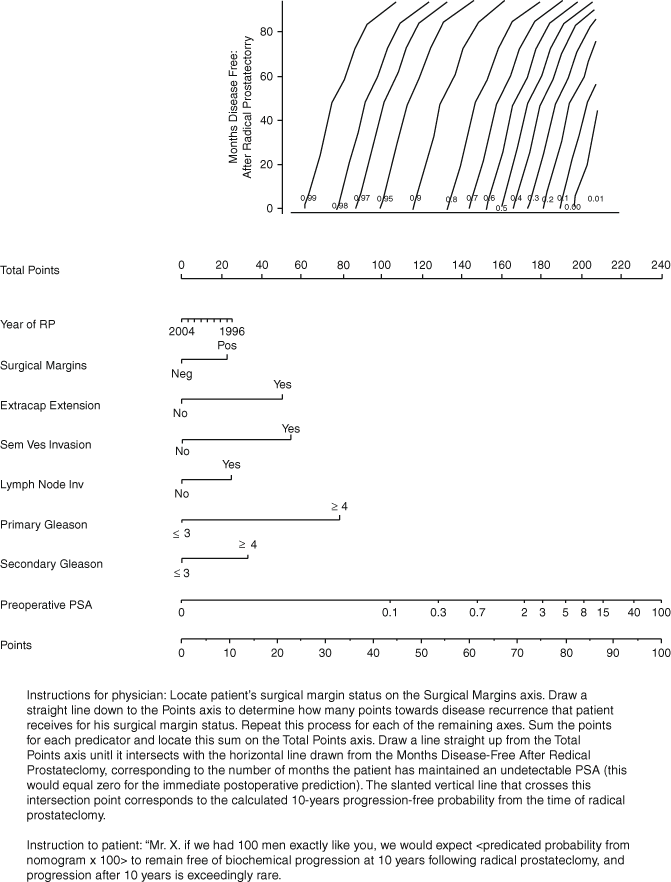
This nomogram was also updated and improved to calculate the 10-year probability of prostate cancer recurrence after radical prostatectomy (Fig. 7.5) [17]. Just as for the pretreatment nomogram, treatment year was also included to adjust for the stage migration caused by widespread PSA screening. Special consideration was given to adjuvant radiotherapy, where in previous models it was considered treatment failure, in this model it was used as a time-dependent parameter. Taking into account that a patient’s prognosis improves over time, the longer he stays disease-free, the nomogram was adjusted to reflect this in the 10-year PFP. The cohort for this nomogram consisted of 1881 patients treated by two high-volume surgeons between 1987 and 2003. The model was demonstrated to be accurate and discriminating ( c-index 0.81 and 0.79) when used in two independent validation cohorts of 1782 and 1357 patients.


Fig. 7.5


Postoperative nomogram predicting 10-year freedom from prostate-specific antigen ( PSA) recurrence based on the pathological features of prostate cancer (primary and secondary pathological Gleason grade, extracapsular extension, seminal vesicle invasion, lymph node invasion, surgical margins) and preoperative PSA level. RP radical prostatectomy. (Used with permission from [17])
Stay updated, free articles. Join our Telegram channel

Full access? Get Clinical Tree


