Molecular Techniques in Pediatric Pathology
Jason A. Jarzembowski, M.D., Ph.D.
D. Ashley Hill, M.D.
INTRODUCTION
Rapid advances in the understanding of the molecular and genetic basis of disease have led to an increasingly information-rich and complex working environment for the pediatric pathologist. In addition to providing insight into the pathology and biology of disease, these advances have led to improvements and refinements in diagnosis, risk stratification, prediction of outcome, determination of eligibility for new targeted therapies, and gene-based screening for disease risk. Molecular techniques have become the standard of care in the pathologic evaluation of hematopoietic diseases, pediatric tumors, infectious diseases, immunodeficiencies, metabolic diseases, and chromosomal/genetic disorders. Pediatricians and surgeons, armed with the latest literature on the gene expression profile of a given set of tumors or a newly described mutation associated with a congenital defect, are anxious to apply these new discoveries to their patients’ specimens. With a solid understanding of disease morphology and pathogenesis coupled with access to advanced technology and tissue resources, pediatric pathologists are in an advantageous position to utilize this wealth of information in a manner that is clinically important to today’s patients. Here, we discuss several molecular techniques focusing on relevance to the standard practice of a pediatric pathologist. We include a broad overview of the technical aspects of each methodology with the utility of each method illustrated by applications to specific pediatric diseases. Because detailed descriptions of all techniques and all relevant diseases are beyond the scope of this chapter, key references and helpful websites are suggested for a more in-depth discussion.
Tissue Handling
The appropriate management of complicated pediatric specimens submitted to the pathology laboratory begins well before the slides cross the microscope stage. Even before the child is in the operative suite, it is fundamental that pathologists participate in the preoperative treatment planning.
Establishing an open line of communication with the referring physicians and surgeons will ensure that the pathology team is well prepared for special handling requirements. This is a good opportunity to consider the differential diagnosis and plan ahead for appropriate specimen transport; intraoperative assessment of tissue adequacy, preliminary diagnosis, and margin evaluations when necessary; and tissue requirements for potential ancillary testing and clinical trial enrollment (Table 1C-1). Debski and colleagues have written an excellent review on the approach to handling pediatric tumors that applies to other specimen types as well (Figure 1C-1) (1).
Specific Molecular Techniques
Most pathology laboratories today have a sizeable arsenal of molecular tools that can be deployed to assist in diagnosis, predict treatment efficacy, or provide other pertinent clinicopathologic information. The first group of assays described—flow cytometry, immunohistochemistry (IHC), and immunofluorescence—are all protein based and predicated on the specific recognition of antigen by antibody. Those in the second group are all nucleic acid-dependent and include traditional cytogenetics, in situ hybridization, polymerase chain reaction (PCR), and the continually evolving worlds of microarray technology and next-generation sequencing (NGS).
FLOW CYTOMETRY
Background
Since its inception in the 1970s, flow cytometry has gained widespread acceptance and is today considered an essential component of the diagnostic workup of hematopoietic neoplasms and immunodeficiency disorders. This methodology allows for rapid identification of cell surface molecules and their coexpression patterns, thus separating subpopulations
of cells such as monocytes from lymphocytes, B from T lymphocytes, or CD4+ from CD8+ T lymphocytes. Aberrant marker profiles or absolute cell counts can also be easily determined. The diagnosis and classification of leukemias and lymphomas are thoroughly discussed elsewhere in this book. Herein, we describe the general theory and method with special attention to specimen processing and practical applications.
of cells such as monocytes from lymphocytes, B from T lymphocytes, or CD4+ from CD8+ T lymphocytes. Aberrant marker profiles or absolute cell counts can also be easily determined. The diagnosis and classification of leukemias and lymphomas are thoroughly discussed elsewhere in this book. Herein, we describe the general theory and method with special attention to specimen processing and practical applications.
TABLE 1C-1 TYPICAL TISSUE REQUIREMENTS FOR COMMONLY USED MOLECULAR DIAGNOSTIC TECHNIQUES | ||||||||||||||||||||||||||||||||||||||||||||
|---|---|---|---|---|---|---|---|---|---|---|---|---|---|---|---|---|---|---|---|---|---|---|---|---|---|---|---|---|---|---|---|---|---|---|---|---|---|---|---|---|---|---|---|---|
| ||||||||||||||||||||||||||||||||||||||||||||
Method
The most common specimens submitted for flow cytometry are peripheral blood, bone marrow aspirates, cerebrospinal fluid, and lymph nodes. For peripheral blood (except for paroxysmal nocturnal hematuria [PNH] studies) and bone marrow specimens, erythrocytes are removed by lysis or differential centrifugation. A portion of the sample is spun onto a slide for assessment of cell viability and possible contaminating debris. From this, total cell counts can be estimated, which determines how many analysis tubes can be run; approximately 106 cells are needed for optimal results from a typical reaction tube. When testing will be applied to solid samples, the tissue should be immediately transported on saline-moistened gauze or in fresh RPMI medium to the laboratory. Touch preparations for cytologic evaluation are useful in guiding the triage of the sample for light microscopy, flow cytometry, cytogenetics, and storage in a -80°C freezer for subsequent studies. Flow cytometry requires a small (3 to 5 mm3) piece of viable tissue placed in fresh RPMI
or similar medium. If subsequent processing will be delayed for more than an hour or so, the tissue should be finely diced to maximize exposure to the nutritive medium and prolong viability (2). Once at the flow cytometry laboratory, the tissue is carefully teased apart and separated into a single-cell suspension (3,4,5).
or similar medium. If subsequent processing will be delayed for more than an hour or so, the tissue should be finely diced to maximize exposure to the nutritive medium and prolong viability (2). Once at the flow cytometry laboratory, the tissue is carefully teased apart and separated into a single-cell suspension (3,4,5).
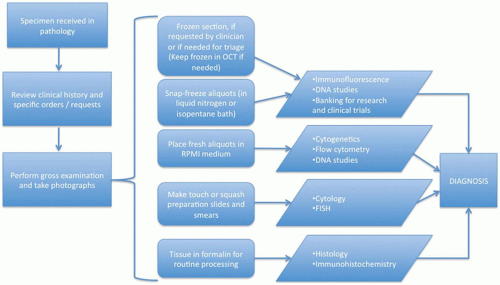 FIGURE 1C-1 • Recommended triage and sampling protocol for pediatric specimens. |
For the next step, cell aliquots are mixed with surface antigen-specific antibodies that have been conjugated to fluorescent dyes, such as phycoerythrin (PE), fluorescein isothiocyanate (FITC), and phthalocyanines (PC5, PC7). After a short incubation to allow the conjugated antibodies to bind their target surface antigens on the cells in the aliquot, the sample is loaded into the flow cytometer (Figure 1C-2). The cell suspension flows through capillary tubing, eventually streaming single file through the detection chamber. Here, one or more lasers “interrogate” each cell, determining the forward scatter (roughly correlating with size), the side scatter (roughly correlating with cytoplasmic complexity or granularity), and a measurement of fluorescent dyes reflecting expression of a particular protein by the cell. Multiple antibodies can be combined in each tube to the extent that they each have a distinct fluorescent tag. For example, a single tube for profiling lymphocytes might contain CD3-PE, CD19-PC5, and kappa-FITC; the expression profile of these three surface markers can be quantitated separately because each has a different associated dye. Detection of each fluorescent signal requires a separate channel on the device, so that a four-channel flow cytometer can analyze four markers per tube and a five-channel machine can observe five molecules in concert. In addition to demonstrating the coexpression patterns of these markers on distinct cellular populations, multichannel technology also minimizes the necessary sample size and shortens analysis time by reducing the number of tubes needing to be run. Nonetheless, modern cytometers can analyze cells at flow rates exceeding 1000 cells/second.
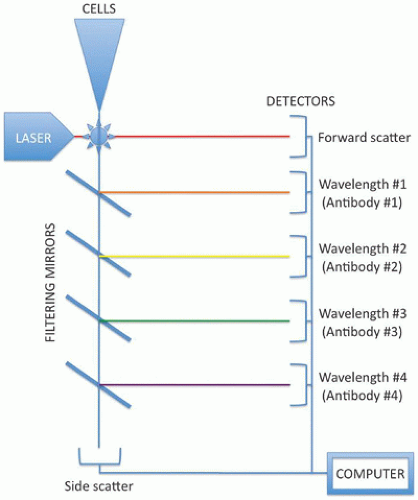 FIGURE 1C-2 • Overview of a typical four-channel flow cytometry setup. The antibody-bound cell suspension flows through the cytometer with cells passing singly through the laser beam(s). Forward scatter (to the right) is determined by the intensity of the light passing directly through the cell, whereas side scatter (to the bottom) depends on the intensity of reflected light. A series of filtering mirrors (left) selectively reroute light of the desired wavelength toward the detectors and allow the remainder of the beam to pass. Each antibody under investigation is conjugated to a tag that fluoresces at a different wavelength. Thus, each detector effectively measures a specific antibody and, together, four antibodies, forward scatter, and side scatter are measured simultaneously for each cell. Data are compiled by a computer processor and presented as interactive scattergrams. |
The data obtained from each cell are recorded as an event, theoretically allowing the user to look at the individual profile of each cell in the specimen. By selecting populations of cells with a certain range of expression for a particular marker (“gating”), the relative frequency and coexpressed markers can be visualized (see Figure 1C-3, panel D). For example, one might initially gate on CD45+ cells (leukocytes only) and then observe the CD3+ and CD20+ cell populations to assess the relative B- and T-cell numbers. T cells might be gated into CD4+ and CD8+ groups. If the T cells coexpressed both markers, one might suspect an immature T-cell neoplasm such as pre-T-ALL and would then investigate other markers such as CD5, CD10, and TdT. In such a stepwise fashion, each cell subpopulation can be examined for abnormalities.
The interpretation of flow cytometric data is a dynamic process (6). Tabular reports that list the markers analyzed and the percentage of cells positive are unable to capture the complexity of such data. It is good clinical practice to review the expression patterns of the cells of interest, seeing where they lie on each plot and correlating the flow cytometric patterns with the microscopic appearance and results of other ancillary studies.
Applications
Flow cytometric analysis is invaluable, not only in the diagnostic workup of leukemias and lymphomas, but in a myriad of other applications, as well. For example, in lieu of the traditional Kleihauer-Betke test, the degree of fetomaternal hemorrhage can be accurately determined using flow cytometry with antibodies directed against fetal hemoglobin (7,8). The diagnosis of PNH can be made by demonstrating an absence of GPI-linked proteins such as CD55 and CD59 (9,10). For some diseases, it is important to enumerate classes of lymphocytes such as monitoring CD4+ cell counts in HIV-infected patients, or other specific subtypes that may be
lacking (such as in various immunodeficiencies) or present in excessive numbers (such as CD3+, CD4–, CD8–, “double-negative” T cells in autoimmune lymphoproliferative disorder) (11,12). Also, flow cytometry is being more frequently used in minimal residual disease detection—identifying small, morphologically invisible populations of leukemic or even circulating solid tumor cells, which has therapeutic and prognostic significance (13,14,15).
lacking (such as in various immunodeficiencies) or present in excessive numbers (such as CD3+, CD4–, CD8–, “double-negative” T cells in autoimmune lymphoproliferative disorder) (11,12). Also, flow cytometry is being more frequently used in minimal residual disease detection—identifying small, morphologically invisible populations of leukemic or even circulating solid tumor cells, which has therapeutic and prognostic significance (13,14,15).
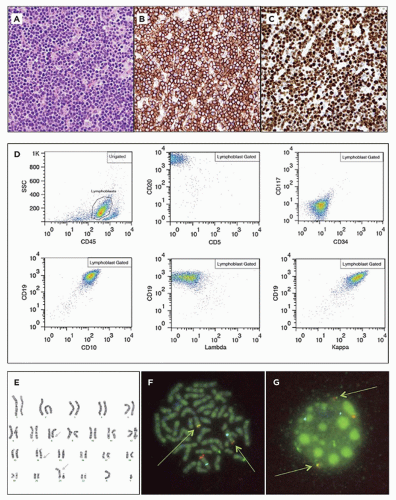 FIGURE 1C-3 • Burkitt lymphoma. Although just a small round blue cell tumor at first glance, the H&E-stained section (A) shows uniform cells with scant cytoplasm and a high mitotic rate along with interspersed tingible body macrophages. The lesional cells are positive for CD19 (B), identifying them as B lymphocytes with a near-100% proliferation rate (C, MIB-1 IHC). Flow cytometry (D) shows lymphoblasts that are negative for CD34 and CD117 (blastic and myeloblastic markers, respectively), but positive for the B-cell markers CD10 (moderate), CD19, and CD20 (bright) and kappa restricted (suggesting monoclonality). Conventional cytogenetic analysis (E) revealed an abnormal karyotype with a t(8;14) characteristic of Burkitt lymphoma, as well as an extra copy of 1q attached to the short arm of 21 (arrows). FISH was performed on both metaphase (F) and interphase nuclei (G) using MYCC (chr 8, red) and IGH probes (chr 14, green) and demonstrates several fusion genes (in yellow). Extra green signals indicate occasional gain of chromosome 14. (Flow cytometry plots kindly provided by Dennis W. Schauer, Clinical Immunodiagnostic and Research Laboratory, Department of Pediatrics, Medical College of Wisconsin. Karyotype and FISH analysis courtesy of Dr. Peter vanTuinen, Dynacare Clinical Cytogenetics Laboratory, Medical College of Wisconsin.) |
IMMUNOHISTOCHEMISTRY
Background
Over the course of the 1980’s decade, IHC rapidly gained acceptance and became standard of care in most anatomic pathology laboratories. IHC boasts high sensitivity, specificity, and resiliency. Unlike immunofluorescence or many molecular techniques, IHC can be performed on formalin-fixed, paraffin-embedded tissue (FFPE). This greatly enhances its utility, especially on cases with limited material and in retrospective studies. Finally, automated stainers can easily perform IHC with minimal human hands-on time. Such machines have reduced the relative cost of IHC in many laboratories.
Method
The principle of IHC is simple enough and involves a primary antibody specific for the antigen of interest, a secondary antibody that not only binds the first antibody but is also conjugated to an enzyme, and a colorimetric indicator such as a dye that is formed or changes color via the action of the aforementioned enzyme. Thus, a molecular linkage is formed that localizes a readily discernible color (typically, brown or red) to the vicinity of the antigen of interest (Figure 1C-4) (16).
For most diagnostic and research applications of IHC, FFPE tissue is used (17,18). The application of microwave or steam heat to the tissue prior to the staining process (“antigen retrieval” or “unmasking”) can improve sensitivity of the technique by reducing or reversing formalin-induced cross-linking of proteins (which modifies or blocks some epitopes required for antibody recognition). A few special antibodies have been optimized for use with frozen tissue sections, and these require the forethought to reserve a piece of the specimen for this purpose.
The primary antibody is the primary determinant of IHC reactivity. The choice of antibody is guided not only by the target antigen but also by the desired sensitivity/specificity, the reaction conditions, and the cost and reliability of product from a given manufacturer. Different antibody clones react with different portions of proteins and may yield strikingly different IHC results. Monoclonal antibodies (where all antibody molecules recognize a single epitope) are usually more specific than polyclonal sera (where the antibody molecules recognize a variety of antigenic epitopes on a single protein); however, the former are therefore more vulnerable to false-negative results when the epitope is obscured (by protein interactions or misfolding) or absent (via mutations). Perhaps the most pronounced difference between monoclonal and polyclonal antibodies is seen with carcinoembryonic antigen (CEA); fewer than 5% of all hepatocellular carcinomas stain with monoclonal CEA antibodies, whereas roughly 70% stain with polyclonal CEA antibodies in a cytoplasmic or canalicular pattern (19).
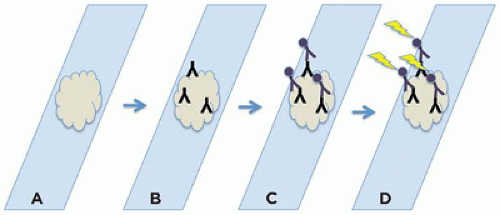 FIGURE 1C-4 • Overview of immunohistochemical staining. Tissue slides (A) are incubated with a primary antibody specific for the antigen of interest (B), to which a secondary antibody conjugated to a marker is then bound (C). Detection is then achieved by a colorimetric or light-producing assay (D). |
The optimal reaction conditions, such as antibody concentration and incubation time, must be determined for each new antibody, and existing protocols should be tested with each new lot of an established antibody. Excessive concentrations of antibody or prolonged incubation times may allow nonspecific binding, whereas insufficient antibody or time can yield false-negative results (20).
The choice of secondary antibody is in large part dictated by the primary antibody; the two must originate from different species so that the secondary antibody recognizes the constant portions of the primary antibody. Some manufacturers offer a secondary antibody that reacts against primary antibodies from multiple species. The variety of signaling methods and permutations thereof is too numerous to describe here. Suffice it to say, the secondary antibody is conjugated to a signal molecule—a dye, an enzyme, or a fluorescent marker—such that the location of the antibody “sandwich” can in some way be visualized.
One of the most common detection reactions involves horseradish peroxidase (HRP), which can convert a chromogen (such as TMB or DAB) into a brown-colored product. This method is susceptible to high background signal created by endogenous peroxidases found especially in erythrocytes and granulocytes; these cytoplasmic enzymes can react with the dye precursors to produce a signal indistinguishable from the intended one, except for its localization. In order to quench these enzymes and lower the background noise, pretreatment with methanol and dilute hydrogen peroxide (or other related methods) is used to denature these culprits without significantly inhibiting the subsequently used HRP. However, endogenous peroxidase activity may still hinder interpretation in enzyme-rich tissues such as spleen and bone marrow. Regardless of the specific methods employed, the end result is a color change localized to the antigenic sites of interest. A light counter-stain, such as hematoxylin alone, hematoxylin and eosin, methyl green, or periodic acid-Schiff, is often employed to allow background architecture and unstained cells to be discerned.
The final step is careful interpretation. The positive control should show strong, specific staining on a section of tissue known to contain the antigen of interest. Ideally, this positive control tissue should be present on the same slide as the
case tissue section. Likewise, the negative control, usually performed on an additional slide of the actual case material, omits the primary antibody and should demonstrate a lack of nonspecific binding of secondary antibody, important when using a natural protein such as biotin in the antibody complex. Each case tissue section has internal controls built in, as well, in the form of blood vessels, connective tissue, or epithelium. The positive and negative staining patterns of these tissue types should be examined in addition to the staining of the areas of interest. Interpretation should include consideration of the quality, quantity, and patterns of staining. Proteins can be nuclear, cytoplasmic, and/or cytoplasmic membranous. Knowledge of the expected pattern of antibody staining in particular tissues is important for quality control.
case tissue section. Likewise, the negative control, usually performed on an additional slide of the actual case material, omits the primary antibody and should demonstrate a lack of nonspecific binding of secondary antibody, important when using a natural protein such as biotin in the antibody complex. Each case tissue section has internal controls built in, as well, in the form of blood vessels, connective tissue, or epithelium. The positive and negative staining patterns of these tissue types should be examined in addition to the staining of the areas of interest. Interpretation should include consideration of the quality, quantity, and patterns of staining. Proteins can be nuclear, cytoplasmic, and/or cytoplasmic membranous. Knowledge of the expected pattern of antibody staining in particular tissues is important for quality control.
As an ancillary diagnostic method, IHC results are usually reported as part of a more comprehensive report. Within the “Microscopic Description” or “Comment” section, the performed IHC stains should be described (in tabular or textual format) including the name of the stain, the results with lesional cells, and verification of controls. For example, “Properly controlled immunohistochemical stains demonstrate that the lesional cells are positive for a, b, and c, but negative for x, y, and z.” Depending on personal and institutional preference, an explanation of these results and how they support the diagnosis may then be appended. Most laboratories automatically add a note detailing whether these stains are FDA approved for clinical use or are investigational only, which may affect the payment for these services.
Applications
The most common use for IHC is as an ancillary method in the diagnosis and detection of tumors and identification of tissue. Sometimes, its purpose is to detect or highlight a single population of cells—for example, ganglion cells (for the RET protein, in biopsies of suspected Hirschsprung disease) or endodermal sinus tumor components (by α-fetoprotein staining) of mixed germ cell tumors or teratomas (21,22,23). Some IHC stains lend insight into the genetic alterations in tumors like mutant-specific BRAF (24), IDH1 (25,26), and TP53 (27). EGFR and p53 expression patterns, which distinguish de novo pediatric and adult glioblastomas, differ between de novo and progressive glioblastoma in adults (28,29). The results of other IHC tests can direct and optimize treatment by confirming the presence of target molecules, for example, estrogen and progesterone receptor status for antihormonal therapy in breast carcinoma, and CD20 surface expression for rituximab in leukemia/lymphoma and autoimmune disease (30,31). As with any ancillary technique, the results of IHC alone should not determine the diagnosis or treatment but, rather, should be interpreted in the context of the morphologic appearance and clinical history.
ANTIGENS
Cytoskeleton
Three main groups constitute the cytoskeleton of human cells: thin, intermediate, and thick filaments. Thin filaments (5 to 6 nm) are composed of α-, β-, and γ-actins; the former are exclusively found in muscle cells and can be distinguished by antibodies such as muscle-specific actin (MSA; HHF35), smooth muscle actin (SMA), and smooth muscle myosin heavy chain (SMMS-1). For example, the IHC staining pattern differentiates between nonmuscle cells and tumors (MSA- SMA- SMMS-1-), skeletal muscle myocytes and rhabdomyosarcomas (MSA+ SMA- SMMS-1-), and smooth muscle myocytes and leiomyosarcomas (MSA+ SMA+ SMMS-1+). Myoepithelial cells and myofibroblasts also stain positively for all three markers, although to varying degrees.
Diagnostically speaking, the most useful cytoskeletal proteins are the intermediate filaments (10 nm). The relative composition of intermediate filaments varies by cell type and allows distinction by IHC. The major intermediate filaments include vimentin, desmin, glial fibrillary acidic protein (GFAP), and cytokeratins.
Vimentin can be found in all mesenchyme-derived cells— fibroblasts, myocytes, osteocytes, chondrocytes, Schwann cells, endothelial cells, and hematopoietic elements—often leading to its dismissal as “nonspecific.” Nonetheless, a vimentin stain serves well to distinguish sarcomas and lymphomas from carcinomas. Even with the most poorly differentiated neoplasms, this distinction can usually be made. Vimentin IHC is also of great utility in confirming that tissue antigenicity has been preserved; most sections have at least focal areas of vimentin-positive cells. Necrotic tissue can be surprisingly informative, as it often maintains some degree of reactivity, often in the original pattern of distribution. In these cases, careful comparison with control tissue and nontumoral tissue in the section is necessary to ensure accurate interpretation.
Desmin shares sequence homology with vimentin and is likewise restricted to mesenchymal cells. However, unlike vimentin, desmin is only expressed at significant levels in smooth, skeletal, and cardiac myocytes. Thus, in a sense, desmin is a marker of myogenic differentiation; although the aforementioned cells contain desmin, primitive mesenchymal cells and neoplasms do not. Desmin-positive tumors include leiomyomas, leiomyosarcomas, and rhabdomyosarcomas. Of special note, desmin expression in most cardiac myocytes is limited to the intercalated discs, whereas the Purkinje fibers show diffuse cytoplasmic staining.
Glial fibrillary acidic protein (GFAP) is relatively specific for astrocytes and their corresponding neoplasms—astrocytomas, glioblastomas, and other gliomas (32). Reactive astrocytes are markedly positive and care must be taken to ensure that such a population of cells is not mistaken for the actual neoplasm (32,33,34). Ependymal cells and their derivative neoplasms show variable reactivity for GFAP. Neurofilament is
actually a set of three related proteins that form fibers within the cell bodies and processes of neurons; the main diagnostic utility of a neurofilament IHC stain is to highlight neurons within tissue or tumor.
actually a set of three related proteins that form fibers within the cell bodies and processes of neurons; the main diagnostic utility of a neurofilament IHC stain is to highlight neurons within tissue or tumor.
Epithelial cells are easily distinguishable by the presence of distinct cytokeratin profiles. Carcinomas are positive when using broad-spectrum cytokeratin antibody “cocktails” such as AE1/AE3 or CK7/CK20, which can rule out most lymphomas and sarcomas. Important exceptions include the epithelial component of synovial sarcoma (Figure 1C-5, panel C), epithelioid sarcoma, and the characteristic cytoplasmic inclusions of malignant rhabdoid tumors; the latter stain for cytokeratin, not muscle markers. More specific antibodies can help highlight organ-specific epithelium, for example, CK19 in breast or biliary tract or TTF1 in the lung and thyroid.
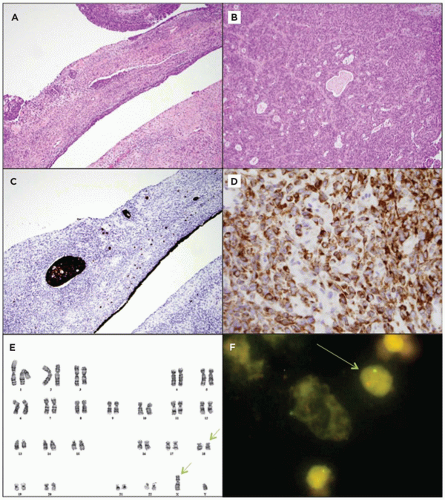 FIGURE 1C-5 • Biphasic synovial sarcoma. The H&E-stained sections (A, B) demonstrate a spindle cell sarcoma with areas of glandular differentiation; the latter are immunohistochemically positive for mixed cytokeratins (C), and the majority of the tumor cells are positive for bcl-2 (D). Conventional cytogenetic analysis (E) demonstrated t(X;18) pathognomonic for the SYT-SSX fusion gene of synovial sarcoma (arrows). Breakapart FISH probes (one red, one green from opposite ends [5′ and 3′, respectively] of the SYT gene) are seen separately instead of together as a single intact yellow signal (as seen in the surrounding normal cells) (F). (Karyotype and FISH analysis courtesy of Dr. Peter vanTuinen, Dynacare Clinical Cytogenetics Laboratory, Medical College of Wisconsin.) |
Thick filaments (20 to 25 nm) are composed of β-tubulin and are ubiquitous to all cell types. Thus, their diagnostic utility is limited.
Cell Surface Markers
Cell surface antigens have proven utility not only in IHC but also in flow cytometry and cell sorting. However, while flow cytometry requires fresh tissue or cell-rich fluid, the same
markers can be evaluated on FFPE tissue by IHC. These antigens are indispensable in the diagnosis of hematopoietic neoplasms, and such use is detailed elsewhere in this book (see Chapters 22 and 23).
markers can be evaluated on FFPE tissue by IHC. These antigens are indispensable in the diagnosis of hematopoietic neoplasms, and such use is detailed elsewhere in this book (see Chapters 22 and 23).
Many of these cell surface molecules are numerically designated as a “cluster of differentiation,” or “CD.” For example, the normal constituent cells of the mature immune system can be roughly grouped by their expression of these proteins: B lymphocytes (positive for CD19, CD20 [L26], CD79a; Figure 1C-3), T lymphocytes (positive for CD3, CD4, CD8), and natural killer cells (positive for CD56). Myeloblasts stain for CD34 and CD117 (c-kit), two markers also associated with other neoplasms; a CD34 stain is positive in synovial sarcoma and some vascular tumors, and CD117 positivity is an important finding in gastrointestinal stromal tumors (35).
Macrophages and histiocytes exhibit granular staining in their cytoplasm for CD68, a component of lysosomal membranes (more accurately, a lysosomal surface marker); CD1a is specific for Langerhans cells and T lymphoblasts (36,37,38,39). Mast cells have membrane positivity for CD138, as well as cytoplasmic positivity for a characteristic enzyme, tryptase (40). This enzyme can also be detected by histochemical methods that require frozen tissue.
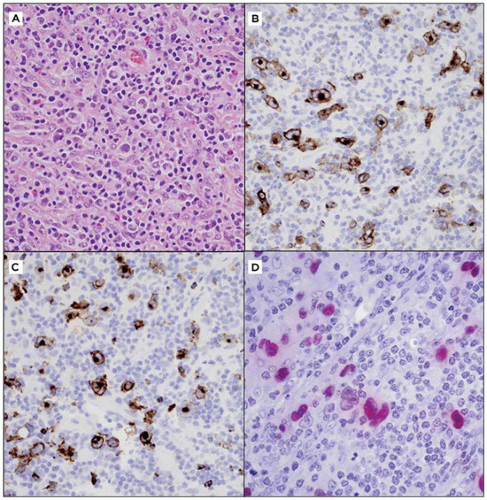 FIGURE 1C-6 • Classic Hodgkin lymphoma. The H&E-stained section (A) reveals scattered large cells with atypical, convoluted nuclei in a mixed inflammatory background. At lower power, fibrous bands were seen entrapping nodules of tumor. By IHC, the Hodgkin cells are positive for CD15 (B) and CD30 (C). In situ hybridization for EBV-encoded RNA (EBER) is positive in many of these cells (D, red staining). |
Endothelial cells, both nascent and tumoral, can be marked with CD31 and CD34, although these antibodies mark some other cells, as well. GLUT-1 is a useful marker for the endothelial cells of infantile hemangiomas (41), and D2-40 (podoplanin) marks lymphatic endothelium (along with mesothelium and some other tissues) (42).
Pathogens
A wide variety of viruses can be detected by antibodies specific for well-conserved antigens, including adenovirus, cytomegalovirus (CMV), herpes simplex virus (HSV) types I and II, parvovirus B19, human herpesvirus 8 (HHV8), human papilloma virus, BK virus (via large T antigen), hepatitis B virus (via surface antigen), and Epstein-Barr virus (EBV, via the latent membrane protein [LMP]). Typically, clinical suspicion, positive serologic testing, or viral cytopathic change seen on routine H&E-stained slides serves as a trigger for further workup by IHC. Companion in situ hybridization tests are available for both HPV and EBV (Figure 1C-6,
panel D); these tests can identify the former as high- or low-risk subtypes. Whenever possible, viral IHC should be performed in tandem with culture and serologic testing (43).
panel D); these tests can identify the former as high- or low-risk subtypes. Whenever possible, viral IHC should be performed in tandem with culture and serologic testing (43).
IHC is less commonly used to identify bacteria, both because of these organisms’ patchy and often sparse distribution in tissue and the greater detection sensitivity of microbiologic culture methods (43,44). However, antibodies against Helicobacter pylori have supplanted more traditional Steiner, Giemsa, or Alcian Yellow stains at some institutions (45,46). Also, Pneumocystis jiroveci, once thought to be protozoal but now formally classified as a fungus, can be easily highlighted by appropriate antibodies in IHC (47,48).
Hormones
IHC can assist in confirming the diagnosis and hormone secretion profile of many endocrine tumors. For example, pancreatic endocrine neoplasms (islet cell tumors) can be categorized as derived from alpha, beta, delta, or G cells based on immunohistochemically verifiable expression of glucagon, insulin, somatostatin, or gastrin, respectively. Likewise, VIP-producing tumors and serotonin-secreting carcinoids can be demonstrated by IHC.
In conjunction with clinical presentation, pituitary adenomas can be easily classified by IHC profiling for prolactin, adrenocorticotrophin hormone (ACTH), thyroid-stimulating hormone, growth hormone, follicle-stimulating hormone, and luteinizing hormone (49,50). This approach is especially useful with silent adenomas, which have detectable hormone(s) in the tumor cells’ cytoplasm, but not in the patient’s serum.
Medullary thyroid carcinoma stains positively for calcitonin, as do normal C-cells and the hyperplastic foci of multiple endocrine neoplasia syndrome. More generally, thyroid epithelial cells can be highlighted by antibodies to thyroglobulin or thyroid transcription factor-1 (TTF-1). Parathyroid hormone stains are useful in identifying parathyroid tissue, although normal, hyperplastic, and neoplastic tissues react identically.
Although less often useful in the pediatric realm, IHC for estrogen and progesterone receptors has become standard of care in the evaluation of breast cancer, serving to guide the choice of chemotherapy. Germ cell and sex cord tumors can express α-inhibin and β-human chorionic gonadotrophin (β-hCG), and the serum levels of these markers are sometimes used to monitor patients for recurrence.
Embryonal and Cancer Markers
Fetal tissues and neoplasms share expression of primitive traits, including a subset of proteins normally restricted to developmental periods. For example, α-fetoprotein can be found in fetal liver as well as hepatoblastomas, hepatomas, and endodermal sinus tumors. Placental alkaline phosphatase (PLAP) stains germ cell tumors and some carcinomas. The stem cell marker OCT4 is now replacing PLAP as a more sensitive and specific marker of germ cell neoplasms, specifically seminoma/germinoma, embryonal carcinoma, and intratubular germ cell neoplasia. Among the so-called cancer markers, CA-125 is more specific for genitourinary neoplasms, whereas CA19-9 is preferentially expressed in gastrointestinal cancers. Both these markers are also detectable in patient serum.
INI-1 (hSNF, SMARCB1, BAF47) is a particularly helpful antibody in the diagnosis of malignant rhabdoid tumor (and atypical teratoid/rhabdoid tumor), epithelioid sarcoma, and renal medullary carcinoma. Loss of nuclear INI-1 staining is predictive of INI-1 mutation or deletion that typifies this group of tumors, whereas the gene is invariably expressed in normal cells, providing a useful internal control.
Also of note is the WT1 protein, a zinc-finger transcription factor that is expressed in the course of normal urogenital development and which functions as an inactivated tumor suppressor in nephroblastoma (Wilms tumor) and other neoplasms. Wilms tumors show nuclear immunore-activity for WT1 with most antibodies, whereas desmoplastic small round cell tumors, with canonical EWS-WT1 gene rearrangements, are often only positive when using antibodies directed against C-terminal epitopes (51,52).
Protooncogenes
Anaplastic lymphoma kinase-1 (ALK-1) is the fusion product of a characteristic t(2;5) translocation found in most anaplastic large cell lymphomas and inflammatory myofibroblastic tumors; its expression in the former is thought to portend favorable prognosis. ALK-1 is also mutated or amplified in about 20% of neuroblastomas, especially in familial variants, and may identify patients eligible for crizotinib therapy (53,54,55). Tyrosine kinases, such as c-kit (CD117), can help diagnose tumors such as gastrointestinal stromal tumors, as well as predict which lesions might respond to monoclonal antibody therapy (in this case, imatinib).
BRAF, a serine/threonine protein kinase, is often mutated in human cancers. In children, a specific V600E mutation is frequently seen in papillary thyroid carcinoma, aggressive Langerhans cell histiocytosis, and brain tumors (glioblastoma multiforme, pleomorphic xanthoastrocytomas, and gangliogliomas) (56,57,58,59,60). The presence of this mutation identifies tumors which might be amenable to targeted therapies.
Cell Cycle and Apoptotic Markers
The most commonly used antibody in this category is MIB-1 (Ki67), a proliferation marker frequently used to assess the proliferative activity of lesions. Although a high MIB-1 index does not define something as neoplastic, it can be used as a corroborating piece of evidence in making such a decision, or in determining the histologic grade of a tumor (Figure 1C-3, panel C). Some apoptotic markers, such as Bcl-2 and Bcl-6, have utility in identifying the lineage of hematopoietic neoplasms and other tumors (Figure 1C-5, panel D). β-catenin, a molecule involved in the Wnt signaling pathway, shows nuclear staining in desmoid tumors, Wnt pathway-related
medulloblastomas, and colorectal lesions with aberrations of the APC pathway.
medulloblastomas, and colorectal lesions with aberrations of the APC pathway.
P53 IHC correlates with genetic TP53 status in many pediatric tumors, including gliomas, rhabdomyosarcomas, adrenal cortical neoplasms, Wilms tumors, and pleuropul-monary blastomas (27,61,62,63,64). Aberrant p53 expression in the nucleus is usually predictive of a gene mutation; the most common deleterious mutations often interfere with protein turnover. Absent p53 expression by IHC doesn’t always imply an intact p53 pathway. Nonsense mutations, deletions and chromosome 17 loss are other mechanisms by which TP53 function can be lost.
Other
Alpha-1-antitrypsin (A1AT) is expressed in normal and neoplastic liver tissue, as well as in yolk sac tumors. Its primary diagnostic utility, however, is in identifying A1AT deficiency manifest as strong cytoplasmic positivity in the setting of hepatic or pulmonary disease; recall that the disorder affects A1AT export, not production, so the mutated protein accumulates intracellularly. A1AT is also a serine protease inhibitor (serpin), and is found in histiocytes and pancreatic and salivary duct epithelium.
Limitations
As mentioned previously, immunohistochemical stains are only useful when done properly and in a well-controlled fashion. Evaluation of appropriate controls is required every time a stain is run in order to ensure validity. Minor changes in reaction conditions or the antibody supplier can lead to major changes in results. IHC staining patterns can only be interpreted in the context of the H&E morphology, the clinical scenario, and the results of other ancillary tests. Basing a diagnosis on a single immunostain can be risky. Performing a panel of five stains that are 80% specific is bound to result in at least one stain with spurious results.
Stay updated, free articles. Join our Telegram channel

Full access? Get Clinical Tree


