7 Molecular emission spectroscopy
Fluorescence spectrophotometry
Applications
• Determination of fluorescent drugs in low-dose formulations in the presence of non-fluorescent excipients.
• In carrying out limit tests where the impurity is fluorescent or can be simply rendered fluorescent.
• Useful for studying the binding of drugs to components in complex formulations
• Widely used in bioanalysis for measuring small amounts of drug and for studying drug-protein binding.
Introduction
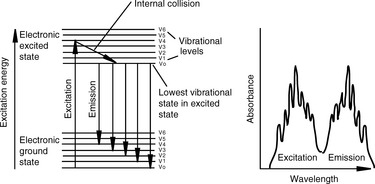
Figure 7.1 illustrates the behaviour of an excited electron in a fluorescent molecule. In a non-fluorescent molecule, when an electron is excited to the electronic excited state, it returns back to the ground state by losing the energy it has acquired through conversion of the excess electronic energy into vibrational energy. If a molecule has a rigid structure, the loss of electronic energy through its conversion into vibrational energy is relatively slow and there is a chance for the electronic energy to be emitted as ultraviolet or visible radiation. The energy emitted is of lower energy than the energy absorbed because, as indicated in Figure 7.1, the excited electron moves to the lowest energy vibrational state in the excited state before returning to the ground state. Thus fluorescence emission is typically shifted by 50–150 nm towards a longer wavelength in comparison with the wavelength of the radiation used to produce excitation. The fluorescence spectrum of a molecule is, ideally, a mirror image of the longest wavelength band in the absorption spectrum of the molecule, but often the spectrum is distorted due to partial overlap between the absorption and the emission spectra. Vibrational fine structure of the fluorescence band may be observed if the molecule does not interact with the solvent strongly (cf. UV spectra) and can be observed in the fluorescence spectra of polycyclic aromatic hydrocarbons such as anthracene. The shape of the fluorescence spectrum is independent of the wavelength used for excitation, since the transition producing the fluorescence spectrum is always from the first excited state to the ground state. In a molecule containing a number of UV absorption bands, the longest wavelength maximum is the one associated most strongly with the production of fluorescence. In addition, the wavelength usually used to produce excitation is close to the λ max of the longest wavelength absorption band in the spectrum of the analyte.
Instrumentation
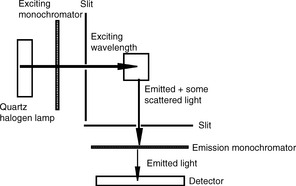
Figure 7.2 shows a schematic diagram of a fluorescence spectrophotometer. Since emission is being observed, the light being emitted is observed at right angles to the light being used to excite the sample.
Molecules which exhibit fluorescence
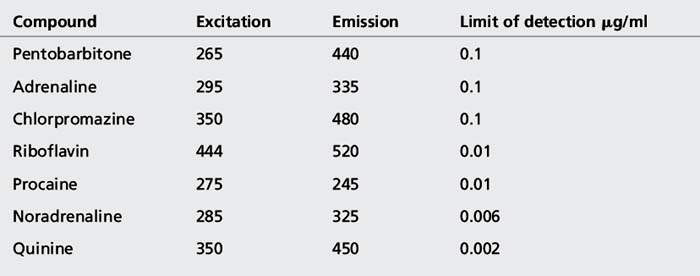
It is not entirely possible to predict how strongly fluorescent a molecule will be. For example, adrenaline and noradrenaline differ in their structures by only a single methyl group but noradrenaline exhibits fluorescence nearly 20 times more intensely than adrenaline. Generally, fluorescence is associated with an extended chromophore/auxochrome system and a rigid structure. Quinine (Fig. 7.3) is an example of a strongly fluorescent molecule, as might be expected from its extended chromophore and rigid structure. The chromophore in ethinylestradiol is just an aromatic ring but the presence of a phenolic hydroxyl group in combination with a rigid ring structure in the rest of the molecule renders it fluorescent (Fig. 7.3).
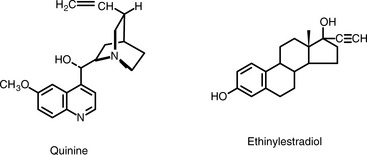
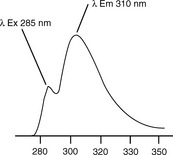
Figure 7.4 shows the fluorescence spectrum of ethinylestradiol. When the fluorescence spectrum of the molecule is scanned with a wavelength of 285 nm being used for excitation, two maxima are seen. The maxima at 285 nm is due to scatter of the exciting radiation and the second, more intense, maximum at 310 nm is due to fluorescence. The separation of the exciting radiation and emitted radiation is not great in this example, but this is partly because excitation is taking place at a relatively short wavelength, where the displacement of wavelength with energy is lower. For example, the difference between 285 and 310 nm is 0.35 eV, whereas with an excitation wavelength at 385 nm, an energy displacement of 0.35 eV would give an emission wavelength at 443 nm.
Like ethinylestradiol, many other phenols exhibit fluorescence and, as is the case for ethinylestradiol, this fluorescence is pH dependent and does not occur under alkaline conditions, when the phenolic group becomes ionised. Table 7.1 shows some examples of fluorescent drug and vitamin molecules.
< div class='tao-gold-member'>


