9 Mass spectrometry
Principles
• Charged molecules or molecular fragments are generated in a high-vacuum region, or immediately prior to a sample entering a high-vacuum region, using a variety of methods for ion production. The ions are generated in the gas phase so that they can then be manipulated by the application of either electric or magnetic fields to enable the determination of their molecular weights.
Applications
• Mass spectrometry provides a highly specific method for determining or confirming the identity or structure of drugs and raw materials used in their manufacture.
• Mass spectrometry in conjunction with either gas chromatography (GC–MS) or liquid chromatography (LC–MS) provides a method for characterising impurities in drugs and formulation excipients.
• GC–MS and LC–MS provide highly sensitive and specific methods for determining drugs and their metabolites in biological fluids and tissues.
• Mass spectrometry has become an important tool in proteomics, which is currently a major tool in drug discovery.
Strengths
• The best method for getting rapid identification of trace impurities, which should ideally be carried out using chromatographic separation in conjunction with high-resolution mass spectrometry so that elemental compositions can be determined
• The method of choice for monitoring drugs and their metabolites in biological fluids because of its high sensitivity and selectivity.
• With the advent of electrospray mass spectrometry and the re-emergence of time of flight mass spectrometry, the technique will be of major use in the quality control of therapeutic antibodies and peptides.
Limitations
• Mass spectrometry is not currently used in routine quality control (QC) but is placed in a research and development (R&D) environment, where it is used to solve specific problems arising from routine processes or in process development
• The instrumentation is expensive and requires support by highly trained personnel and regular maintenance. However, these limitations are gradually being removed with open access instruments becoming more common.
Ion generation
Electrospray ionisation (ESI)
ESI began to be popularised around 20 years ago and has revolutionised the applicability of MS as an analytical tool. Thus ESI is now the most widely applied method of ionisation because of its ready compatibility with high-pressure liquid chromatography (HPLC). The ionisation takes place under atmospheric pressure. The basis of the technique is shown in Figure 9.1.
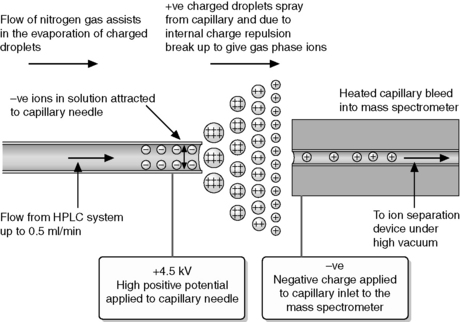
Figure 9.2 shows an electrospray spectrum of the basic drug acebutolol, the positive charge on the molecule is generated by its basic centre being protonated, this occurs even in a weakly acidic HPLC mobile phase. The main ion seen at m/z 337.2 (m/z stands for mass over charge ratio) is due to the molecular weight of the drug plus a proton. ESI is known as a soft ionisation technique and in Figure 9.2 it can be seen that there is little fragmentation of the molecule. A very minor fragment can be observed at m/z 319.2, which is due to the loss of water (18 amu). Two additional features of the spectrum should be noted:
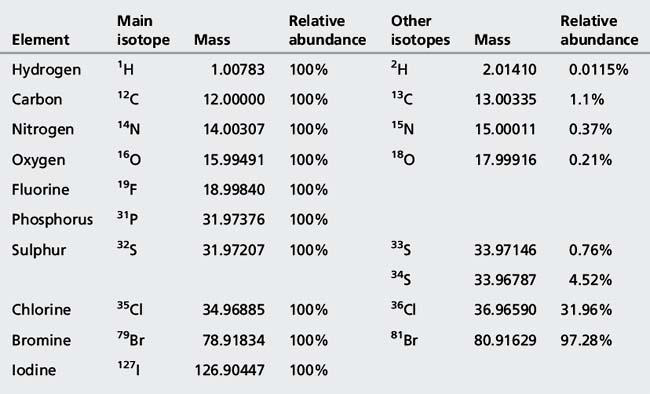
1. The ion separation used in this case was based on a quadrupole (discussed later) which measures masses to approximately one decimal place and the mass measured for protonated acebutolol (C18H29N2O4) is greater than the mass of 337 amu, which would be obtained by adding up all the atoms making it up according to their nominal masses, i.e. C=12, H=1, N=14 and O=16. The greatest deviation from nominal mass is for hydrogen (Table 9.1), which has an exact mass of 1.00783. Hydrogen is very abundant in drug molecules and the presence of 29 hydrogen atoms in protonated acebutolol increases its mass by 29 × 0.00783 = 0.23 above its nominal mass of 337 and thus the quadrupole measures it at approximately 337.2 amu.
2. There is an additional peak which is abundant in the mass spectrum at m/z 338.2. This is due to protonated acebutolol where one of the 18 carbon atoms making up the molecule is due to a 13C atom. There is a 1.1% probability that a 13C atom will occur and where there are 18 C atoms there is a 1.1×18 = 19.8% probability that one of them will be a 13C atom. Thus the ion at m/z 338.2 is approximately 20% of the intensity of the ion at m/z 337.2. The abundances of the isotopes for H, N and O are much lower and do not contribute very much in this case. The halogen atoms chlorine and bromine have abundant isotopes and their isotope peaks can be useful in structure elucidation. The exact masses and isotope abundances of atoms commonly found in drug molecules are summarised in Table 9.1.
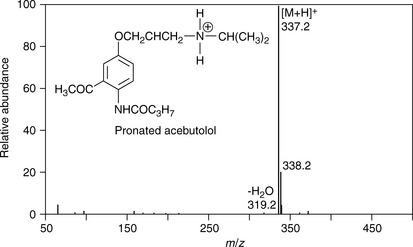
Table 9.1 Elements commonly found in drug molecules with their exact masses, isotopes and isotope abundances
ESI can also produce negative ions if the polarity on the spray needle is reversed so that it attracts positive ions thus producing a negatively charged spray. Figure 9.3 shows the ESI mass spectrum of ketoprofen, which forms a negatively charged anion at m/z 253.1. In addition, the spectrum is dominated by an adduct ion formed between ketoprofen and formate, which was used as an additive in the HPLC mobile phase. Adduct formation can occur both in positive and negative ion mode but is usually more pronounced in negative ion mode. It can occur even with trace levels of contaminants in the mobile phase, and it can be seen that the spectrum of ketoprofen also contains an ion at m/z 289.1, which is due to adduct formation with traces of Cl− in the mobile phase. It can also be observed that there are more background ions present in the spectrum of ketoprofen and the ions at m/z 91.0 and 137.0 are due to clusters of 2 and 3 formic acid molecules. Table 9.2 lists common adduct ions which are observed in ESI spectra.
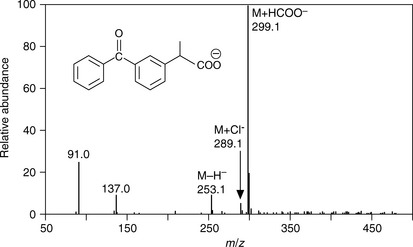
Table 9.2 Some of the commonly observed additions to molecular ions observe under electrospray ionisation (ESI) conditions
| Adduct | Comment | |
| Addition + ve ion amu | ||
| 18 | NH4+ | More likely to occur with ammonium in the mobile phase |
| 22 | Na+ | Forms readily with traces of Na+ in mobile phase |
| 32 | CH3OH | With methanol in mobile phase |
| 39 | K+ | Less common than Na, adduct forms with traces of K+ in the mobile phase |
| 41 | CH3CN | Formed with acetonitrile in mobile phase |
| 54 | CH3OH/Na+ | Formed with methanol in mobile phase + traces of Na+ |
| 63 | CH3CN/Na+ | Formed with acetonitrile in mobile phase + traces of Na+ |
| Addition −ve ion amu | ||
| 35 | Cl− | Formed with traces of Cl− in mobile phase |
| 45 | HCOO− | With formate in mobile phase |
| 60 | CH3COO− | With acetate in mobile phase |
Electron impact ionisation (EI)
(i) The sample is introduced into the instrument source by heating it on the end of a probe until it evaporates, assisted by the high vacuum within the instrument or via a capillary GC column.
(ii) Once in the vapour phase, the analyte is bombarded with the electrons produced by a rhenium or tungsten filament, which are accelerated towards a positive target with an energy of 70 eV (Fig. 9.4). The analyte is introduced between the filament and the target, and the electrons cause ionisation as follows:
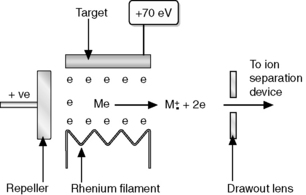

(iii) Since the electrons used are of much higher energy than the strength of the bonds within the analyte (4–7 eV), extensive fragmentation of the analyte usually occurs.
(iv) The molecule and its fragments are pushed out of the source by a repeller plate which has the same charge as the ions generated.
Figure 9.5 shows the EI spectrum of ketoprofen. Ions generated under EI conditions are always positive and thus the ion at m/z 254 is exactly the molecular weight of ketoprofen minus the very small mass of an electron. If there is an electronegative atom in the molecule, such as oxygen or nitrogen, usually the positive charge is located there. Unlike the ESI spectrum of ketoprofen shown in Figure 9.3 the EI spectrum of ketoprofen contains many fragment ions because of the high energy nature of the ionisation process. This is an advantage when it comes to structural confirmation since the spectrum provides a unique fingerprint of the molecule which can be matched against a library spectrum and also can be interpreted. Identifying all of the fragment ions in an EI spectrum is often not easy and ketoprofen provides a less common example where many of the fragment ions can be explained (Fig. 9.6).
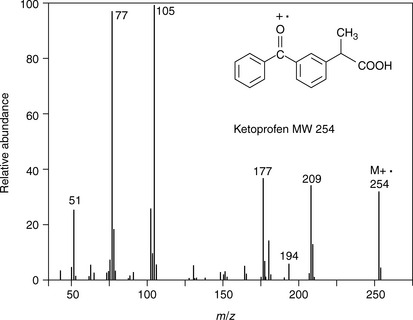
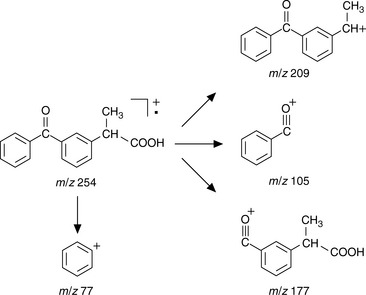
Fig. 9.6 Structure of the ions generated in the electron impact ionisation (EI) mass spectrum of ketoprofen.
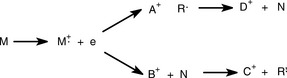
Figure 9.7 shows a generalised scheme for decomposition of a molecule under EI conditions. The principles of the scheme are as follows:
(i) M+· represents the molecular ion which bears one positive charge since it has lost one electron, and the unpaired electron which results from the loss of one electron is represented by a dot. Such an ion is known as a radical cation.
(ii) M+· may lose a radical, which, in a straightforward fragmentation not involving rearrangement, can be produced by the breaking of any single bond in the molecule. The radical removes the unpaired electron from the molecule, leaving behind a cation A+.
(iii) This cation can lose any number of neutral fragments (N), such as H2O or CO2, but no further radicals.
(iv) The same process can occur in a different order with a neutral fragment (H2O, CO2, etc.) being lost to produce B+, and since this ion still has an unpaired electron it can lose a radical to produce C+; this ion can thereafter only lose neutral fragments.
To summarise, the following rules apply to mass spectrometric fragmentation:
(a) The molecular ion can lose only one radical but any number of neutral fragments.
(b) Once a radical has been lost only neutral fragments can be lost thereafter.
Table 9.3 shows typical fragments which are lost under EI conditions to give the complex fingerprint pattern of a particular molecule. Further examples of EI spectra will be discussed later in the chapter.
Table 9.3 Common losses from a molecular ion
| Loss amu | Radicals/neutral fragments lost | Interpretation |
| 1 | H· | Often a major ion in amines, alcohols and aldehydes |
| 2 | H2 | |
| 15 | CH3· | Most readily lost from a quaternary carbon |
| 17 | OH· or NH3 | |
| 18 | H2O | Readily lost from secondary or tertiary alcohols |
| 19/20 | F·/HF | Fluorides |
| 28 | CO | Ketone or acid |
| 29 | C2H5· | |
| 30 | CH2O | Aromatic methyl ether |
| 31 | CH3O· | Methyl ester/methoxime |
| 31 | CH3NH2 | Secondary amine |
| 32 | CH3OH | Methyl ester |
| 33 | H2O + CH3· | |
| 35/36 | CI·/HCI | Chloride |
| 42 | CH2= C=O | Acetate |
| 43 | C3H7· | Readily lost if isopropyl group present |
| 43 | CH3CO· | Methyl ketone |
| 43 | CO + CH3· | |
| 44 | CO2 | Ester |
| 45 | CO2H· | Carboxylic acid |
| 46 | C2H5OH | Ethyl ester |
| 46 | CO + H2O | |
| 57 | C4H9· | |
| 59 | CH3CONH2 | Acetamide |
| 60 | CH3COOH | Acetate |
| 73 | (CH3)3Si· | Trimethylsilyl ether |
| 90 | (CH3)3SiOH | Trimethylsilyl ether |
Matrix assisted laser desorption ionisation (MALDI)
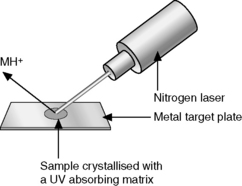
MALDI uses a nitrogen laser to promote ionisation of molecules prior to ion separation in a mass spectrometer. It is usually combined with time of flight (TOF) separation of the ions generated. In order for the sample to be ionised it has to be dissolved in a matrix that absorbs UV radiation at around the wavelength (337 nm) produced by the laser. A simple example of a matrix is dihydroxybenzoic acid and there are a number of similar aromatic compounds which are used to promote ionisation of different classes of molecules. The sample solution is mixed with matrix solution on a metal plate and allowed to dry prior to being introduced into the instrument. The laser is then directed at the target plate to promote ionisation (Fig. 9.8).
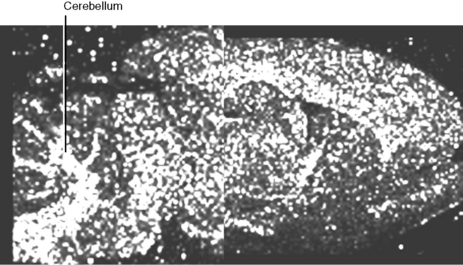
MALDI is also useful for the ionisation of other polar biomolecules and Figure 9.9 shows the ions generated from coenzyme A and two acyl CoAs using MALDITOF in negative ion mode. Another use of MALDI in pharmaceutical development is in the characterisation of pharmaceutical polymers. These usually comprise a mixture of chain lengths and MALDIMS can provide a molecular size distribution for these materials providing one method for setting a quality standard for such materials. The disadvantage of MALDIMS is that it is not readily quantitative and cannot be linked directly with HPLC. However, another area where MALDI has proved useful has been in tissue imaging where a tissue section is coated with matrix and the MALDIMS instrument is used to scan across the tissue in ca 0.1 mm steps to image the tissue in terms of the molecules making it up which could for instance lead to a better understanding of a disease process or find the site of accumulation of a drug within the tissue.
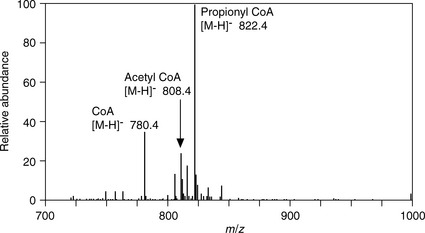
Figure 9.10 shows a MALDIMS image of an experimental antipsychotic drug in rat brain, one of the major sites of accumulation is in the cerebellum.
< div class='tao-gold-member'>
Stay updated, free articles. Join our Telegram channel

Full access? Get Clinical Tree


