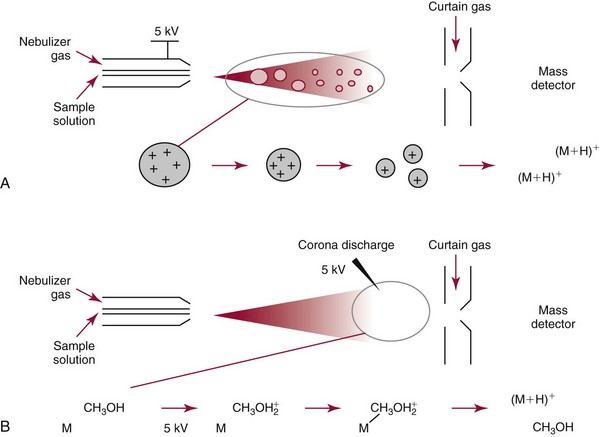
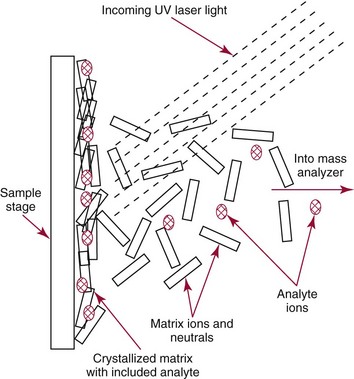
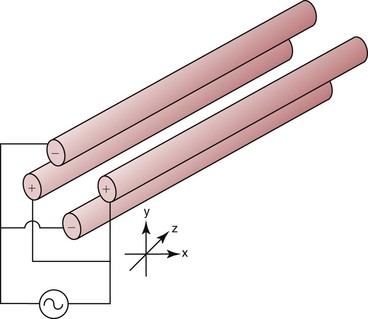
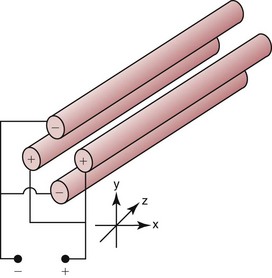
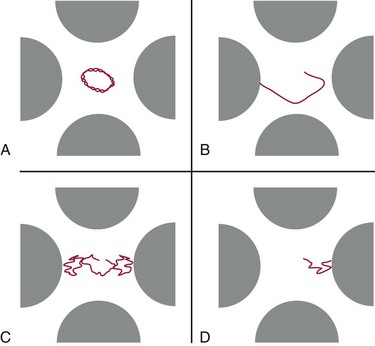
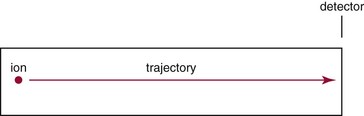
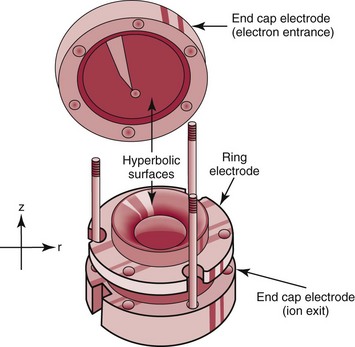
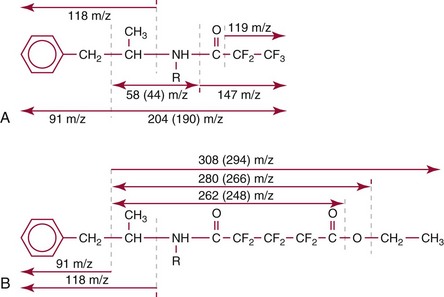
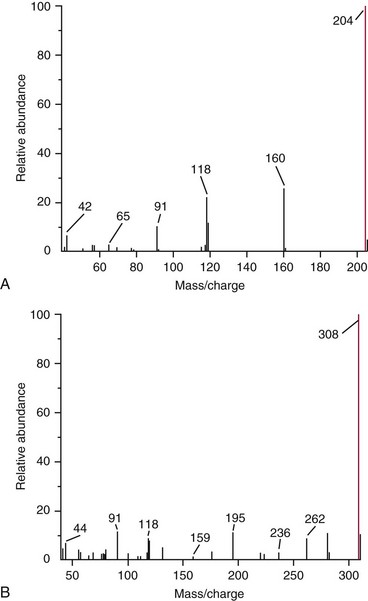
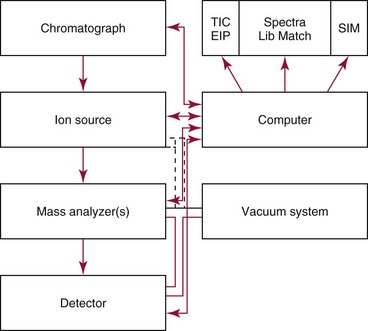
Chapter 14 We begin this chapter with a discussion of the basic concepts and definitions of MS followed by discussions of MS instrumentation and clinical applications, and we end the chapter with a discussion of logistic/operational/quality issues. In this chapter, it is impossible to cover all concepts in a field as vast as mass spectrometry, even if one limits one’s focus to clinical mass spectrometry. The Clinical and Laboratory Standards Institute (CLSI) has published recommendations on clinical mass spectrometry that can serve as a good next step for study of this topic and another gateway into the extensive literature on this topic.27 MS is the branch of science that deals with all aspects of mass spectrometers and the results obtained with them. Molecular mass (sometimes referred to as molecular weight) is measured in units of unified atomic mass unit (u), also known as the dalton (Da). The mass of a carbon atom in its lowest energy state is defined as 12 Da. Although the term atomic mass unit (amu) has been regarded as equivalent to the Da, it is only approximately equal to the Da and now is considered an obsolete unit; its use to refer to the Da is strongly discouraged. A mass spectrometer is an analytical instrument that first ionizes a target molecule and then separates and measures the mass of a molecule or its fragments. Mass analysis is the process by which one or more ionic species are identified according to the mass-to-charge ratio (m/z).117 The analysis is qualitative, quantitative, and extremely useful for determining the elemental composition and structure of both inorganic and organic compounds. All MS techniques require an ionization step in which an ion is produced from a neutral atom or molecule. In fact, the development of versatile ionization techniques caused MS to become the excellent analytical tool it is today. In 2002, John Fenn and Koichi Tanaka shared the Nobel Prize for their development of electrospray43,44 and laser desorption72,92,115 ionization, respectively. A mass spectrum is represented by the relative abundance of each ion plotted as a function of its m/z ratio (Figure 14-1). Usually, each ion has a single charge (z = 1); thus the m/z ratio is equal to the mass. However, in some cases, the charge may be represented by some other integer number, in which case the m/z ratio is not equal to the mass, but rather is some fraction of the mass. A distinct advantage of the mass spectrometer is that it can simultaneously differentiate and quantify a compound with a normal abundance of isotope from an analog enriched with a stable isotope [e.g., (1) 2H relative to 1H, (2) 13C relative to 12C, (3) 15N relative to 14N, (4) 18O relative to 16O]. A compound labeled with a stable isotope is used as an internal standard because it behaves nearly identically to the native compound during sample preparation and chromatographic analysis. The internal standard must have a sufficient amount of heavy isotope so that no naturally occurring isotope (such as 2H or 13C) contributes significantly to the ion current. For the methamphetamine derivatives shown in Figure 14-2, an internal standard with at least three 2H or 13C atoms is preferred, because at this point the natural abundance of these isotopes is ≈0.1% at 3 mass units above the molecular ion [(M+3)+]. Placement of the stable isotope atoms in the structure is also important. For example, the m/z 204 ion for methamphetamine represents the aliphatic portion of the molecule (loss of the aromatic ring). If five deuterium atoms were present on the aromatic ring of methamphetamine, the pentafluoropropionyl derivatives of both native and isotope-labeled drug would yield the m/z 204 ion. Similarly, the stable isotope must be located so that it will not exchange with solvent molecules. The ability to quantify a compound relative to an isotopic species of known or fixed concentration is known as isotope dilution analysis, and the specific mass spectrometric technique is known as isotope dilution mass spectrometry (IDMS). The IDMS technique has been used to develop definitive methods for a number of clinically relevant analytes including drugs of abuse. Figure 14-2 Fragmentation patterns for the pentafluoropropionyl (A) and carbethoxyhexafluorobutyryl (B) derivatives of methamphetamine (R = CH3) and amphetamine (R = H; masses in parentheses). Compare the predicted masses with the spectrum shown in Figure 14-1. Note that for the pentafluoropropionyl derivative, only one ion (204, 190 m/z) is characteristic of the aliphatic portion of the molecule. A mass spectrometer consists of (1) an ion source, (2) a vacuum system, (3) a mass analyzer, (4) a detector, and (5) a computer (Figure 14-3). Many approaches have been used to form ions in both high-vacuum and near-atmospheric pressure conditions. Electron ionization (EI) and chemical ionization (CI) are ionization techniques used when gas-phase molecules are introduced directly into the analyzer from a gas chromatograph. In other analyses, such as high-performance liquid chromatography-mass spectrometry (HPLC-MS), electrospray ionization (ESI), atmospheric pressure chemical ionization (APCI), and atmospheric pressure photoionization (APPI) interfaces are used as ionization sources.19,41,50,60 Other ionization techniques include (1) inductively coupled plasma (ICP), (2) matrix-assisted laser desorption ionization (MALDI), (3) atmospheric pressure matrix-assisted laser desorption (AP-MALDI), and (4) a number of other less well-known sources. This chapter will limit its discussion to ion sources of interest to clinical chemical analysis. The CLSI document C-50A contains recommendations for matching the capabilities of different ion source technologies to various application classes.27 In EI, gas-phase molecules are bombarded by electrons emitted from a heated filament and attracted to a collector electrode (Figure 14-4). This process must occur in a vacuum to prevent filament oxidation. A potential difference of 70 eV generates electrons with sufficient energy that a near collision with most organic molecules produces a radical cation that is both an ion and a radical.117 The radical ion then often undergoes unimolecular rearrangement and dissociation to produce a cation and a radical: ESI is a soft ionization technique in which a sample is ionized at atmospheric pressure before introduction into the mass analyzer.121,126 The sample, typically an HPLC effluent, is passed through a narrow metal or fused silica capillary to which a 3- to 5-kV voltage has been applied (Figure 14-5, A). The partial charge separation between the liquid and the capillary results in instability in the liquid that in turn results in expulsion of a series of charged droplets from a Taylor cone, which forms at the tip of the capillary. A coaxial nebulizing gas, which is used in several types of ESI sources, helps direct the charged droplets toward a counter-electrode. The droplets evaporate as they migrate through the atmospheric pressure region, expelling smaller droplets as the charge-to-volume ratio exceeds the Raleigh instability limit. The proton- or ammonium-adduct of the molecule, which may be associated with solvent molecules, is “desolvated” to form “bare” ions and is typically formed in the ionization process. However, other ionization products are sometimes observed, such as metal ion adducts with analyte molecules, or ions formed by redox processes. Ions then pass through a sampling cone and one or more extraction cones (skimmers) before entering the high-vacuum region of the mass analyzer. It should be noted that Figure 14-5 is a simplified illustration of the probe being directed toward the sampling cone of the mass detector. To enhance performance and minimize contamination of the mass detector, many modern hardware configurations have offset the probe and/or the mass detector relative to the sampling cone. APCI is similar to ESI in the sense that ionization takes place at atmospheric pressure, involves nebulization and desolvation, and uses the same sample and extraction cones as ESI. The major difference lies in the mode of ionization. In APCI, no voltage is applied to the inlet capillary. Instead, a separate corona discharge needle17 is used to generate a corona discharge. Somewhat analogously to the processes occurring in a CI source, ions generated by the corona discharge undergo ion-molecule reactions such as the following: Because eluent solvent molecules (e.g., water, methanol) are present in excess relative to analytes in the sample, they are predominantly ionized early in the ion molecule cascade and then act as a reagent gas that reacts secondarily to ionize analyte molecules (Figure 14-5, B). Because the products of these secondary reactions may contain clusters of solvent and analyte molecules, a heated transfer tube or a countercurrent flow of a curtain gas, such as nitrogen, is used to decluster the ions. As with ESI, APCI is a soft ionization technique that produces relatively little fragmentation. Thus, compared with EI, the mass spectrum produced by APCI and other soft ionization techniques is less useful for analyte identification by mass spectral fingerprinting. However, because the ion current is concentrated into a single mass spectral peak (or relatively few mass spectral peaks if isotope peaks are considered), APCI and other soft ion sources are well matched to the requirements of tandem mass spectrometry (discussed later) and the combination of the two used for quantitative analysis. APCI and ESI are generally useful for a similar range of compounds. However, APCI is often a more efficient ion source than ESI for relatively nonpolar compounds. APPI is a relatively new and less frequently used ion source in clinical chemistry that provides a complementary approach to ESI or APCI. The physical configuration of an APPI source is similar to that for APCI, but an ultraviolet photon flux is used instead of a corona discharge needle to generate ions in the gas phase.100,111,112 In APPI, an ionizable dopant, such as toluene or acetone, is often infused coaxially to the nebulizer to provide a source of ions that provide charge or proton transfer to analytes, thus increasing the efficiency of analyte ionization. APPI has a similar range of application to APCI but is often more useful than APCI for compounds of very low polarity, such as many steroids. ICP-MS is comparatively free from most interference. However, some interfering species can be extremely troublesome. Most interfering species are small polyatomic ions formed in the torch via ion-molecule reactions. For example, ArO+ interferes with iron at m/z 56. One solution to this problem is to use a reaction cell, which consists of a moderate-pressure gas placed before the m/z analyzer.12 A reactant gas, such as NH3, is bled into the reaction cell. The reactant gas reacts with polyatomic interferences and removes them before introduction into the m/z analyzer. Another approach to removing interferences of the same nominal mass is to use a high-resolution mass spectrometer, which is capable of resolving species with similar nominal mass.12 For example, the masses of ArO+ and 56Fe+ differ by 0.022 Da—a difference that is easily resolved using a high-resolution mass spectrometer. MALDI and related techniques rely on energy transfer processes from a pulsed laser beam to the sample for ion generation. In most cases, the analyte is dissolved in a solution of matrix, a small molecular weight UV-absorbing compound, and this solution is placed on a target that is introduced into the mass spectrometer. A UV laser vaporizes small amounts of matrix and analyte into a plume of ions that is directed into a mass analyzer (Figure 14-6). MALDI is another of the “soft” ionization methods. Related techniques include atmospheric pressure matrix-assisted laser desorption/ionization, in which the MALDI process occurs at atmospheric pressure rather than reduced pressure, and surface-enhanced laser desorption ionization (SELDI), which uses a MALDI target surface modified with some type of affinity capture property [hydrophobic, ionic, immobilized metal affinity chromatography (IMAC), DNA, antibody, etc]. Sonic spray ionization is one of the lesser used ionization methods with potential utility for clinical mass spectrometry.53,54 It is as yet uncertain whether this technology has sufficient advantages over ESI and APCI to find frequent application, although it may find application for the analysis of thermally labile compounds. Desorption electrospray ionization (DESI)114 and direct analysis in real time (DART)28 are two relatively new ionization methods that exemplify the generation of ions from surfaces at atmospheric pressure. Most applications of DESI and DART to date have been directed toward minimal sample preparation. The term mass spectrometry is somewhat a misnomer because mass spectrometers do not measure molecular mass, but rather they measure mass-to-charge ratio. This fact is fundamental to the physical operating principles of mass spectrometers and consequently affects all aspects of instrumentation design and operation and interpretation of results. The symbol m/z is used to denote mass-to-charge ratio and conventionally has been defined as a dimensionless quantity.97 However, a “dimensionless” mass-to-charge ratio is not consistent with equations of ion motion in the presence of electric and magnetic fields, which require units of mass divided by charge. Furthermore, the m/z scale sometimes is loosely discussed in terms of daltons (Da, also known as unified atomic mass units, u), although strictly speaking, Da is a unit of mass, not mass-to-charge ratio. Despite these nomenclature issues, the present chapter often follows conventional practices by discussing m/z in terms of mass and Da. To help avoid some of the confusion surrounding the use of m/z, it has been proposed that it should be defined explicitly as quantity having units of mass-to-charge ratio, with mass specified in daltons and charge specified in elementary charges, and that this unit should be called the Thomson (Th) in honor of one of the pioneers of MS.29,36 This terminology is sometimes seen in the literature but has not yet been widely adopted. In a trapping-type analyzer, ions are held in a spatially confined region of space through a combination of magnetic and/or electrostatic and/or RF electrical fields. The trapping fields are manipulated in ways that allow m/z measurements to be performed. Trapping times may range from a fraction of a second to minutes, although most clinical applications are at the low end of this range. Detection of the ions in a trapping-type instrument may be destructive or nondestructive, depending on the specific type of mass spectrometer used. In this context, “destructive” means that ions are destroyed in the detection process. Additional discussions of mass analyzers, tandem mass spectrometers, and ion detectors are available,35,107 and the CLSI document C-50A contains recommendations for matching the capabilities of different m/z analyzers to various application classes.27 Quadrupole: Quadrupole mass spectrometers, sometimes known as quadrupole mass filters (QMFs), are currently the most widely used mass spectrometers, having displaced magnetic sector mass spectrometers as the standard instrument. Although these instruments lag behind magnetic sector instruments in terms of (1) sensitivity, (2) upper mass range, (3) resolution, and (4) mass accuracy, they offer an attractive and practical mix of features that accounts for their popularity, including (1) ease of use, (2) flexibility, (3) adequate performance for most applications, (4) relatively low cost, (5) noncritical site requirements, and (6) highly developed software systems. A quadrupole mass spectrometer consists of four parallel electrically conductive rods arranged in a square array (Figure 14-7). The four rods form a long channel through which the ion beam passes. The beam enters near the axis at one end of the array, passes through the array in a direction generally parallel to the axis, and exits at the far end of the array. The ion beam entering the quadrupole array may contain a mixture of ions of various m/z values, but only ions of a very narrow m/z range (typically Δm/z<1) are successfully transported through the device to reach the detector. Ions outside this narrow range are ejected radially. The Δm/z range represents a pass band, analogous to the pass band of an interference filter in optics (see Chapter 10), which is why quadrupole mass spectrometers are often referred to as mass filters rather than mass spectrometers. Quadrupole mass spectrometers rely on a superposition of RF and constant direct current, or DC potentials applied to the quadrupole rods. DC voltages are applied to the electrodes in a quadrupolar pattern. For example, a positive DC potential is applied to electrodes 1 and 3, as indicated in Figure 14-8, and an equivalent negative DC potential is applied to electrodes 2 and 4. The DC potentials are relatively small, on the order of a few volts. Superimposed on the DC potentials are RF potentials, also applied in a quadrupolar fashion. RF potentials range up to the kilovolt range, and frequency is on the order of 1 MHz. The frequency is typically fixed and highly stable, although variable frequency operation is possible in principle. The physical principles underlying the operation of a quadrupole mass spectrometer are rigorously described by solutions of a complicated differential equation, the Mathieu equation.33 When an ion is subjected to a quadrupolar RF field, its trajectory is described qualitatively as a combination of fast and slow oscillatory motions. For descriptive purposes, the fast component will be ignored here. The slow component oscillates about the quadrupolar axis; this resembles the motion of a particle in a fictitious harmonic pseudopotential. The frequency of this oscillation is sometimes called the secular frequency. The effective force associated with the pseudopotential is directed inward toward the quadrupolar axis and is proportional to the distance from the axis. It therefore acts as a confining force, preventing ions from being ejected radially from the quadrupolar assembly. Figure 14-9, A, shows an example of an ion confined by an RF-only quadrupole. Below a certain m/z cutoff frequency (which depends on the frequency and amplitude of the RF field), ions are ejected rather than confined. Figure 14-9, B, shows an example of an ion ejected by an RF-only quadrupolar field. This establishes the low mass cutoff for the m/z pass band. The effective confining force is strongest just above the low m/z cutoff, and then decreases asymptotically toward zero at high m/z. The DC part of the quadrupolar potential is independent of m/z. Positive ions are attracted toward the negative poles. Negative ions are attracted toward the positive poles. Attraction increases as the distance from the quadrupolar axis increases. Because a quadrupolar DC potential always has both negative and positive poles, the quadrupolar DC potential always contributes to ejection in at least one direction. Whether ejection of an ion of a particular m/z actually occurs depends on whether the ejecting force caused by the quadrupolar DC potential overcomes the effective confining force caused by the pseudopotential generated by the RF field. Above a certain m/z value, the DC part dominates, and ions are ejected radially from the device. This establishes an upper m/z limit for ion transmission. Figures 14-9, C and D, shows examples of ion trajectories under the influence of combined RF-DC fields, one being confined and the other being ejected. Trajectories in Figure 14-9 were calculated using the Simion ion optics computer program.31 Magnetic Sectors: Because magnetic sector mass spectrometers are rarely used in the clinical laboratory they will not be described in detail here. For an introduction to magnetic sector technology, refer to the third edition of this book. It should be noted, however, that these classic mass spectrometers are easy to understand (given a basic understanding of physics); are versatile, reliable, and highly sensitive; and in their “double focusing” variation are capable of very high m/z resolution and mass accuracy. However, they are typically expensive, large, and heavy. In addition, they have the reputation of being difficult to use. Consequently, other instruments have largely displaced magnetic sector mass spectrometers. Time-of-Flight: TOF mass spectrometry (TOF-MS) is a nonscanning technique whereby a full mass spectrum is acquired as a snapshot rather than by sweeping through a sequential series of m/z values while sampling the sample. TOF mass spectrometers have several advantages, including (1) a nearly unlimited m/z range, (2) high acquisition speed, (3) high mass accuracy, (4) moderately high resolution, (5) high sensitivity, and (6) reasonable cost. They are also well adapted to pulsed ionization sources, which is an advantage in some applications, particularly with MALDI and related techniques.14 A major advantage of modern TOF mass spectrometers is that some of them produce so-called accurate mass measurements, sometimes loosely referred to as exact mass, which is typically accurate to a few parts per million (ppm). This allows TOF measurements to confirm the molecular formula of a compound. Unlike magnetic sector instruments, which are also capable of accurate mass measurements. TOF mass spectrometers are conceptually simple to understand because they are based on the fact that a lighter ion travels faster than a heavier ion, provided that both have the same kinetic energy. Figure 14-10 presents a simplified conceptual diagram of a TOF mass spectrometer. It resembles a long pipe. Ions are created or injected at the source end of the device and are then accelerated by a potential of several kilovolts. They travel down the flight tube and strike the detector at the far end of the flight tube. The time it takes to traverse the tube is known as the flight time; this is related to the mass-to-charge ratio of the ion. TOF is inherently a pulsed technique; it couples readily to pulsed ionization methods, with MALDI being the most common example, although it is also possible to couple TOF with continuous ion sources such as EI, ESI, and APCI. However, the continuous nature of these sources causes a natural mismatch between continuous ion sources and TOF-MS, which is a pulsed technique. This mismatch is overcome by using a technique known as orthogonal acceleration TOF-MS (OA-TOF-MS), in which the ion beam is injected orthogonal to the axis of the TOF-MS.32,78,106 During the injection period, the acceleration voltage is turned off. Once the injection region is filled with the traversing beam, the acceleration voltage is quickly turned on, and the TOF timing cycle starts. The process is cycled repeatedly. The overall duty cycle for this method can be more than 10%; this represents a vast improvement over the traditional method of gating the ion beam. For full spectrum capability with continuous ion sources, orthogonal injection TOF mass spectrometers are generally considered to have the lowest detection limits of all mass spectrometers. However, for the monitoring of a single m/z rather than a full mass spectrum, the use of SIM mode with a quadrupole MS provides superior limits of detection. Improved resolution is an additional benefit conferred by orthogonal acceleration as applied to TOF-MS. Although a complete explanation is beyond the scope of this book, in brief, orthogonal acceleration reduces the resolution degrading effects that would normally accompany the kinetic energy variations of individual ions in the ion beam. Use of an ion mirror is a second technique often employed in TOF-MS design to improve resolution by compensating for kinetic energy variations.82,101 Such instruments are known as reflectrons. To date, TOF-MS has had a lesser impact in clinical chemistry, but it seems read to take on a greater role in the future. For example, the full-spectrum capability, high resolution (up to 40,000 in some current instruments), high speed (10 to 100 stored spectra/s), and high mass accuracy of TOF-MS seem ideally suited to applications such as high-speed drug screens in toxicology when combined with fast chromatographic sample introduction. Traditionally, ion traps have been classified as (1) a quadrupole ion trap (QIT), which relies on RF fields to provide ion trapping; (2) a linear ion trap, which is closely related to the QIT in its operating principles; and (3) an ion cyclotron resonance (ICR) mass spectrometer, which relies on a combination of magnetic fields and electrostatic fields for trapping. A fourth, the orbitrap, is a more recent introduction into the field of ion trap mass spectrometry.81A Quadrupole Ion Trap: QITs are relatively compact, inexpensive, and versatile instruments that are excellent for (1) exploratory studies, (2) structural characterization, and (3) sample identification. They are also used for quantitative analysis, although quantitative analysis is not the best use for these devices when compared with quadrupole-based instruments. The physical arrangement of a QIT is different from that of a QMF. If an imaginary axis is drawn through the y-axis of the quadrupole rods, and the rods are rotated around the axis, a solid ring with a hyperbolic inner surface results from the x-axis pair of rods. The two y-axis rods form two solid end caps. A diagram of an ion trap is given in Figure 14-11. The description of the fields within the electrodes must now include a radial component and an axial (between the end caps) component. This slightly changes the precise conditions required for ion confinement when compared with a QMF, although the qualitative description of ion confinement discussed previously is still valid.
Mass Spectrometry
Basic Concepts and Definitions
Instrumentation
Ion Source
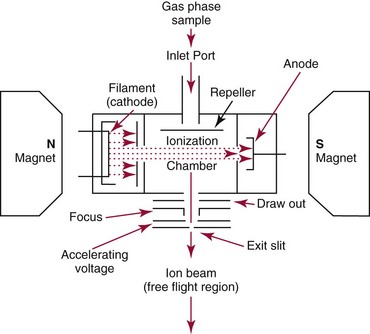
Electron Ionization

Electrospray Ionization
Atmospheric Pressure Chemical Ionization


Atmospheric Pressure Photoionization
Inductively Coupled Plasma
Matrix-Assisted Laser Desorption/Ionization
Ionization Methods of Potential Interest
Mass Analyzers, Tandem Mass Spectrometers, and Ion Detectors
General Classes of Mass Spectrometers
Beam-Type Designs
Trapping Mass Spectrometers
![]()
Stay updated, free articles. Join our Telegram channel

Full access? Get Clinical Tree


 for methane). Through a series of ion-molecule reactions, analyte ions become charged, usually via attachment of a proton. In most cases, relatively little fragmentation occurs. Negative ion electron capture CI is also possible and has become popular for quantification of drugs such as benzodiazepines. Negative ion formation occurs when thermalized electrons are captured by an electronegative substituent, such as chlorine or fluorine on the analyte. When applicable, negative ion CI has very low limits of detection. CI also is used as an ion source in GC-MS.