5 Infrared spectrophotometry
Applications
• A qualitative fingerprint check for the identity of raw material used in manufacture and for identifying drugs.
• Used in synthetic chemistry as a preliminary check for compound identity, particularly for the presence or absence of a carbonyl group, which is difficult to check by any other method.
• Can be used to characterise samples in the solid and semi-solid states such as creams and tablets.
• Used as a fingerprint test for films, coatings and packaging plastics.
• Can be used to detect polymorphs of drugs (polymorphs are different crystal forms of a molecule that have different physical properties such as solubility and melting point, which may be important in the manufacturing process and bioavailability).
Limitations
• Rarely used as a quantitative technique because of relative difficulty in sample preparation and the complexity of spectra.
• Usually can only detect gross impurities in samples.
• Sample preparation requires a degree of skill, particularly when potassium bromide (KBr) discs are being prepared.
• The technique is lacking in robustness since sample handling can have an effect on the spectrum obtained and thus care has to be taken in sample processing.
Introduction
The infrared region can be divided up as shown in Table 5.1.
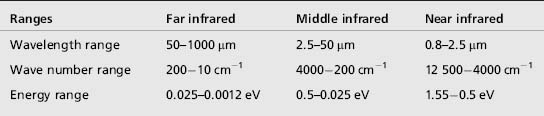
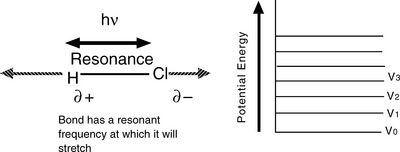
The middle-infrared region is commonly used for structural confirmation, but near-infrared spectrophotometry, which has been used for very many years to control products such as flour and animal feed, is finding increasing applications in quality control in the pharmaceutical industry. For the purposes of explaining infrared spectroscopy, a molecule is viewed as being joined by bonds which behave like springs. If the simple molecule HCl is examined in the gas phase, it can be seen that it has an absorbance maximum at ca 2900 cm−1, which results from the transition between the bottom vibrational state V0 and the first excited state V1 (Fig. 5.1). The spacing of the lower vibrational levels in IR spectrophotometry is equal, so even if the V1–V2 transition occurred, the energy absorption would be the same as for V0–V1. Quantum mechanics does not allow a V0–V2 transition, although these types of transition over 2 or 3 levels occur weakly and give rise to near-infrared spectra.
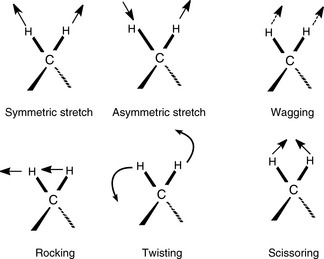
In order for the electrical component in electromagnetic radiation to interact with a bond, the bond must have a dipole. Thus symmetrical bonds, such as those in O2 or N2, do not absorb infrared radiation. However, the majority of organic molecules have plenty of asymmetry. Even in small organic molecules the modes of vibration are complex. This is illustrated by the vibrational modes which can occur in a methylene group, shown in Figure 5.2. The large number of bonds in polyatomic molecules means that the data obtained by IR analysis is extremely complex and provides a unique ‘fingerprint’ identity for the molecule. Quite a lot of structural information can be obtained from an IR spectrum, but even with modern instrumentation it is not possible to completely ‘unscramble’ the complex absorbance patterns present in IR spectra.
Factors determining intensity and energy level of absorption in IR spectra
Intensity of absorption
C O > C
O > C Cl > C
 N > C
N > C C
C OH > C
 C
C H
H
OH > NH > CH
The intensity depends on the relative electronegativity of the atoms involved in the bond.

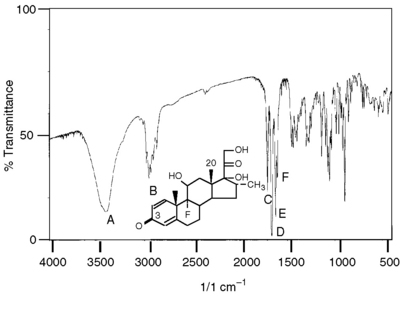
The intensity of the stretching of carbon–carbon double bonds is increased when they are conjugated to a polar double bond, and such bonds in the A ring of the corticosteroids are quite prominent (e.g. see Fig. 5.12).
The order of intensity is as follows:
C C
C C
C O > C
O > C C
C C
C C > C
C > C C
C C—
C—

 ; for C–O bonds,
 H > N
H > N H > C
H > C H > C
H > C N > C
N > C C > C
C > C O > C
O > C C > C
C > C O > C
O > C C > C
C > C F > C
F > C Cl
ClInstrumentation
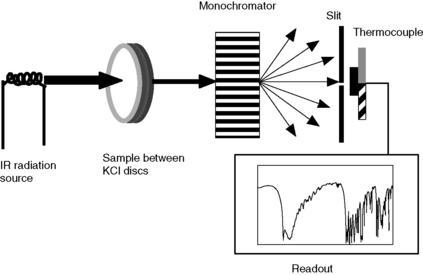
Two types of instrument are commonly used for obtaining IR spectra: dispersive instruments, which use a monochromator to select each wavenumber in turn in order to monitor its intensity after the radiation has passed through the sample, and Fourier transform instruments, which use an interferometer. The latter generates a radiation source in which individual wavenumbers can be monitored within a ca 1 s pulse of radiation without dispersion being required. In recent years, Fourier transform instruments have become very common. A simple diagram of the layout of a continuous wave instrument is shown in Figure 5.3. The actual arrangement of the optics is much more complicated than this but the diagram shows the essential component parts for a dispersive IR instrument. The filament used is made of metal oxides, e.g. zirconium, yttrium and thorium oxides, and is heated to incandescence in air. The sample is contained in various ways within discs or cells made of alkali metal halides. Once the light has passed through the sample, it is dispersed so that an individual wavenumber or small number of wavenumbers can be monitored in turn by the detector across the range of the spectrum.
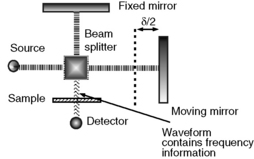
In a Fourier transform IR instrument, the principles are the same except that the monochromator is replaced by an interferometer. An interferometer uses a moving mirror to displace part of the radiation produced by a source (Fig. 5.4), thus producing an interferogram, which can be transformed using an equation called the ‘Fourier transform’ in order to extract the spectrum from a series of overlapping frequencies. The advantage of this technique is that a full spectral scan can be acquired in about 1 s, compared with the 2–3 min required for a dispersive instrument to acquire a spectrum. Also, because the instrument is attached to a computer, several spectral scans can be taken and averaged in order to improve the signal:noise ratio for the spectrum.
Instrument calibration
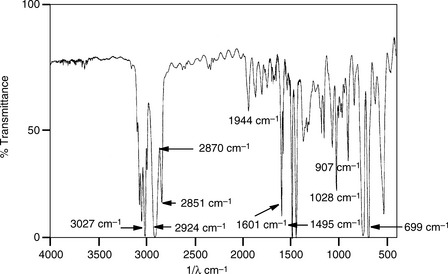
In order to ensure that instruments conform with BP specifications, the wavelength scale of the instrument is checked by obtaining an IR spectrum of polystyrene film (shown in Figure 5.5). Some of the bands used to check the accuracy of the wavelength scale of an IR spectrophotometer are shown in Figure 5.5. The permitted tolerances for variation in the wavelengths of absorption are mainly ± 0.3 nm. Two of the bands at 907 cm−1, 1028 cm−1, 1495 cm−1 or 1601 cm−1 (usually 1028 and 1601 cm−1) are overlayed onto standard BP spectra to indicate that the spectra have been obtained on a correctly calibrated instrument. In addition to specifying tolerances for the wavelength scale, the BP specifies the degree of resolution which the instrument must be capable of achieving, e.g. the maximum at 2849.5 cm−1 and the minimum at 2870 cm−1 should have a valley between them of > 18% transmittance. In Figure 5.5 the valley between the minimum and maximum at these two wavelengths is ca 25% transmittance. In addition, the difference between the percentage transmittance at the transmission maximum at 1589 cm−1 and the transmission minimum at 1583 cm−1 should be greater than 12.
Sample preparation
Traditionally three modes of sample preparation have been used prior to IR analysis:
(i) The sample is run as a film sandwiched between two NaCl or potassium chloride (KCl) discs. For this method the sample must be a liquid, in which case it can be run without preparation, or must be ground to a paste in a liquid matrix, usually liquid paraffin (Fig. 5.6). In this case the liquid paraffin (Nujol) contributes some peaks to the spectrum at ca 3000 cm−1 and ca 1400–1500 cm−1. However, sample preparation is relatively simple and this procedure is used where a chemist just wants a quick identification of certain structural features in a molecule. This procedure is also used to identify different crystal forms (polymorphs) of a drug because the pressures used to prepare KBr discs can cause polymorph interconversion.
(ii) The sample is ground to a powder with KBr or KCl. KBr is usually used unless a hydrochloride salt is being analysed, in which KCl is used to avoid halogen exchange. On a weight-for-weight basis, the weight of the sample used is about 1% of the weight of KBr used. About 200 mg of the finely ground powder are transferred to a die block and the sample is then compressed into a disc under vacuum by subjecting it to a pressure of 800 kPa (Fig. 5.6). This is the procedure used in pharmacopoeial methods to prepare a drug for analysis by IR.
(iii) IR spectra of liquids or solutions in an organic solvent, commonly chloroform, may be obtained by putting the liquid into a short pathlength cell with a width of ca 1 mm. Cells are constructed from sodium or potassium chlorides and obviously aqueous samples cannot be used.
(iv) A more recent development in sample preparation is the use of diffuse reflectance (Fig. 5.7). Diffuse reflectance is a readily observed phenomenon. When light is reflected off a matt surface, the light observed is of the same intensity no matter what the angle of observation. Samples for diffuse reflectance are treated in the same way as those prepared for KBr disc formation except that, instead of being compressed, the fine powder is loaded into a small metal cup, which is placed in the path of the sample beam. The incident radiation is reflected from the base of the cup and, during its passage through the powdered sample and back, absorption of radiation takes place, yielding an infrared spectrum which is very similar to that obtained from the KBr disc method. In fact, the spectrum produced is an absorbance spectrum rather than a transmittance spectrum, but it can be readily converted into a transmittance spectrum if the instrument is attached to a computer. The diffuse reflectance technique is widely used in near-infrared spectrophotometry and it can also be used to examine films and coatings if they are put onto a reflective background. It is also a useful technique for examining polymorphs since the sample can be prepared for analysis with minimal grinding and compression, which can cause interconversion of polymorphs.
(v) Attenuated total reflectance (ATR) is another recent development in sample handling (Fig. 5.8). In this case the sample may be run in a gel or cream, and this method may be used to characterise both formulation matrices and their interactions with the drugs present in them. If the active ingredient is relatively concentrated and if a blank of the matrix is run using the same technique it may be subtracted from the sample to yield a spectrum of the active ingredient. ATR also provides another technique which can be used for the characterisation of polymorphs.
Stay updated, free articles. Join our Telegram channel

Full access? Get Clinical Tree


