Stage
Description
pTX
Primary tumor cannot be assessed
pT0
No evidence of primary tumor
pTis
Melanoma in situ
pT1a
Melanoma 1.0 mm or less in thickness, no ulceration, <1 mitoses/mm2
pT1b
Melanoma 1.0 mm or less in thickness with ulceration and/or 1 or more mitoses/mm2
pT2a
Melanoma 1.01–2.0 mm in thickness, no ulceration
pT2b
Melanoma 1.01–2.0 mm in thickness, with ulceration
pT3a
Melanoma 2.01–4.0 mm in thickness, no ulceration
pT3b
Melanoma 2.01–4.0 mm in thickness, with ulceration
pT4a
Melanoma >4.0 mm in thickness, no ulceration
pT4b
Melanoma >4.0 mm in thickness, with ulceration
Histogenetic Type
Multiple histologic subtypes of malignant melanocytic neoplasms have been described. According to the CAP, the World Health Organization classification of tumor variants include a non-exhaustive list of subtypes consisting of: superficial spreading melanoma, nodular melanoma, lentigo maligna melanoma, mucosal-lentiginous melanoma, desmoplastic melanoma, melanoma arising from blue nevus, melanoma arising from giant congenital nevus, melanoma in childhood, nevoid melanoma, persistent melanoma, and melanoma not otherwise classified (Fig. 2.1). Each of these variants has specific histopathologic characteristics. For instance, desmoplastic melanoma classically demonstrates a dense desmoplastic stroma with nodular lymphoid aggregates, atypical spindle cells, and perineural extension, while a nodular melanoma shows no radial growth phase, appears relatively symmetrical, may have areas of necrosis, and is often rich in plasma cells. These features however, are not specific, are overlapping, and do not carry reliable prognostic value.
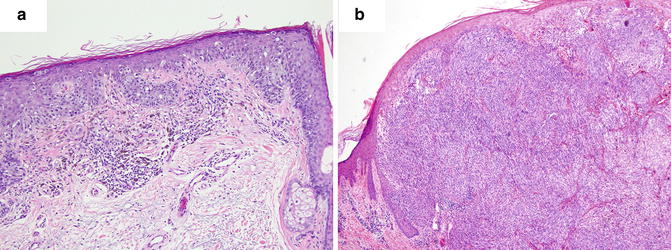
Fig. 2.1
Histogenetic types of melanoma. (a) Superficial spreading melanoma. (b) Nodular melanoma
The use of histogenetic type for prognosticating melanomas is not commonplace given the overlap of defining characteristics, minimal relevance in treatment planning, reliance on tumor site for certain types, among other issues [4]. However, subclassification provides clinicians with a clinicopathologic correlation that may aid in the early recognition of clinical lesions.
The genetic basis for melanoma is becoming increasingly well described, and some of these subtypes have been associated with specific genetic mutations [5]. For instance, acral-lentiginous melanoma and mucosal melanoma are often found to have mutations in KIT. Alternatively, the chronically sun-exposed region-associated lentigo maligna melanoma more commonly has NRAS mutations than KIT mutations. The most commonly observed mutation overall, in BRAF, is particularly associated with superficial spreading melanomas found in skin of intermittently sun-exposed areas. In addition, GNAQ/GNA11 mutations are found in approximately 50 % of uveal melanomas. It is prudent however, to note that histopathologic subtype only loosely predicts a gene mutation, and does not replace genetic testing. As new data on the genetic and molecular fingerprint of specific melanoma subtypes are elucidated, consideration of their inclusion in pathology reports should take place.
Breslow Thickness
Breslow thickness is currently the most important prognostic factor for localized primary melanoma [6]. Tumor invasion as assessed by this method correlates to the risk of regional and distant metastases, and to mortality [7, 8]. Tumor thickness is currently the major consideration when physician and patient discuss sentinel lymph node biopsy; therefore, the Breslow thickness has a significant impact not only on clinical management, but also on potential morbidity and healthcare costs [9]. Thus, standardization and accuracy regarding thickness are of critical importance in the pathologist’s report.
Tumor thickness is to be measured with an ocular micrometer at a right angle to the epidermal surface, from the top of the granular layer to the deepest point of tumor invasion. If the lesion is ulcerated, the upper point of reference is the base of the ulcer, and special consideration should be taken given that it will likely underestimate “true” depth (Figs. 2.2 and 2.3). The lower point of reference should be the leading edge of a single mass or an isolated cell or group of melanoma cells deep to the main mass [8]. Tangentially cut sections should be reported with a comment noting that an accurate Breslow thickness cannot be provided. If the epidermis cannot be visualized, no accurate tumor thickness can be provided, and other prognostic information such as mitotic rate and Clark level may be required to infer stage, prognosis, and clinical management.
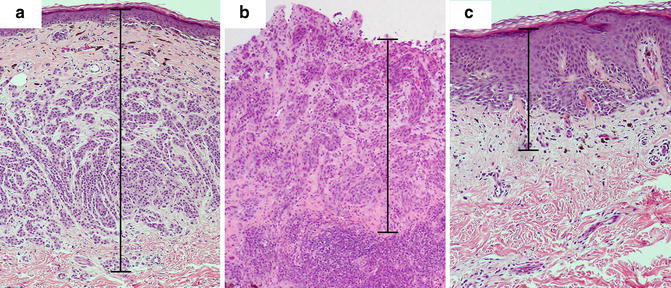
Fig. 2.2
Breslow thickness measurement in various histopathologic settings. (a) Melanoma displaying intact epidermis and no ulceration. The granular layer serves as the upper margin of the measurement. (b) Ulcerated melanoma with lack of granular layer. The base of the ulcer serves as the upper margin of the measurement. (c) Melanoma with hyperplastic epidermis. Note that a significant portion of the Breslow thickness corresponds to the epidermal component
Fig. 2.3
Flowchart for the measurement of the Breslow thickness
Adnexal involvement is often a feature of melanoma in situ. However, when peri-adnexal invasion is the only focus of invasion, Breslow thickness can be measured from the inner layer of the outer root sheath when perifollicular, or from the inner luminal surface of sweat glands, when periglandular, to the farthest peripheral infiltration into the dermis (Fig. 2.2). If the peri-adnexal invasion is not the only focus of invasion, it should not be utilized for Breslow thickness reporting (Fig. 2.3) [2].
In cases where the deepest portion of the biopsy specimen is transected, the report should so indicate, with a note that the Breslow thickness is “at least” a certain value. Other factors that may influence accurate reporting of tumor thickness include when melanomas arise in association with a nevus. Architectural and cytologic feature assessment is difficult and prone to observer bias.
Since the Breslow thickness is measured from the granular layer, samples with epidermal hyperplasia may seemingly overestimate the depth of invasion (Fig. 2.2). The Breslow thickness includes viable epidermis and dermis, and the contribution of each layer to the prognostic value of the thickness is not entirely clear. The viable epidermis of normal, non-acral skin may measure approximately 0.1 mm. In melanomas with reactive epidermal hyperplasia, this thickness may be increased significantly, thus increasing the measured total depth of melanoma invasion. Breslow considered the difficulty of assessing melanoma thickness in this scenario and noted that, especially in thin tumors, hyperplastic epidermis may represent a significant portion of the total measured thickness, and recommended that this fact be communicated in the report [10]. Similarly, verrucous malignant melanomas pose the same challenge.
The prognostic implication of hyperplasia is not clearly understood. Some studies have suggested that epidermal hyperplasia results in a change in the local cytokine milieu including a decrease in interferon-beta (IFN-β), which is an anti-angiogenic factor produced by keratinocytes [11]; it was postulated that this decrease in anti-angiogenic factors may promote tumor growth. One can speculate that there is cross-talk between normal cells of the epidermis and melanoma cells. There is likely a temporal response from keratinocytes to the alteration of the microenvironment during melanoma tumor formation; whether keratinocyte hyperproliferation is pro- or anti-tumorigenic in different growth stages remains uncertain.
Clark Level
Recent trends have led to the exclusion of the Clark level as a primary method of categorizing melanomas and guiding their treatment. Specifically, under current AJCC guidelines, the Clark level is no longer the primary histopathologic feature utilized to define T1b tumors, which are now determined by the presence of ulceration or dermal mitotic rate of 1 or more per mm2. Evidence-based studies have suggested that the Breslow thickness predicts prognosis more accurately than Clark level [6, 12, 13]. In addition, some of the current disfavor against the Clark level stems from interobserver variability, especially when distinguishing between level III and level IV (Table 2.2). Here, the papillary dermis must be differentiated from the reticular dermis, which may prove difficult in the setting of scar or regression with fibrosis, presence of a precursor nevus that obscures the interface, and lack of clear interface between the two dermal components in palmar, plantar, genital, mucosal, and subungual sites [14, 15].
Table 2.2
Clark levels
Clark level I | Intraepidermal tumor only |
Clark level II | Tumor present in but does not fill and expand papillary dermis |
Clark level III | Tumor fills and expands papillary dermis |
Clark level IV | Tumor invades reticular dermis |
Clark level V | Tumor invades subcutis |
Instances where the Clark level may be useful include when an accurate Breslow thickness cannot be determined, as well as in T1 melanomas where ulceration and mitotic rate cannot be determined. When ulceration is not present and mitotic rate is not obtainable, a Clark level IV or V invasion should be used as a tertiary criterion for upgrading a T1a lesion to T1b. This is of clinical significance given that the AJCC recommends sentinel lymph node exploration for melanomas stage T1b and above.
Mitotic Index
The mitotic index observed in melanoma sections has been extensively studied as a prognostic factor and, more recently, adopted as one of the major histopathologic features influencing surgical management. In the seventh edition staging system for melanomas from the AJCC, mitotic rate replaced the Clark level of invasion for T1 melanomas. A mitotic rate of 1 or more per mm2 indicates an upstage for pT1 lesions from pT1a to pT1b. This recommendation stems from data in multiple studies that indicate that the presence of mitotic figures seems to have a direct correlation to the rate of positive sentinel lymph node biopsies [16–18]. It is currently advocated by some that patients with thin melanomas of <1 mm depth with a mitotic rate of >1 per mm2 should be offered a lymph node biopsy [19]. Interestingly, it has been shown that there were no significant patient survival differences between melanomas with increasing number of mitotic figures beyond 1 per mm2 [6].
In years past the mitotic index was reported as the number of mitotic figures per high-power field. This reporting was later standardized to the current accepted format of mitotic number per square millimeter (mm2). Given the variability between objectives in different microscopes, the field diameter of each microscope must be calibrated with a stage micrometer in order to accurately and reproducibly determine the number of high-power fields that equates to 1 mm2.
Mitotic figures are best enumerated by first determining the “hot spot” of the lesion; i.e., the focus in vertical growth phase containing the greatest number of mitotic figures. The number of mitoses in the hot-spot field is counted, and the observer then repeats the count on immediately adjacent, non-overlapping areas until an area of 1 mm2 is covered (approximately 5–6 high-power fields using ×400 magnification, depending on the microscope employed). In cases where the invasive component is <1 mm2, an average for a 1 mm2 area is then inferred based on the available area of invasion. In cases where there is no prominent invasive focus that can serve as the “hot spot,” the average of mitotic cells from several independent random areas that add up to 1 mm2 of the tissue section is used. The final report should indicate a whole number of mitoses per mm2; if no mitotic figures are found, 0 per mm2 may be reported. If a single dermal mitotic figure is observed, 1 per mm2 is reported. Similar standardized methodologies have been shown to result in an interobserver correlation coefficient of 0.76 among trained pathologists [20].
The counting of mitotic figures and finding the mitotic hot spot may be challenging in hematoxylin and eosin (H&E)-stained slides as the pathologist relies on the observation of condensed chromosomes to identify a mitotic figure. Common problems with this technique include staining artifacts, suboptimal histology preparation, and occasionally, apoptotic figures can be confused with mitosis. Some studies comparing the use of H&E slides and immunohistochemical labels used as markers of proliferation for determining the mitotic index did not offer significant advantage over conventional H&E [18]. However, other immunohistochemical labels have been suggested to improve the detection of mitotic figures, such as the use of phosphohistone H3 (pHH3) labeling [21–23]. pHH3 plays an important role in cell cycling and highlights cells more selectively in the M phase. Visualization of mitotic figures can be highly improved using this technique and aid in finding the hot spot in difficult cases where condensed chromatin within nuclei of melanocytes is not readily observed. The search for the mitotic hot spot is often performed by scanning the entire slide at relatively low magnification. At low magnification, mitotic figures may not be readily observed, but on pHH3 stained slides, the mitotic figures stand out even at low magnifications improving the yield of finding the true hot spot (Fig. 2.4).
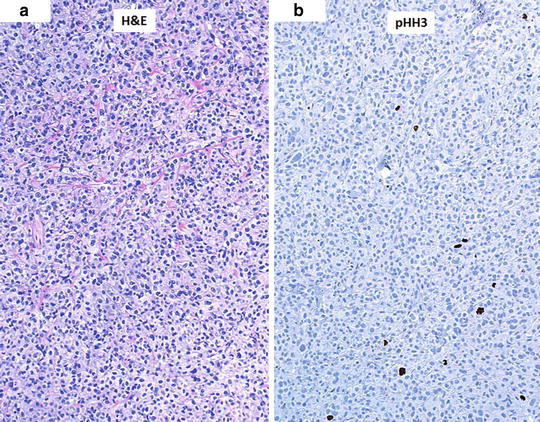
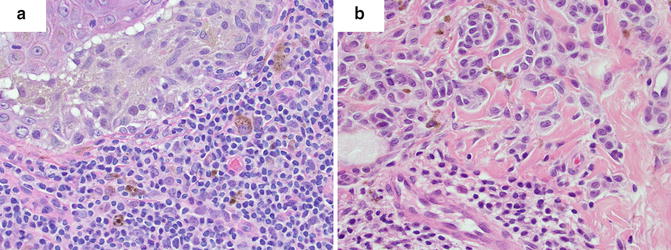
Fig. 2.4
Aid in finding the mitotic hot spot using immunostaining. (a) Hematoxylin and eosin (H&E)-stained slide at low magnification (×10) with difficult-to-see mitotic figures. (b) Phosphohistone H3 (pHH3)-immunostained slide (dark brown) with readily observed cells in the M phase
It is important to highlight that the prognostic significance of the mitotic index stems from studies of mitotic counts using H&E-stained slides. Hence, at this time, H&E slides should be used to determine the index in order to maintain standardization. However, immunostains may be helpful in identifying the mitotic hot spot and improve interobserver correlation in challenging cases.
Tumor growth and expansion are obviously dependent on mitosis of cells forming the tumor. Hence, one can expect that if a thorough search for mitotic figures is performed in multiple sections with the aid of immunohistochemical staining, mitotic figures will likely be found. Accordingly, as the protocol for mitotic rate determination is modified to optimize capture of mitotic figures (i.e., addition of immunostaining, deviating from the studies that led to the inclusion of mitotic index in melanoma staging), the translation of mitotic index to melanoma staging should be adjusted.
Ulceration
Together with tumor thickness, the presence of ulceration is one of the two most powerful independent variables of primary melanoma lesions when compared to other histopathologic prognostic variables [13]. There are likely multiple reasons why ulceration is a poor prognostic factor. Ulceration may impact measurement of the Breslow thickness as discussed previously and underestimate this important prognostic value. Moreover, ulceration often results from increased growth and expansion of the tumor, likely representing more malignant intrinsic properties. For patients with ulcerated melanoma, there was a twofold increased hazard ratio when compared to those with non-ulcerated tumors. In patients with thin melanomas that demonstrated ulceration, survival rates decreased to levels near those of thicker melanomas. In patients with melanomas of <1 mm depth with ulceration, survival (near 85 % at 10-years) was similar to those with depth of 1.1–2.0 mm without ulceration. Similarly, tumors with depth of 2.1–4.0 mm with ulceration, had similar survival rates (near 55 % at 10-years) to thicker tumors of >4 mm depth without ulceration [13]. Based on these data, similar to the mitotic index, presence of ulceration affects tumor staging.
Ulceration, when visualized on histopathologic sections of melanomas, upgrades a pT1 lesion from pT1a to pT1b, regardless of the mitotic index. Similarly, for T2, T3, and T4 tumors, the presence of ulceration determines whether the lesion is a T2a or T2b, and so forth. In fact, for thicker melanomas, the presence of ulceration has been shown to have more prognostic import than tumor depth [13]. Moreover, the thicker the tumor, the more likely it is to show presence of ulceration. For instance, tumors of less than 1 mm depth showed 6 % ulceration rate whereas tumors with depth of 1.1–2.0 mm, 2.1–4.0, or >4 mm showed 23 %, 47 %, or 63 % ulceration rates, respectively [13]. On the other hand, studies in patients with thin melanomas of <1 mm in depth demonstrate that thickness is more predictive for survival than ulceration.
Assessing ulceration may prove to be a difficult task and the pathologist, aware of the importance of this prognostic histologic factor, may spend considerable time determining its presence or absence in certain sections. For instance, cases with only a focal loss of epidermis pose a dilemma where the defect could be considered artifactual versus a true ulceration. Certain features may clue in the astute pathologist as to the true state of the lesion. For example, the presence of fibrin or granulation tissue may indicate a true ulcer. Moreover, distinguishing traumatic (exogenous) from non-traumatic (endogenous) ulceration is indeed also important, as the former would have less prognostic significance [24]. Clinical history is of key importance but the pathologist often relies on the description provided by the clinical dermatologist who performed the biopsy. Lesion site is also another consideration when determining whether the ulceration is traumatic, as areas prone to trauma have higher risk of traumatic ulceration, albeit limited by speculation. Characteristics of the ulceration should be considered, such as sharp border demarcation and wedge-shaped granulation tissue pointing towards a traumatic ulceration. In addition, the presence of scar in the dermis may help make this distinction, as scars would be more characteristic of trauma [20]. True intrinsic ulcerations have been described in two principal settings. First is an ulcer formed from invasion of melanoma cells through the epidermis disturbing the desmosomal junctions of keratinocytes. Second is the ulcer formed by larger nodular melanomas, where nodular expansion may force the epidermis into an effaced state resulting in thinning and ulceration [20].
Currently, pathology reports include merely the presence or absence of ulceration. However, the extent of ulceration may also have prognostic relevance. Multiple studies have evaluated quantitative outcome measures of ulceration and suggested their inclusion in the pathology report [25, 26]. Extent of ulceration may be measured as total absolute diameter or as a percentage of tumor width. Melanomas with ulceration of either less than 70 % of total width or less than 5 mm diameter showed a 5-year melanoma-specific survival (MSS) of 80.4 % and 82.7 %, respectively. Remarkably, the 5-year MSS of melanomas with ulceration of >70 % of total width or >5 mm were 66.4 % and 59.3 %, respectively. These data along with further studies may influence pathologists to consider the addition of qualifiers and quantifiers of ulceration given possible prognostic impact.
Tumor-Infiltrating Lymphocytes and Tumor Regression
Melanoma regression is a histopathologic characteristic that spans a spectrum of microscopic findings. Early regression represents the presence of tumor-infiltrating lymphocytes. Intermediate and late regression is the replacement of melanoma tumor tissue by fibrosis in the dermis, either immature when intermediate or mature when late. Along with haphazard dermal fibroplasia, the pathologist can often observe melanophages, variable edema, telangiectasia, and epidermal effacement in intermediate and late regression. Blood vessels may also assume a perpendicular orientation [27].
Importantly, the prognostic value of early versus intermediate/late regression varies. For early regression, which is characterized by tumor-infiltrating lymphocytes that disrupt tumor nests or oppose melanoma cells, the prognosis may be more favorable [28–30]. However, it is important to note that the level of lymphocyte infiltration must be graded and, if accurately described, may predict survival rates. A “brisk” lymphocytic infiltrate is characterized by diffuse infiltration of the entire base of the vertical growth phase or throughout the entire invasive component of the melanoma (Fig. 2.5). On the contrary, a non-brisk infiltrate is found only focally. When the infiltrate of melanoma with vertical growth phase is brisk, the 5-year survival rate was 77 % and the 10-year rate 55 %. When compared to a non-brisk infiltrate, these rates declined to 53 % and 45 %, respectively. If no tumor-infiltrating lymphocytes were sighted, these rates declined further to 37 % and 27 %, respectively [29]. Hence, a brisk infiltrate may be considered as a positive prognostic factor. Of note, one should bear in mind that the type of lymphocytes present likely alters tumor destiny; hypothetically, cytotoxic cells may promote regression whereas regulatory T-cells may favor immunotolerance.