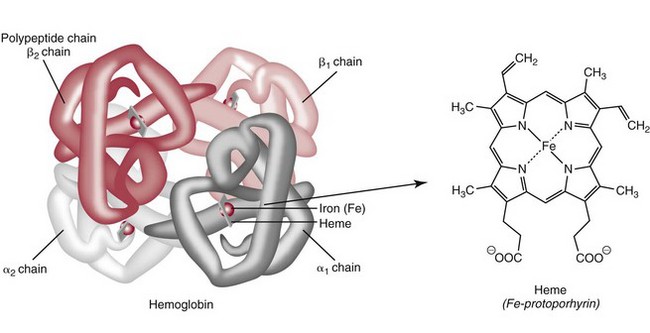
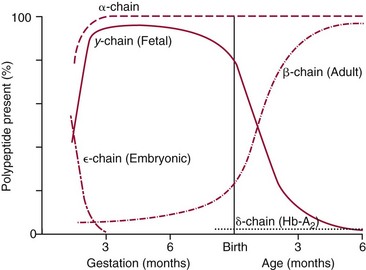
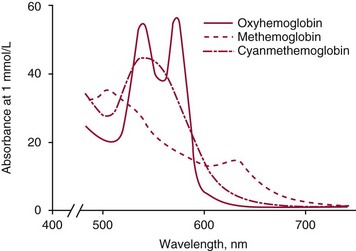
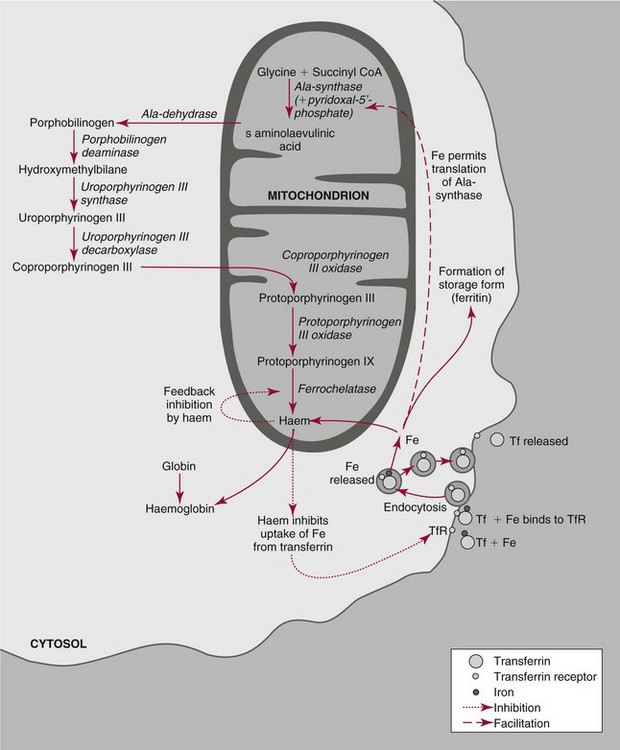
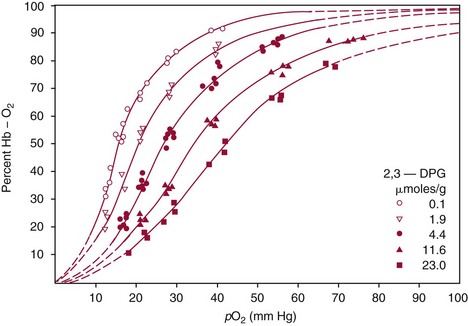
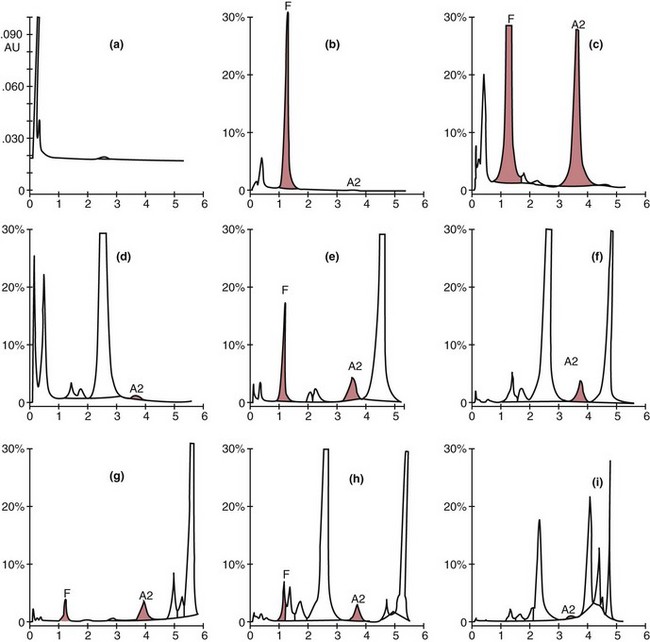
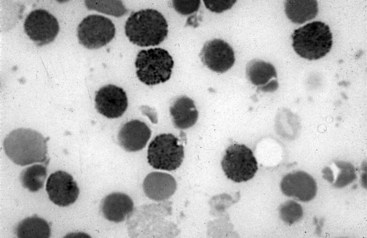
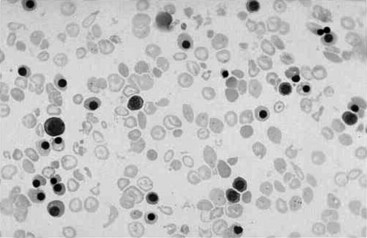
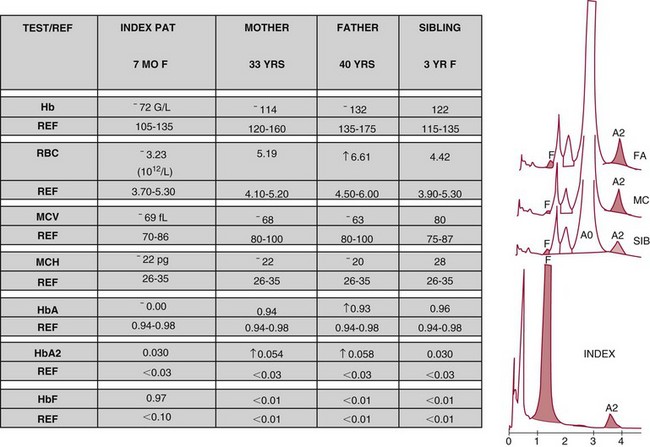
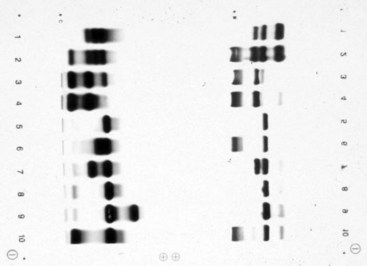
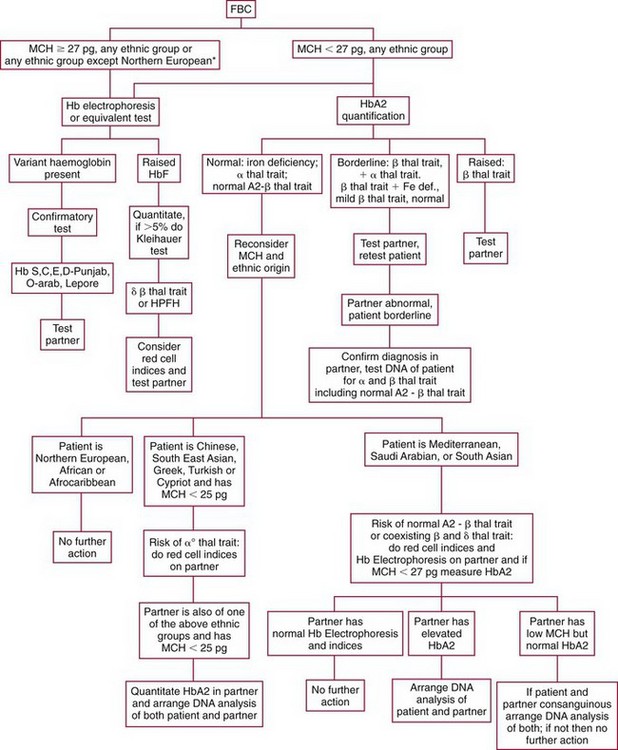
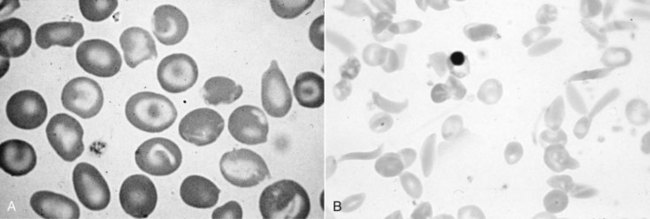
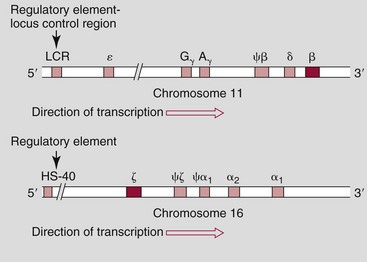
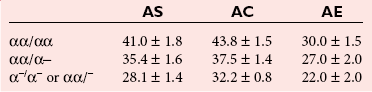
Chapter 32 Trefor Higgins, M.Sc., John H. Eckfeldt, M.D., Ph.D., James C. Barton, M.D. and Basil T. Doumas, Ph.D.* Hb is a hemoprotein whose primary function is to transport oxygen from the lungs to the body tissue. It was first isolated in 1849 and was the first oligomeric protein to be characterized by ultracentrifugation and to have (1) its molecular mass accurately determined; (2) its physiologic function described; and (3) following the 25-year study of Max Perutz and colleagues in Cambridge, its structure defined by x-ray crystallography.H61 In 1949, Linus Pauling and H. ItanoH60 showed that Hb from patients with sickle cell disease differed from normal Hb by having two to four additional net positive charges. Later, the reasons for the charge difference were elucidated by locating the single amino acid difference between Hb from normal individuals and Hb from those with sickle cell disease.H40–H43 Hemoglobin is a globular protein with a diameter of 6.4 nm and a molecular mass of approximately 64,500 Da. As shown in Figure 32-1, Hb consists of four globin subunits (two alpha and two non-alpha β-, γ-, or δ-chains) with each looped about itself to form a pocket or cleft in which the heme group nestles. Normally, this heme pocket is formed entirely by nonpolar (hydrophobic) amino acids. The heme moiety (see Figure 32-1) is suspended within this pocket by an attachment of its iron atom to the imidazole group of the proximal histidine [position 92 of the β-chain (β92) or position 87 of the α-chain (α87)]. The imidazole group of the distal histidine (β63 or α58) is also in contiguity with the iron of heme, but it appears to swing into and out of this position to permit the passage of O2 into and out of the Hb molecule. The four iron atoms are in the divalent state, whether Hb is oxygenated or deoxygenated. Production of α- and γ-chains starts at about 6 weeks’ gestation, with Hb F (fetal hemoglobin, α2γ2) increasing in concentration to become the major Hb found in the fetus (Figure 32-2). Glycine or alanine may be found at position 136 of the γ-chain in the fetus, giving rise to two distinct γ-chains designated Gγ and Aγ, respectively. Formation of Hb A (α2β2) commences at about 28 weeks’ gestation, and at birth it can form up to 15% of the total Hb, with the remainder of the Hb consisting mainly of Hb F with a very small amount of Hb A2. Production of the γ-chain declines after birth, and normal adult Hb F concentrations are usually obtained by 1 year of age but may be elevated until 2 years of age. Primary Structure: The α- and non–α-globin chains of Hb are 141 and 146 amino acid residues in length, respectively. Some sequence homology has been noted, with 64 individual amino acid residues in identical positions in both α- and β-chains. The β-chain differs from the δ- and γ-chains by 39 and 10 residues, respectively. The amino terminal of the β-globin chain is the site of attachment of glucose (Hb A1c), urea, and salicylate.H13 The carboxy terminal amino acid of the β-chain is tyrosine and can function as a part of salt bridges. Although no disulfide bonds are present, six SH groups are noted (from cysteine at positions α104, β93, and β112). The γ-chain has a glycine amino terminal, and the alkali resistance of Hb F is attributed to the presence of threonine and tryptophan at positions 112 and 130 of the γ-chain, respectively. The γ-chain is unique in that it is the only globin chain to be susceptible to acetylation, and acetylated Hb F is a prominent feature in cord and neonatal blood and may form as much as 25% of the total Hb. Secondary Structure: Approximately 75 to 80% of polypeptide chains of the α- and non–α-chains are arranged in helices, with the remainder forming nonhelical turns. The β-chain of Hb A is arranged into eight helices identified as A through H. In contrast, the α-chain is missing an equivalent of the D helix and so has only seven helices. Nomenclature within the helices identifies the helix and the position within the helix of the amino acid residue (e.g., F3 is the third amino residue in the F helix). Amino acid residues in the peptide chains that join adjacent helices are described by the identification of two adjacent helices and the position of residues within the joining peptide. For example, EF3 would be the third residue in the peptide joining the E and F helices. Tertiary Structure: The tertiary structure of Hb refers to the arrangement of helices into a three-dimensional, pretzel-like structure. The heme group, located in a crevice between the E and F helices, is attached to histidine residues in each globin chain. This attachment is essential to maintaining the secondary and tertiary structure of the globin chains. Quaternary Structure: The quaternary structure of Hb results from the attachment of the four globin chains to each other. Strong α1β1 and α2β2 dimeric bonds hold the molecule in a stable form. The tetrameric α1β2 and α2β1 bonds make significant contributions to the stability of the structure. Shifting, rotation, and sliding in the quaternary structure result in a number of physiologic effects, including the sigmoid-oxygen dissociation curve and the Bohr effect (described in greater detail later in this chapter). Each of the modified Hbs has a characteristic spectral pattern, as shown in Figure 32-3. These spectral characteristics form the basis of analysis in the many co-oximeters and blood gas analyzers that provide, in a single analysis, the simultaneous quantitative measurement of carboxyhemoglobin, methemoglobin, and sulfhemoglobin. The spectral scans are performed using multidiode arrays covering a number of wavelengths followed by patented calculations that discriminate between normal and modified Hbs. Carboxyhemoglobin is formed by the preferential attachment of carbon monoxide instead of oxygen to Hb. Carboxyhemoglobin concentrations (usually expressed as a carboxyhemoglobin saturation) have been known to reach 20% in individuals who are exposed to significant workplace concentrations of carbon monoxide. For example, police directing traffic at busy intersections and workers in radiator and welding shops have high carboxyhemoglobin concentrations at the end of the working day. The ability to perform heavy manual work or complex tasks is impaired at carboxyhemoglobin concentrations of 10% or less.H14 Faulty home furnaces and automobile exhaust systems have been known to produce large amounts of carbon monoxide, sometimes with tragic results. Carboxyhemoglobin saturation varying from 15 to 25% may be associated with dizziness, headaches, and nausea, and greater than 50% saturation is considered life threatening.H71 Following removal of the exposed individual from the carbon monoxide source, a slow decline in carboxyhemoglobin saturation occurs in keeping with the half-life of 4 to 5 hours at sea level.H72 The iron of heme is normally in the reduced ferrous state (Fe2+). Under alkaline conditions, the iron is oxidized to the ferric state (Fe3+) by toxic agents, such as nitrates (found in some well waters), aniline dyes, chlorates, drugs—such as quinones, phenacetin, and sulfonamides—or local anesthetics, such as procaine, benzocaine, and lidocaine. This oxidation converts the heme to hematinH79 and the Hb to methemoglobin. Patients with methemoglobin are cyanotic because methemoglobin is unable to reversibly bind oxygen. Methemoglobin is normally reduced to Hb in the cell by the reduced form of the nicotinamide-adenine dinucleotide (NADH)-cytochrome reductase system. Sulfhemoglobin is produced by the reaction of sulfur-containing compounds with heme to form an irreversible chemical alteration and oxidation of Hb by the introduction of sulfur in one or more of the porphyrin rings. The most common cause of sulfhemoglobinemia is exposure to drugsH10 such as phenacetin and sulfonamides. Sulfhemoglobin cannot transport oxygen, and cyanosis is noted at low concentrations. The biosynthesis of Hb requires the biosynthesis of both heme and the globin polypeptide chains. Heme, ferrous protoporphyrin IX, consists of four pyrrole rings surrounding an iron atom with four of the six electron pairs of iron attached to the nitrogen atoms in the pyrrole rings (see Chapter 33). One of the remaining electron pairs attaches to a histidine residue in a globin chain, and the other pair is available for binding and transporting an oxygen molecule. The latter electron pair is protected from oxidation by the surrounding nonpolar amino acid residues of the globin chain. Hemin results from the relatively easy oxidation of the iron of heme from the ferrous to the ferric state.H79 To remain electrically neutral, a halide molecule, usually chloride, becomes attached to hemin. In alkaline solution, hematin is formed by the replacement of the halide atom of hemin by a hydroxyl group. The biosynthesis of heme, shown schematically in Figure 32-4, takes place primarily in the bone marrow and the liver and is an eight-step process with each step involving a different genetically controlled enzyme. Details of this process are given in Chapter 33. The genes that control the α-like and ζ-globin chains are located in a cluster on chromosome 16 at position 16p13.3, which is near to the chromosome 16 telomere (Figure 32-5). The α-like gene extends over 28 kb and contains, reading from the upstream (5′) end to the downstream (3′) end of the DNA segment, an embryonic α-like ζ-globin gene, a hypervariable region (HVR), a pseudo(ψ)–ζ-gene, a pair of pseudo (ψ)–α-genes, a pair of functional α-globin genes, an unexpressed α-like θ gene, and finally another hypervariable region. Alpha-thalassemia arises from the deletion of one or more α-globin genes. Deletion of all four genes with subsequent production of Hb Bart’s is incompatible with life. Figure 32-5 Globin α- and β-gene clusters. (From Bain BJ. Haemoglobinopathy diagnosis. London: Blackwell, 2001.) The iron of heme is in the ferrous state and is able to combine reversibly with oxygen to act as the major oxygen-carrying moiety. The term cooperativity is used to describe the interaction of globin chains in such a way that oxygenation of one heme group enhances the probability of oxygenation of the other heme group. The Bohr effect refers to reduction of oxygen affinity with a decrease in pH from the physiologic range (7.35 to 7.45) to 6.0 and is another result of this cooperativity. As the pH of the tissue decreases as a result of the presence of the end products of anaerobic metabolism, CO2 and carbonic acid, the delivery of oxygen to the exercising tissue is enhanced. The O2 dissociation curve of normal blood hemoglobin is sigmoidal (Figure 32-6). Physiologically, the carbon dioxide reversibly combines with the amino terminal groups of Hb to form carbamated Hb, facilitating the removal of about 10% of the CO2 formed as a result of metabolism in the tissue to the lungs. Removal and transport of CO2 from the tissue are enhanced by the preference for the attachment of more CO2 by carbamated Hb. The thalassemias and hemoglobinopathies are clinical disorders related to Hb pathophysiology. Although they may have similar clinical manifestationsH19 such as anemia of varying severity,H17 they form two distinct disease groups of genetic origin. For example, the thalassemias originate from insufficient globin chain production instigated by a variety of causes, including gene deletion and nonsense mutations, or from mutations that affect the transcription or stability of mRNA products. The name thalassemia is derived from the Greek word for “sea,” thalassa, because all early cases of β-thalassemia were described in children of Mediterranean origin. Individual types of α-thalassemias are discussed in the following sections. Hb Bart’s: Hb Bart’s results from deletion of all four α-globin genes with subsequent inability to produce any α-globin chains, leading to failure of synthesis of Hb A, F, or A2. In the fetus, an excess number of γ-globin chains join together to form unstable tetramers known as Hb Bart’s (γ4). Mothers who carry a fetus with Hb Bart’s usually present clinically between 20 and 26 weeks’ gestation with pregnancy-induced hypertension and polyhydramnios. Ultrasound of the fetus shows hydrops. Severe anemia (Hb usually <80 g/L) is noted on a fetal blood sample obtained by cordocentesis. It is important to rule out other causes for the hydropic fetus by performing serologic testing for toxoplasmosis, rubella, cytomegalovirus, and herpes simplex testing. High-performance liquid chromatography (HPLC) analysis of a cordocentesis blood sample shows one or two very sharp and narrow peaks at the injection point on the chromatogram (Figure 32-7, a). The major band is Hb Bart’s with a smaller band attributed to Hb Portland. Complete absence of Hb F is noted. Alkaline electrophoresis shows a band migrating at or close to the solvent front (Hb Bart’s) with another band in the Hb A position (Hb Portland). Hb Bart’s hydrops fetalis is almost invariably fatalH18 with some fetuses dying in utero and others surviving a few hours after birth. Treatment using intrauterine transfusion has had very limited success, with potential complications in the children of growth retardation and severe brain damage, which may be related to long-standing intrauterine anemia. Hb H Disease: This disorder is usually caused by a three α-globin gene deletion (-/-α) and is characterized by a chronic anemia of variable severity. Individuals with nondeletional Hb H disease (αTα/-) are usually more severely affected and are more likely to require transfusion therapy than those with deletional Hb H disease. Significant underproduction of α-globin chains occurs with subsequent joining of free β-globin chains to form the insoluble β-globin chain tetramer Hb H. HPLC analysis of a hemolysate from an individual with Hb H disease shows two bands with low retention times forming a doublet together with a normal Hb A band. Hb F and Hb A2 concentrations are within the reference interval (see Figure 32-7, d). Electrophoresis at alkaline pH shows a fast moving band together with a band in the Hb A position that possibly has reduced staining when compared with other samples run concurrently. The complete blood count (CBC) (Table 32-1) shows a moderately reduced concentration of Hb and markedly reduced mean corpuscular volume (MCV) and mean corpuscular hemoglobin (MCH), increased red cell distribution width (RDW), and slightly raised red blood cell (RBC) count. Iron studies are normal, although the ferritin concentration may be elevated. The Hb H preparation is positive, with many cells having typical punctate inclusions (Figure 32-8). TABLE 32-1 Definition of the Parameters That Constitute a Complete Blood Count (CBC) α-Thalassemia Minor: α-Thalassemia minor is the result of a two α-chain gene deletions. These deletions may be seen on the same gene (-/αα,α0-thalassemia) described as a cis deletion or on different genes (-α/-α, α+-thalassemia) described as a trans deletion. The CBC of affected individuals shows a mildly reduced Hb with low MCV and MCH. HPLC analysis shows no abnormal Hb peaks, and Hb F and Hb A2 concentrations are within the reference interval. The Hb H preparation may show a rare cell with punctate inclusions. Iron studies are normal. In the routine clinical laboratory, the diagnosis of α-thalassemia major is based on exclusion criteria rather than definitive tests. The presence of thalassemic indices in a patient with normal Hb A2 and Hb F quantifications is very often the only basis for many diagnoses of α-thalassemia major, particularly in the setting of a positive family history. A photometric enzyme-linked immunosorbent assay (ELISA) for the identification of adult carriers of the (–SEA) α0-thalassemia deletion has been described.H51 This method is based on the measurement of minuscule quantities of embryonic ζ-cells present in these adult carriers. Not all α-thalassemia deletions have continued ζ-chain production, and so a negative test is not diagnostic of α-thalassemia major. This test could be useful in screening individuals at risk for giving birth to a fetus with Hb Bart’s hydrops fetalis. α-Thalassemia Silent: α-Thalassemia trait describes a single α-globin chain gene deletion (-α/αα). A single α-globin gene deletion is frequently clinically and hematologically silent. A CBC of an individual with this trait shows a normal or marginally decreased Hb concentration, MCV, and MCH. Iron studies are normal, and no abnormal Hb peaks are seen on HPLC analysis. In Table 32-2, the effects of various α-thalassemias on the percentage of β-chain hemoglobin variants are shown.H52 In general, the percentage of hemoglobin variant decreases as a percentage of total hemoglobin as the number of α-chain deletions increases. TABLE 32-2 Effects of a Thalassemia on the Percentage of β-Chain Variant Hemoglobin in Heterozygotes Adapted from Bunn HF, Forget BG, eds. Hemoglobin: molecular genetics and clinical aspects. Philadelphia: Saunders, 1986. The β-thalassemias result from a reduction in the synthesis of the β-globin chainH58 and are commonly found in (1) the Mediterranean region; (2) Africa; (3) the Middle East; (4) South East Asia—especially the Southern provinces of China including Hong Kong, the Indian subcontinent, the Malay peninsula, Burma, and Indonesia.H78 Frequency of gene distribution is estimated at 3 to 10% in some populations. The high frequency of β-thalassemia in the tropics is thought to reflect an advantage of heterozygotes against Plasmodium falciparum malaria. More than 200 β-thalassemia mutations have been described; however, in each ethnic group a relatively small number of mutations account for the majority of cases (the ratio most often quoted is that 20 or fewer mutations account for 80% or more of cases). Clinical manifestations of β-thalassemia range from mild anemia to severe life-threatening disease requiring lifelong transfusions. β0-Thalassemia (β-Thalassemia Major): This is sometimes called Cooley’s anemia, after the physician who in 1925 first described the condition in the children of Italian and Greek immigrants in New York by noting that these children (1) failed to grow, (2) had frequent infections, (3) appeared pale and malnourished, (4) had splenomegaly, and (5) had facial bone changes. Clinical presentation usually occurs at younger than 1 year of age with features such as small size for age, abdominal girth expansion, and failure to thrive. Physical examination of the subject may reveal frontal bossingH63 (an unusually prominent forehead) caused by thickening of the cranial bones, pallor, and prominence of the cheek bones, which, in older children, obscures the base of the nose and exposes the teeth. These features are a result of marrow expansion (up to a 30-fold increase) caused by ineffective erythropoiesis with production of highly unstable α-globin tetramers leading to increased plasma volume and the formation of extramedullary erythropoietic tissue, especially in the thorax and the paraspinal region. The spleen, liver, and heart may be enlarged also because of extramedullary hematopoiesis. Typical CBC results include severe anemia with Hb concentration between 30 and 65 g/L, MCV 48 to 72 fL, and MCH 230 to 320 g/L. On the peripheral blood smear, a characteristic markedly abnormal RBC morphology is noted; this includes a large number of microcytes, numerous target cells, which may have a bridge joining the central and peripheral pigment zones, polychromasia, and occasional spherocytes, schistocytes, and nucleated red cells. When a patient’s red blood cells are of unequal size (anisocytosis), the diameter of the RBC varies from 3 to 15 µm with little pigment, and shape distortion is noted, along with prominent basophilic stippling. RBC osmotic fragility is frequently observed. Typical peripheral blood on a patient with β0 thalassemia is shown in Figure 32-9. White blood cell (WBC) and platelet counts are usually normal. Ferritin is usually within the upper half of the reference interval, and total bilirubin is mildly elevated with a borderline elevation in the conjugated fraction. Urinalysis frequently shows increased urobilinogen or urobilin concentration, and urine is often dark brown to black because of the presence of dipyroles and mesobilifuscin. The latter features reflect ineffective hematopoiesis with intramedullary red cell destruction. HPLC analysis (see Figure 32-7, b) shows a major Hb F peak with absence of an Hb A peak and variable Hb A2 (interval, 1 to 5.9%; mean, 1.7%) peak. Electrophoresis at alkaline and acid pH shows a dominant band in the F position on both gels.H2 Family studies on both parents and siblings should be performed, and the classical β-thalassemia minor pattern described later in the chapter should be found in the parents. Siblings may be normal or may have β-thalassemia minor. A family case history is seen in Figure 32-10. β+-Thalassemia (β-Thalassemia Intermedia): With this disorder, a significant reduction in the production of β-globin chain occurs with subsequent reduction in the quantity of Hb A present; this is attributed to a wide variety of genotypes. Many different causes of β+-thalassemia have been identified, with variations in one or two β-globin genes. Clinical severity in individuals with variations in two β-globin chains is much less than when variation is seen in only one gene, a condition sometimes called dominant β-thalassemia. The severity of clinical features is reduced with coinheritance of α-thalassemia. β+-Thalassemia is found in Mediterranean countries, especially in the Eastern Mediterranean. β-Thalassemia Minor (β-Thalassemia Trait): Patients with β-thalassemia minor are very often asymptomatic, except at times of hematopoietic stress, such as infection or pregnancy, when they may require, in extreme situations, blood transfusions because of the development of anemia. The CBC on patients with β-thalassemia trait shows low normal or decreased Hb concentration and hematocrit, decreased MCV (<72 fL) and MCH (<27 pg), and normal RDW. The discriminant factor is <60 pg (see following “Analytical Methods” section for definition). However, for patients with liver disease and β-thalassemia, MCV and MCH may be at the low end of the reference interval. The diagnosis of β-thalassemia minor, with appropriate indices in the CBC, is dependent on the finding of a raised Hb A2 (>3.5%). Hb A2 and Hb A2′ should be added together to obtain an accurate Hb A2 value for the investigation of β-thalassemia minor. Hb A2 may be elevated in HIV-positive women without hypochromic microcytic indices,H39 hyperthyroidism, and megoblastic anemia, and with some unstable hemoglobins.H70 Iron-depleted individuals should become iron replete before a definitive diagnosis of β-thalassemia is made, because Hb A2 may be falsely low. HPLC is the preferred method for this quantification; densitometric scanning of the Hb A2 band on an alkaline electrophoresis gel is not recommended because of poor precision and accuracy.H70 In 30 to 40% of all cases of β-thalassemia minor, Hb F will also be elevated (>1.0%). The life span of the RBC may be reduced, and diabetic individuals may show a lower Hb A1c compared with normal individuals with equivalent glycemic control. The β-thalassemia mutation may be identified by Southern blot using mutation-specific probes or by gap–polymerase chain reaction (PCR). δβ-Thalassemia: Deletion of both δ- and β-genes results in δβ-thalassemia. Both heterozygous and homozygous conditions have been described. It is found in a variety of ethnic groups but is most prevalent in countries of the Eastern Mediterranean, especially Greece and Italy, and is the result of one of eight mutations that have been described to date. CBC analysis shows a reduced concentration of Hb (80 to 135 g/L) with reduced MCV and MCH and sometimes an increased RDW. HPLC analysis shows an Hb A peak with a normal or reduced Hb A2 concentration and a raised Hb F concentration (between 5 and 20%), with the highest HbF concentration seen in the Sardinian type of δβ-thalassemia. Hb Lepore sometimes is incorrectly classified as a δβ-thalassemia because of a reduction in the production of both δ- and β-globin chains, or as an Hb variant because of the presence of an abnormal globin chain. Hereditary Persistence of Fetal Hemoglobin (HPFH): The term hereditary persistence of Hb F is used to describe a group of genetic conditions in which the concentration of Hb F is increased above the upper limit of the reference interval because of a reduction in β-globin synthesis and a compensatory increase in δ-globin synthesis. Two major classes of HPFH have been described: heterocellular and deletional. Several deletional variants of HPFH have been described, including Greek, Indian, Italian, Corfu, and black. If only single point mutations are considered, 1695 possible hemoglobin variants are known; 733 were identified by mid-2007.H48 Currently, more than 900 hemoglobinopathies have been described, but only 9 have some clinical significance. Recent migration from regions with a high frequency of hemoglobinopathies (South East Asia or Africa) to regions (Western Europe, Central and South America, and Canada) that had low frequencies has increased the incidence of hemoglobinopathy in these areas to such an extent that some western European countries have introduced neonatal testing for hemoglobin variants. The incidental finding of a hemoglobinopathy during HPLC analysis for Hb A1c has increased both the number and the incidence of Hb variants.H16,H75 Several Hb variants (e.g., Hb Rambam, Niigata, Camden) interfere with HPLC methods for quantifying Hb A1c (for a more extensive list, see ElderH23), and one Hb variant was found as the result of interference in pulse oximetry measurements.H81 Hb variants are classified according to the type of mutation.H52 Single point mutations in α-globin chains give rise to substitution of one amino acid residue. As an example, Hb San Diego [β109(G11)Val→Met] has a methionine residue instead of the normal valine at position 109 of the β-chain. Hemoglobin C Harlem [β6(A3)Glu→Val; β73(E17)Asp→Asn] is an example of an Hb variant in which two amino acid residues are substituted, namely, valine replacing glutamic acid at position 6 and asparagine replacing aspartic acid at position 73 of the β-chain. Hemoglobin C Harlem is electrophoretically similar to Hb C but behaves like Hb S in every other aspect, including clinical manifestation. Deletion Hb variants arise from the deletion of one to five amino acid residues in the globin chain. Hb Vicksburg [β75(E19)Leu→0] is an example in this category of Hb having a deletion of leucine in position 75 of the β-chain. Insertion Hbs arise from insertion of one to three amino acid residues into the globin chain. Hemoglobin Grady is an example in this category with an insertion of a three amino acid residue sequence (glutamine-phenylalanine-threonine) between positions 118 and 119 of the α-chain. Deletion-insertion Hbs arise from the deletion of a portion of the normal amino acid residue sequence and the insertion of another sequence, with resultant lengthening or shortening of the globin chain. An example of this type of Hb variant is Hb Montreal, in which the three normal amino acid residues between positions 72 and 76 of the β-globin chain are replaced with a four amino acid residue sequence. Elongation Hbs result from a single base pair mutation or frameshift at the 3′ end of exon 3 or the 5′ end of exon 1 of the α2– or the β-globin chain. The elongation hemoglobin, Hb Constant Spring (named after an ethnic Chinese family from the Constant Spring district of Jamaica), has an additional 31 amino acid residues joined at position 142 (the carboxy terminal) of the α-chain. Fusion Hbs result from the fusion of an α- or β-globin chain with a portion of another globin chain. Hemoglobin Lepore-Hollandia results from the fusion of the first 22 amino acid residues of the δ-chain with the amino acid sequence from position 50 onward of normal β-globin. For the latter four categories, the systematic name is long and cumbersome, prompting universal use of the variant name rather than the systematic nomenclature. Hb VarDatabase is a relational database of Hb variants and thalassemia mutations and may be accessed at the Website http://globin.cse.psu.edu/hbvar/menu.html/accessed June 22, 2011. Hemoglobin S [β6(A3)Glu→Val]: Hb S in the heterozygous or homozygous state is the most widespread of the Hb variants and arises from a substitution of valine for glutamic acid at position 6 in the A helix of the β-globin chain. Hb S is found in high frequency in West and North Africa, the Middle East (especially Saudi Arabia), and the Indian subcontinent. Approximately 8% of African Americans are heterozygous for Hb S, and homozygous Hb S is found in 1 in 500 newborns in this group. Four haplotypes originating from different geographic locations have been described. The widespread distribution of the single point gene mutation responsible for the synthesis of Hb S in areas where P. falciparum malaria is endemic is due to protection of Hb S heterozygotes from the worst manifestations of the malaria. Homozygous Hemoglobin S (Hb SS): In homozygous Hb S, a valine-for-glutamic acid substitution occurs on both β-globin chains because of the inheritance of mutated β-globin chain genes from both parents. This condition is described as “sickle cell anemia” or “sickle cell disease” because of the sickle-shaped RBCs that occur when a “sickle cell crisis” occurs. It sometimes is written as βSβS.H65 HPLC analysis (see Figure 32-7, e) of a hemolysate of an individual homozygous for Hb S shows no Hb A peak and a small Hb A2 peak. The apparent Hb A2 concentration may be falsely increased because of the presence of glycated Hb S. Hemoglobin S forms 85 to 90% of the total Hb. The Hb F concentration is variable, with females having higher concentrations than men, and is somewhat, although not exclusively, haplotype dependent. The highest Hb F concentrations (10 to 25%) are found in individuals from the Middle East and the Indian subcontinent with the Arab-Indian haplotype. Low Hb F concentrations (5 to 6%) are found in the West African Cameroon (sometimes called Senegal) haplotype. The remaining haplotypes, the Benin and Bantu, have Hb F concentrations in the range of 6 to 7%. Increased concentrations of Hb F mitigate to some extent the clinical manifestations of sickle cell anemia. Electrophoresis (Figure 32-11) at both alkaline and acid pH shows a single large band in the Hb S position with small bands at the Hb A2 and Hb F positions. The sickle cell screen test is positive. Heterozygous Hemoglobin S (Hb S Trait): HPLC analysis (see Figure 32-7, f) of a hemolysate of a blood sample from an individual who is heterozygous for Hb S shows peaks in the Hb A and S positions, with 40% of the total Hb found in the Hb S peak. Hb S concentrations less than 30% are suggestive of coinheritance of α-thalassemia. Hb F concentration is variable. Electrophoresis (see Figure 32-11) at both alkaline and acid pH shows bands in the A and S positions. Hemoglobin SC (Hb SC Disease): SC disease arises when both β-globin chains are substituted at position 6 with valine (Hb S) or lysine (Hb C). On HPLC and capillary electrophoresis, analysis peaks are noted in the S and C positions, with the S peak forming the majority of the Hb present. Electrophoresis (see Figure 32-11) at both alkaline and acid pH shows bands in the S and C positions, and the sickling test is positive. Hemoglobin SD: Hb S may be coinherited with Hb D (SD disease). Individuals with this disease have similar but milder clinical presentation when compared with that of sickle cell disease (Hb SS). HPLC analysis shows two peaks—one in the Hb S position forming approximately 38 to 42% of the total Hb, and the other in the Hb D position forming 43 to 45% of the total Hb. The Hb F concentration is usually within the reference interval, although concentrations as high as 14% have been observed in some individuals with SD disease. Alkaline electrophoresis shows a band in the S position. Acid electrophoresis shows bands in the S and A positions. The sickling test is positive. CBC analysis shows a greatly decreased concentration of Hb with normal to slightly elevated MCV. Target, boat-shaped, nucleated, red, and sickle cells—together with anisocytosis and poikilocytosis—are noted on the peripheral blood smear. Hemoglobin S/O Arab: Coinheritance of Hb S and Hb O Arab presents a similar or somewhat milder clinical presentation to sickle cell disease and is found in the Middle East and North Africa. Hemoglobin S/G Philadelphia: One or more abnormal α-globin chains can combine with Hb S. In African Americans and West Africans, the combination of Hb G Philadelphia [α68(E17)Asn→Lys] with Hb S is prevalent. HPLC analysis (see Figure 32-7, i) on blood samples from these individuals shows at least two major peaks and two smaller peaks. The two major peaks are due to combinations of the normal α-chain with the normal β-chain and the abnormal α-chain with the normal β-chain. The two smaller peaks are due to combinations of the normal α-chain with the abnormal β-chain and the abnormal α-chain with the abnormal β-chain. Electrophoresis at alkaline pH shows major bands in the A and S positions with a minor band in the C position. At acid pH, bands are seen in the A and S positions. CBC analysis gives a slightly decreased Hb concentration with normal MCV and MCH. α- or β-Thalassemia can be coinherited with Hb G Philadelphia and Hb S. In these cases, CBC analysis results in markedly decreased MCV and MCH with reduced Hb concentration. Hemoglobin C [β6(A3)Glu→Lys]: Hb C arises from a substitution of lysine for glutamic acid at position 6 of the β-globin chain. Hb C may be found in the homozygous (Hb C disease, βCβC) or heterozygous (Hb C trait) state. Hb C is commonly found in West Africa and the Caribbean. It is the second most commonly studied, after Hb S, of all Hb variants. HPLC analysis (see Figure 32-7, g) on samples from individuals with homozygous Hb C shows a large peak in the C position, with Hb C forming 90 to 95% of the total Hb. Hb F concentrations are variable. Glycated Hb C is found as a small peak eluting before the Hb C peak. The ratio of the elution times of glycated Hb C to Hb C is the same as that of Hb A1c and Hb A. Electrophoresis at alkaline and acid pH shows a single band in the C position. Heterozygous Hemoglobin C (Hb C Trait): HPLC analysis (see Figure 32-7, h), capillary electrophoresis, and electrophoresis at both alkaline and acid pH (see Figure 32-11) on blood samples from individuals who are heterozygous for Hb C reveal bands in the A and C positions, with Hb C forming 38 to 45% of the total Hb. CBC analysis may show target cells and generally is normochromic with the MCV near the lower limit of the reference interval. Hemoglobin D Punjab [β121(GH4)Glu→Gln]: Hb D Punjab is an Hb variant in which glutamic acid at position 121 of the β-globin chain is replaced with glutamine. The names Hb D Los Angeles and Hb D Punjab are used to describe this variant, with the former name used more often in North America and the latter in the United Kingdom. Hb D Punjab is found in the Punjab region of the Indian subcontinent, especially in Sikhs of the Lycus Valley. Large-scale immigration from this area to the United Kingdom, the United States, and Canada has widened the distribution of Hb D Punjab. Hb D Punjab is also found in Caucasians whose foreparents lived in the Indian subcontinent at the time of the British Raj. Hemoglobin D Punjab is found in both heterozygous (Hb D Punjab trait) and homozygous (Hb D Punjab disease, βDβD) states. Individuals with Hb D Punjab trait are clinically asymptomatic. Hemoglobin D Iran [b22(B4)Glu→Gln]: Hb D Iran is a β-globin chain variant in which glutamine replaces glutamic acid at position 22 of the β-globin chain. Hemoglobin E [b26(B8)Glu→Lys]: Hb E is a β-chain variant with lysine replacing glutamic acid at position 26 of the β-globin chain. More individuals have the Hb variant Hb E than any other variant. Hb E is found in both homozygous and heterozygous states and may be combined with β-thalassemia. It is widespread in the Far East, including Southern China, Cambodia, Thailand, and Laos. Hb E is increasingly found in the United States and Canada and is caused by emigration from this area. It may be thought of as the “thalassemic variant,” as some of the features of the CBC resemble thalassemia especially in the homozygous state. Homozygous Hb E individuals are usually asymptomatic, although slight anemia may be present. HPLC analysis of blood from individuals with heterozygous Hb E reveals two peaks—one in the A position and the other in the A2 position. Hb E forms approximately 30% of the total Hb. Capillary electrophoresis resolves Hb E from Hb A2. Hb A2 is higher in patients with Hb E than in patients without a hemoglobin variant or thalassemia as the result of decreased synthesis of the abnormal β-globin chain, allowing for increased binding between the excess α-globin and δ-globin chains producing Hb A.H36-H37 CBC analysis shows normal Hb concentrations and occasionally low MCV. Target cells are noted in the peripheral blood smear. Iron studies are normal. Heterozygous Hb E individuals are usually asymptomatic, although slight anemia may be present. Coinheritance of Hb E and thalassemia produces an anemia of variable severity. HPLC on a patient with coinheritance of β-thalassemia and homozygous E is shown in Figure 32-7, C. Coinheritance of homozygous Hb E and β-thalassemia leads to a severe anemia with greatly reduced Hb concentrations, MCV, and MCH with increased Hb F concentration. Numerous target cells are noted on the peripheral blood smear, together with microcytosis, anisocytosis, hypochromia, and a few nucleated red cells. Iron studies are normal. In the most severe cases, the clinical presentation is similar to that of β0-thalassemia, and transfusion may be the only therapy. Coinheritance of heterozygous Hb E with α-thalassemia produces a less severe anemia with low Hb and MCV and MCH. Target cells are noted on the peripheral blood smear, together with microcytosis and hypochromia. Patients who are pregnant may need to be monitored closely, although transfusion is not usually required. Hemoglobin O Arab [b121(GH4)Glu→Lys]: Hb O Arab is a β-chain variant with lysine replacing glutamic acid at position 121 of the β-globin chain. Hb O Arab is found in a wide variety of ethnic groups in North Africa and Eastern Europe and is not confined, nor is it even common, among Arab populations. Hb O Arab has been found in both heterozygous and homozygous states. Hybrid Hemoglobins: Hybrid Hbs, or crossover Hbs, describe a group of Hb variants in which one of the globin chains is a hybrid of amino acid sequences of two other globin chains. The term crossover Hb is sometimes used because there is a point in the amino acid sequence at which there is crossover from the amino acid sequence of one globin chain to another globin chain. Individuals with these hybrid Hb variants present with clinical features and laboratory findings, particularly in their CBC, that are similar to those of thalassemia. Production of the hybrid globin chain is reduced. Hb Lepore is the prototypical hybrid Hb. Hemoglobin Lepore: Hb Lepore is classified as a δβ-hybrid Hb variant on the basis that the non–α-chain is a hybrid of δ- and β-globin chains. It is unique in that it is the only hemoglobinopathy named after the family name of the index case. δβ-Hybrid Hbs arise because there are deletions of part of the 3′ portion of the δ-globin gene and in the 5′ portion of the β-globin chain with resultant formation of a δβ-fusion gene. Three distinct variations of Hb Lepore have been described. In Hb Lepore-Hollandia [δβ-hybrid (δ through 22; β from 50)], a variant found in Canada and Papua New Guinea, fusion occurs of the first 22 amino acid residues of the δ-globin chain with the amino acids from position 50 onward of the β-globin chain. In Hb Lepore-Baltimore [δβ-hybrid (δ through 50: β from 86)], found mainly in individuals of Spanish ancestry, the first 50 amino acid residues of the δ-globin chain are fused with amino acid residues from position 86 of the β-globin chain. In Hb Lepore-Boston-Washington [δβ-hybrid (δ through 87; β from 116)], the most common Hb Lepore, the first 87 amino acid residues of the δ-globin chain are fused with amino acid residues from position 116 onward of the β-globin chain. Hb Lepore-Boston-Washington, sometimes called Hb Lepore-Boston, is found mainly in individuals of Italian descent, although it has been found in individuals from Eastern Europe. Elongation Hemoglobins: Elongation Hbs, of which there are 13, including seven α-chain and six β-chain variants, result from lengthening of the C or N terminus of either globin chain. The most important, from a clinical perspective, are the five C terminal α-chain variants in which the terminal codon TAA is changed and an amino acid sequence is added. The prototypical elongation Hb is Hb Constant Spring. In this variant, the C terminal TAA codon is changed to CAA in the α2-gene, and a 31 amino acid sequence is added at the C terminal end to give an α-globin chain length of 173 amino acid residues, rather than the normal 142 residue length. This increase in length results in instability of the Hb variant, and synthesis of this elongated globin chain is reduced. Hemoglobin Constant Spring is found in South East Asia, especially in Vietnam, Cambodia, and Laos, and is found in both heterozygous and homozygous states. The laboratory plays a crucial role in detection and characterization of the hemoglobinopathies and thalassemias discussed in the next sections.H1 Several recommendations have been put forth for the laboratory investigation of abnormal Hbs and thalassemias.H12,H30,H44 For example, in 1978 the International Committee for Standardization in Hematology expert panel on abnormal Hbs published recommendations for the laboratory investigation of these conditions.H45 In its initial investigation, (1) a CBC, (2) electrophoresis at pH 9.2, (3) tests for solubility and sickling, and (4) quantification of Hb A2 and Hb F were recommended. If an abnormal Hb was found as a result of these initial tests, further tests including electrophoresis at pH 6.2, globin chain separation, and isoelectric focusing were recommended by the panel. If the presence of an unstable Hb or Hb with altered oxygen affinity was suspected, then heat and isopropanol stability tests were recommended. Although new techniques have replaced some of these tests, the approach of using multiple assays in the initial investigation of hemoglobinopathies and thalassemias is an accepted practice that is used in many laboratories involved in the investigation of these disorders. In addition to these tests, the iron status of the patient should be ascertained by measurement of ferritin or by the iron/total iron-binding capacity/saturation index. Information on the ethnicity and/or nationality of the patient, when allowed under patient confidentiality rules, may provide useful information because thalassemias (e.g., β-thalassemia in individuals of Mediterranean origin) and certain hemoglobinopathies (e.g., Hb S trait and homozygous S in African Americans) are associated with particular ethnic and/or national groups. The 2010 guidelines of the British Committee for Standards in HaematologyH31 for the laboratory diagnosis of hemoglobinopathies recommend that qualification for genetic counseling requires identification of hemoglobins S, C, D Punjab, O Arab, E, Lepore, and H and the detection of carriers of α0-thalasssemia and β-thalasssemia traits. To accomplish this, it is recommended that “all ethnic groups” be screened for β thalassemia trait when the mean cell (or corpuscular) hemoglobin (MCH) is less than 27 pg. All ethnic groups, except for Northern European Caucasians, should be screened for hemoglobin variants. Selected ethnic groups should be screened for α0-thalassemia trait when the MCH is less than 25. Recommended methods include HPLC and hemoglobin electrophoresis for identification of hemoglobin variants, and HPLC and microcolumn chromatography for quantification of hemoglobin A2. Electrophoresis is not recommended for the quantification of HbA2 In addition, it is recommended that two methods, based on different analytical principle, be used to establish a presumptine identification of the hemoglobin variant. A flow chart, as shown in Figure 32-12, is suggested for identification of α0-, β-, and δβ-thalassemia traits and hemoglobin variants. A CBC of a whole blood sample consists of (1) numbers of RBCs (erythrocytes), (2) numbers of white blood cells, (3) numbers of platelets, (4) a measure of Hb, (5) estimates of red cell volume, and (6) estimation of white blood cell subtypes (see Table 32-1). [Note: A CBC is also known as a full blood count (FBC), a full blood examination (FBE), or a blood panel.] Knowledge of red cell indicesH24,H56 and the information obtained from microscopic examination of a peripheral blood film is vital to the diagnosis of both α- and β-thalassemias. Hemoglobinopathies have a lesser impact on red cell indices but may present abnormal red cell morphology on peripheral blood films. In thalassemias, the Hb concentration and the MCV, an index of cell size, are decreased, sometimes markedly, whereas in hemoglobinopathies, both are often normal. One study recommends that an MCV of less than 72 fL (reference interval ≈80 to 100 fL)H50 is maximally sensitive and specific for the presumptive diagnosis of thalassemia. However, an MCH less than 27 pg (reference interval ≈26 to 35 pg)H55 has been recommended as the decision point for further investigation for iron deficiency anemia and thalassemia. The rationale for the selection of MCH over MCV as the decision point for further investigation is the potential increase of up to 5 fL in MCV in samples older than 24 hours. In thalassemias, the RBCs in the peripheral blood smear are hypochromic and microcytic. Characteristic sickle- or crescent-shaped RBCs are seen (Figure 32-13) in the peripheral blood smear of patients who are homozygous for Hb S (sickle cell disease), and targets are seen in blood smears from patients who are homozygous for Hb E (see Figure 32-13) and Hb C. In addition, microspherocytes (erythrocytes whose diameter is less than normal, but whose thickness is increased) and crystalline inclusions (Hb C cells) have been found in peripheral blood smears from individuals who are homozygous for Hb C. These findings are less uniformly present than the typical morphologic features of sickle cell disease.
Hemoglobin, Iron, and Bilirubin
Hemoglobin
Biochemistry
Globin Structure of Normal and Fetal Hemoglobin
Protein Structure
Modified Hemoglobins
Carboxyhemoglobin
Methemoglobin
Sulfhemoglobin
Biosynthesis
Heme Biosynthesis
Globin Synthesis
Physiologic Role
Clinical Significance
Thalassemias
α-Thalassemias
Parameter
Definition
White blood cell count (WBC)
The number of white blood cells in the blood
WBC differential count
The number (or percentage) of each type of WBC present in the blood
Red blood cell (RBC) count
The number of red blood cells in the blood
Hematocrit (Hct)
The hematocrit is the proportion of blood volume that is occupied by red blood cells.
Hemoglobin (Hb)
The protein molecule in RBCs that carries oxygen
Mean cell volume (MCV)
The MCV is the average volume of an RBC.
Mean cell hemoglobin (MCH)
The average amount of hemoglobin in the average RBC
Mean cell hemoglobin concentration (MCHC)
The average concentration of hemoglobin in a given volume of blood
Red cell distribution width (RCDW)
A measurement of the variability of red blood cell size
Platelet count
The calculated number of platelets in a volume of blood
β-Thalassemias
Hemoglobinopathies
Classification of Hemoglobin Variants
Types of Hemoglobin Variants
Analytical Methods
Techniques
Complete Blood Count
![]()
Stay updated, free articles. Join our Telegram channel

Full access? Get Clinical Tree