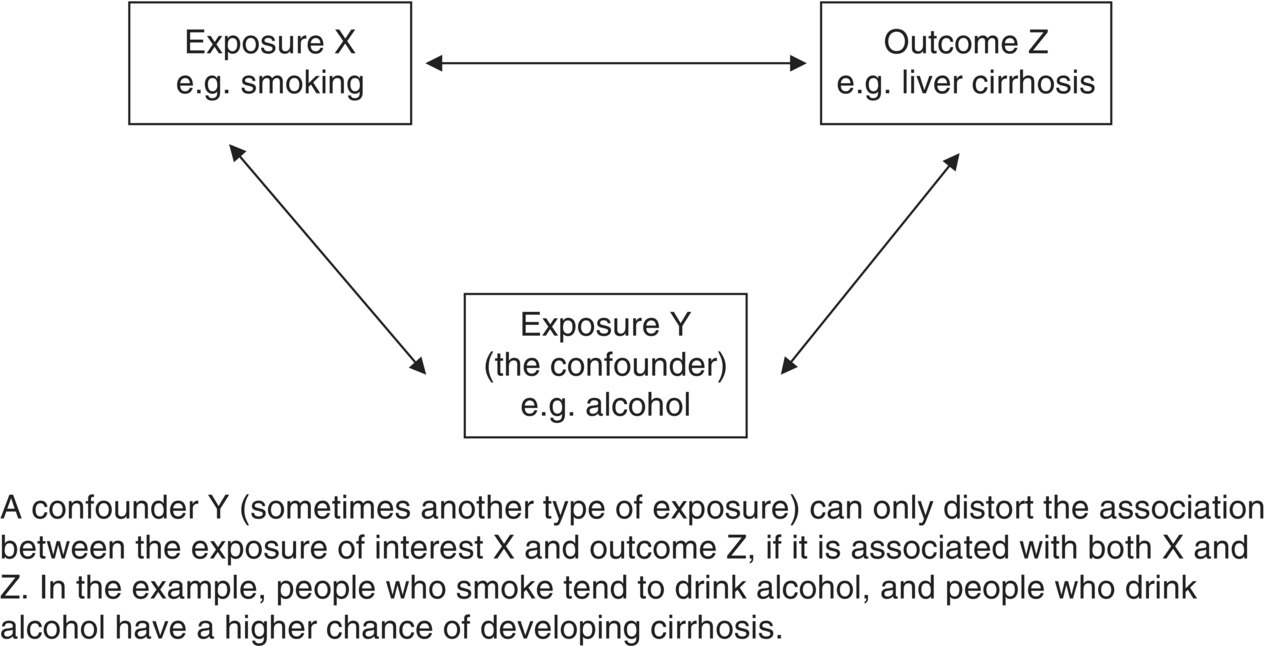
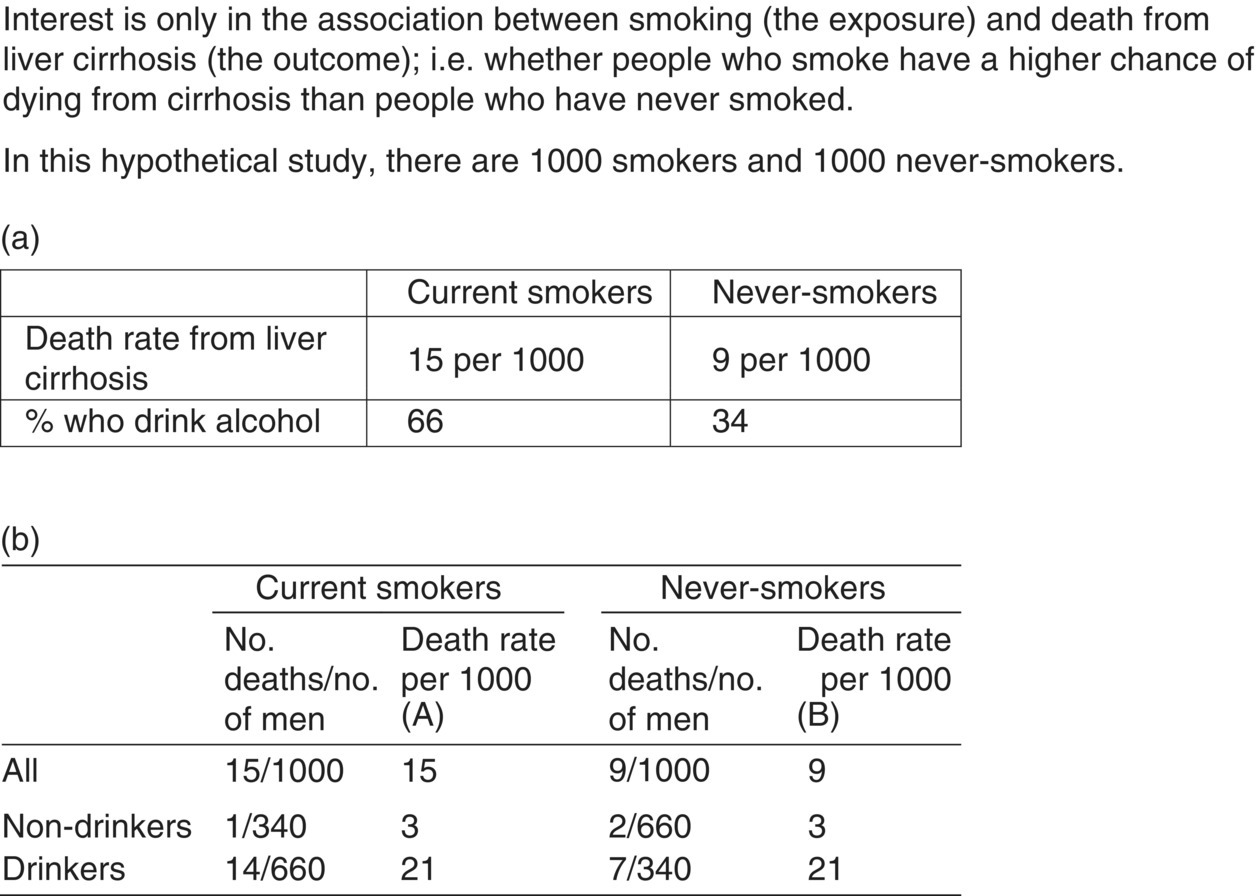
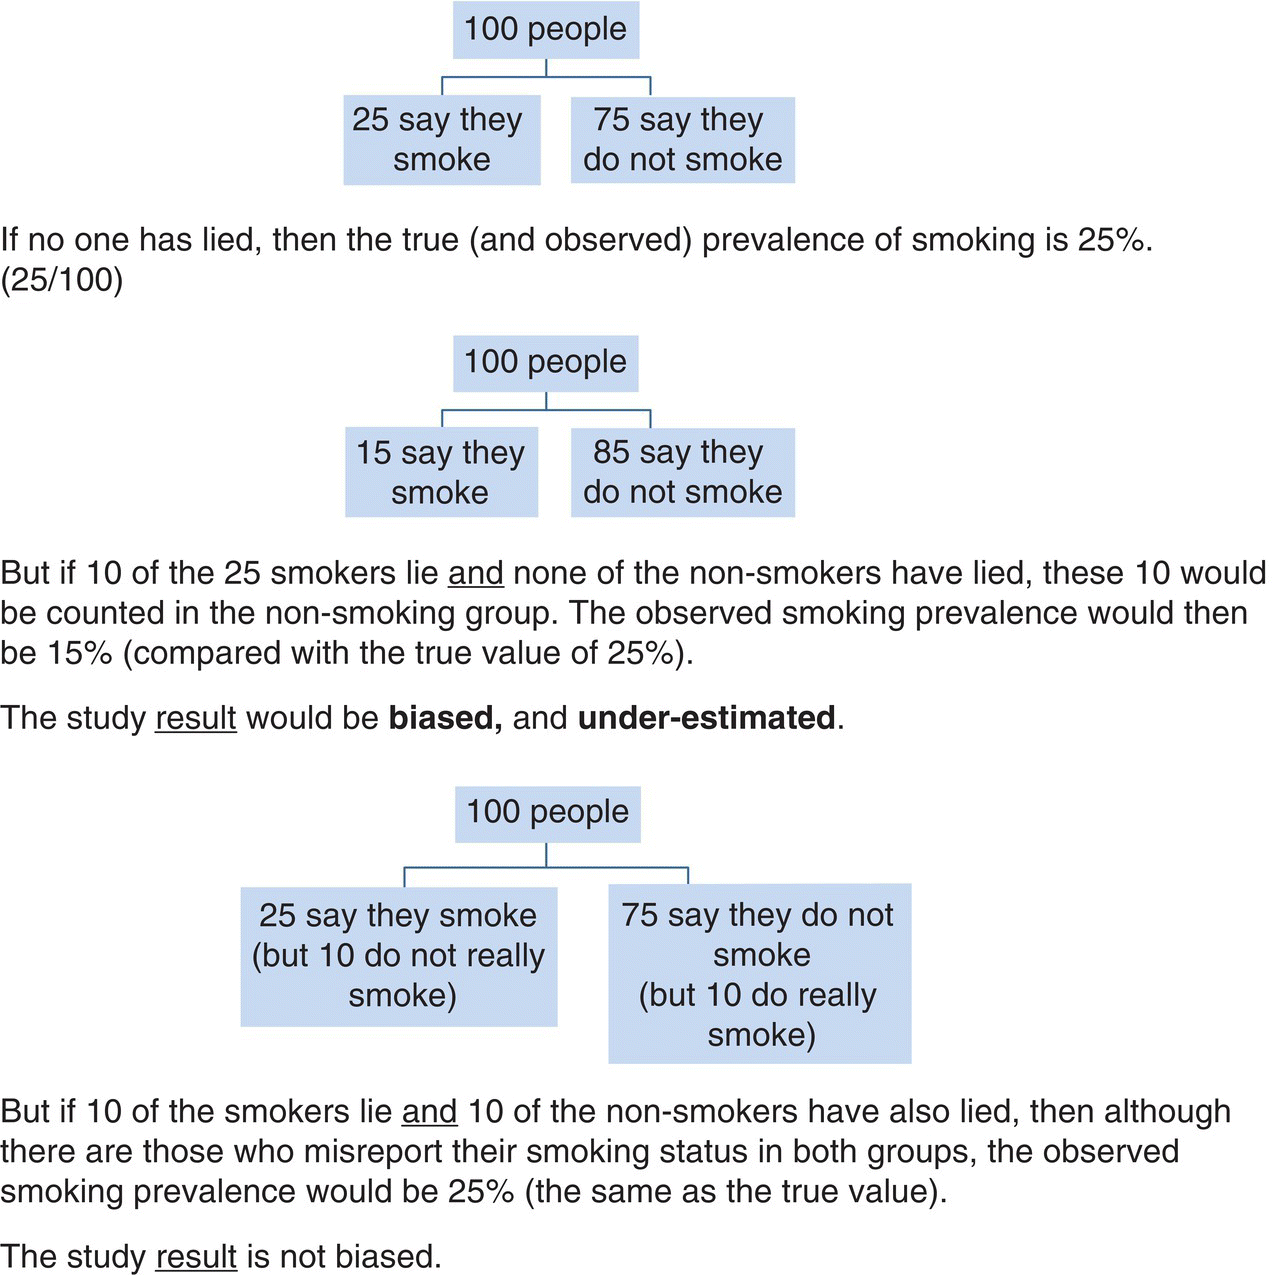
Chapter 1 This chapter provides a summary background to observational studies, their main purposes, the common types of designs, and some key design features. Further details on design and analysis are illustrated using examples in later chapters, and from other textbooks [1–3]. Two distinct study designs are used in medical research: observational and experimental. Experimental studies, commonly called clinical trials, are specifically designed to intervene in some aspect of how the study participants live their life or how they are treated in order to evaluate a health-related outcome. A key feature of a clinical trial is that some or all participants receive an intervention that they would not normally be given. Observational studies, as the term implies, are not intentionally meant to intervene in the way individuals live or behave or how they are treated.1 Participants are free to choose their lifestyle habits and, with their physician, decide which interventions they receive when considering preventing or treating a disorder. Box 1.1 shows the most common purposes of observational studies. The research question(s), which can also be referred to as objectives, purpose, aims, or hypotheses, should be clear, easy to read, and written in non-technical language where possible. They are usually developed to address a research issue that has not been examined before, to corroborate or refute previous evidence, or to examine a topic on which prior evidence has had shortcomings or been scientifically flawed. There is a distinction between objectives and outcome measures (or endpoints). An outcome measure is the specific quantitative measure used to address the objective. For example, a study objective could be ‘to examine the smoking habits of adults’. Possible corresponding endpoints could be either ‘the proportion of all participants who report themselves as smokers’ or ‘the number of cigarettes smoked per day’, but they are quite different endpoints. Box 1.2 shows examples of objectives and outcome measures. It can be easy to specify the research question or objective for studies that involve simply describing the characteristics of a single group of people (e.g. demographics, or biological or physical measurements). For example: Clinical trials often have a single primary objective, occasionally two or three at most, each associated with an endpoint. However, there can be more flexibility on this for observational studies unless they have been designed to change a specific aspect of public health policy. Many observational studies have several objectives, some of which may only arise during the study or at the end, and they can also be exploratory. While some researchers seek only to describe the characteristics of a single group of people (the simplest study type), it is common to look at associations between two factors. Many research studies, both observational studies and clinical trials, are designed to: Box 1.3 gives examples of these. To evaluate risk factors or causes of disease or early death, an outcome measure must be compared between two groups of people: An exposure is often thought to be a factor that can be avoided or removed from our lives, such as a lifestyle habit or something encountered at work or in the environment, but it can be any of the following: Also, a factor can be either an exposure or an outcome, depending on the research question (e.g. body weight in Box 1.3). Considering a research study in the context of examining the relationship between exposures and outcomes greatly helps to understand the design and analysis. An important consideration for all observational research studies is variability (natural variation). For example, smoking is a cause of lung cancer, but why do some people who have smoked 40 cigarettes a day for most of their adult lives not develop lung cancer, while others who have never smoked do? The answer is that people vary. They have different body characteristics (e.g. weight and blood pressure), different genetic make-up, and different lifestyles (e.g. diet, and exercise). People react to the same exposure in different ways. When an association (risk or causal factor)2 is evaluated, it is essential to consider if the observed responses are consistent with natural variation or whether there really is an effect. Allowance must be made for variability in order to judge how much of the association seen at the end of a study is due to natural variation (i.e. chance) and how much is due to the effect of the risk factor of interest. The more variability there is, the harder it is to detect an association. Highly controlled studies (such as laboratory experiments or randomised clinical trials) have relatively less variation because the researchers have control over how the study subjects (biological samples, animals, or human participants) are selected, managed, and assessed. The best way to evaluate the effect of an exposure on an outcome is to ‘make everything the same’, in relation to the characteristics of the two (or more) groups being compared except the factor of interest. For example, to examine whether smoking is a cause of lung cancer, the risk of lung cancer between never-smokers and current smokers must be compared; to evaluate statin therapy for treating people with ischaemic heart disease, survival times between patients who did and did not receive statins are compared. Ideally, the exposed and unexposed groups should be identical in terms of demographics, physical and biological characteristics, and lifestyle habits, so that the only difference between the groups is that one is exposed to the factor of interest (smokes or receives statins) and the other is not exposed. [In reality, the two groups can never be identical; there will always be some random (chance) differences between them due to natural variability.] Consequently, if a clear difference is seen in the outcome measure (lung cancer risk or survival time), it should only be due to the exposure status, and not any other factor. This is a fundamental concept in medical research, and one that allows causal inferences to be made more reliably. An example is shown in Box 1.4. In a randomised clinical trial, the process of randomisation aims to ‘make everything the same’, except the intervention given. The researcher randomly allocates the interventions (exposures) leading to two similar groups. Any differences in the outcome measure should only be due to the intervention, which is why clinical trials (and systematic reviews of them) usually provide the best level of evidence in medical research, and a causal relationship can often be determined. Published reports of all randomised studies contain a table confirming that baseline characteristics are similar between the trial groups. In observational studies, however, the exposure cannot be randomly allocated by the research team. The researchers can only observe, not intervene, and it is likely for several differences to exist between the groups to be compared. The more differences there are, the more difficult it will be to conclude a causal link. The two main sources of these differences are confounding and bias. Confounding and bias might still be present to some small extent in a randomised clinical trial, but the purpose of randomisation is to minimise their effect. Confounding and bias can each distort the results and therefore the conclusions (Box 1.5). Some researchers consider confounding as a type of bias, because both have similar effects on the results. However, a key difference is that it is usually possible to measure confounding factors and therefore allow for them in the statistical analysis, but a factor associated with bias is often difficult or impossible to measure, and therefore it cannot be adjusted for in the same way as confounding. Confounding and bias could work together, or in opposite directions. It may not be possible to separate their effects reliably. Researchers try to remove or minimise the effect of bias at the design stage or when conducting the study. The effect of some confounding factors can also be minimised at this stage (matched case–control studies, see Chapter 6, page 114). A confounding factor is often another type of exposure, and to affect the study results, it must be associated with both the exposure and outcome of interest (Figure 1.1). The factor could be more common in either the exposed or unexposed groups.Figure 1.2 shows a hypothetical example of how confounding can distort the results of a study. The primary interest is in whether smoking is associated with death from liver cirrhosis. In Figure 1.2a, if the death rates are simply compared between smokers and non-smokers, they appear to be higher among smokers (15 vs. 9 per 1000). It could be concluded that smokers have a higher risk, and this could be used as supporting evidence that smoking is a risk factor for cirrhosis. However, from Figure 1.2a, it is clear that smokers are more likely to be alcohol drinkers (66 vs. 34%), and it is already known that alcohol increases the risk of liver cirrhosis. Because the exposed (current smokers) and unexposed (never-smokers) groups have different alcohol consumption habits, they are not ‘the same’, and the difference in death rates could be due to smoking status, the difference in alcohol consumption, or a combination of the two. Figure 1.1 The effect of an exposure on an outcome, with a third factor, the confounder. Figure 1.2 Hypothetical example of how a confounder can distort the results when examining the effect of an exposure on an outcome and how it can be allowed for. Because drinking status has been measured for all participants, it is perhaps intuitive that to remove its confounding effect, the association between smoking and cirrhosis deaths can be examined separately for drinkers and non-drinkers. This is shown in Figure 1.2b. By comparing the death rates between smokers and never-smokers only among non-drinkers, alcohol cannot have any confounding effect, because the two exposure groups have been ‘made the same’ in terms of alcohol consumption. The death rates are found to be identical, and the conclusion is reached that smoking is not associated with cirrhosis in this group. A similar finding is made among drinkers only, where, although the death rates are higher than those in non-drinkers (as expected), they are identical between smokers and never-smokers. The effect of confounding has been to create an association when really there was none. Analysing the data in this way (called a stratified analysis) is the simplest way to allow or adjust for a confounding factor. In practice, there are more efficient and sophisticated statistical methods to adjust for confounders (regression analyses; Chapter 4). If there is uncertainty over the relationship between the confounder and either the exposure or the outcome, it is worth taking it into account as a potential confounding factor. A factor should not be considered a confounder if it lies on the same biological (causal) pathway between the exposure and an outcome [2]. For example, if looking at the effect of a high-fat diet on the risk of heart disease, high cholesterol is a consequence of the diet, and it can also lead to heart disease. Therefore, cholesterol would not be a confounder because it must, by definition, be causally associated with both exposure and outcome, and its effect should not (or cannot) be removed. A bias occurs where the actions of participants or researchers produce a value of the study outcome measure that is systematically under- or over-reported in one group compared with another (i.e. it works in one direction). Figure 1.3 is a simple illustration. In the middle figure, only people who smoke lie about (misreport) their smoking status, and the effect of this is to bias the study result (in this case the prevalence of smoking). If, however, the number of non-smokers who lie about their smoking status is similar to that in smokers, even though there are lots of people who misreport their habits, the study result itself is not biased. But non-smokers rarely report themselves as smokers. It is important to focus on the bias in the result rather than the factor creating the bias. Figure 1.3 Illustration of bias, using an example in which the aim is to estimate the proportion of people who smoke, based on self-reported measures. Unlike confounding (where in the example above it was simple to obtain the alcohol status of the study subjects and, therefore, allow for it when examining the effect of smoking on liver cirrhosis), it is difficult to measure bias, because it would require the participants to admit whether or not they are lying, which, of course, would not happen. Researchers attempt to minimise bias at the design stage. In the example in Figure 1.3, estimating smoking prevalence could be assessed using biochemical confirmation of smoking status using nicotine or cotinine in the saliva of the participants, where high levels are indicative of being a smoker. However, even this is not perfect, because a light smoker could have low concentrations that overlap with non-smokers, and non-smokers heavily exposed to environmental tobacco smoke could have levels that overlap with some smokers. Many other biases are similarly difficult or impossible to measure. There are several types of biases (Box 1.6), and they can arise from something either the researcher or study participant has done [4]. To determine whether bias exists, the following questions should be considered:
Fundamental concepts
1.1 Observational studies: purpose
1.2 Specifying a clear research question: exposures and outcomes
Examining the effect of an exposure on an outcome
“Make everything else the same”: natural variation, confounding, and bias
Confounding


Bias

Stay updated, free articles. Join our Telegram channel

Full access? Get Clinical Tree


