Endocrine Pancreas and Pharmacotherapy of Diabetes Mellitus and Hypoglycemia
Diabetes mellitus is a spectrum of metabolic disorders arising from myriad pathogenic mechanisms, all resulting in hyperglycemia. Both genetic and environmental factors contribute to its pathogenesis, which involves insufficient insulin secretion, reduced responsiveness to endogenous or exogenous insulin, increased glucose production, and/or abnormalities in fat and protein metabolism. The resulting hyperglycemia may lead to both acute symptoms and metabolic abnormalities. Major sources of the morbidity of diabetes are the chronic complications that arise from prolonged hyperglycemia, including retinopathy, neuropathy, nephropathy, and cardiovascular disease. These chronic complications can be mitigated in many patients by sustained control of the blood glucose. There are now a wide variety of treatment options for hyperglycemia that target different processes involved in glucose regulation or dysregulation.
PHYSIOLOGY OF GLUCOSE HOMEOSTASIS
REGULATION OF BLOOD GLUCOSE. The maintenance of glucose homeostasis, termed glucose tolerance, is a highly developed systemic process involving the integration of several major organs (Figure 43–1). Although the actions of insulin are of central importance, webs of inter-organ communication via other hormones, nerves, local factors and substrates, also play a vital role. The pancreatic β cell is central in this homeostatic process, adjusting the amount of insulin secreted very precisely to promote glucose uptake after meals and to regulate glucose output from the liver during fasting.
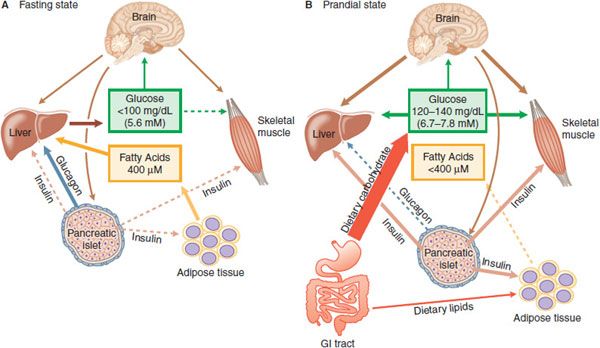
Figure 43–1 Insulin, glucagon, and glucose homeostasis. A. Fasting State—In healthy humans plasma glucose is maintained in a range from 4.4-5 mM, and fatty acids near 400 µM. In the absence of nutrient absorption from the GI tract, glucose is supplied primarily from the liver and fatty acids from adipose tissue. With fasting, plasma insulin levels are low, and plasma glucagon is elevated, contributing to increased hepatic glycogenolysis and gluconeogenesis; low insulin also releases adipocytes from inhibition, permitting increased lipogenesis. Most tissues oxidize primarily fatty acids during fasting, sparing glucose for use by the CNS. B. Prandial State—During feeding, nutrient absorption causes an increase in plasma glucose, resulting in release of incretins from the gut and neural stimuli that promote insulin secretion. Under the control of insulin, the liver, skeletal muscle, and adipose tissue actively take up glucose. Hepatic glucose production and lipolysis are inhibited, and total body glucose oxidation increases. The brain senses plasma glucose concentrations and provides regulatory inputs contributing to fuel homeostasis. The boldness of the arrows reflects relative intensity of action; a dashed line indicates little or no activity.
In the fasting state (Figure 43–1A), the fuel demands of the body are met by the oxidation of fatty acids. The brain does not effectively use fatty acids to meet energy needs and in the fasting state requires glucose for normal function; glucose requirements are ~2 mg/kg/min in adult humans, largely to supply the central nervous system (CNS) with an energy source. Fasting glucose requirements are primarily provided by the liver. Liver glycogen stores provide some of this glucose; conversion of lactate, alanine, and glycerol into glucose accounts for the remainder. The dominant regulation of hepatic glycogenolysis and gluconeogenesis are the pancreatic islet hormones insulin and glucagon. Insulin inhibits hepatic glucose production, and the decline of circulating insulin concentrations in the post-absorptive state (fasting) is permissive for higher rates of glucose output. Glucagon maintains blood glucose concentrations at physiological levels in the absence of exogenous carbohydrate (overnight and in between meals) by stimulating gluconeogenesis and glycogenolysis by the liver. Insulin secretion is stimulated by food ingestion, nutrient absorption, and elevated blood glucose, and insulin promotes glucose, lipid, and protein anabolism (Figure 43–1B). The centrality of insulin in glucose metabolism is emphasized by the fact that all the forms of human diabetes have as a root cause some abnormality of insulin secretion or action.
Pancreatic β cell function is primarily controlled by plasma glucose concentrations. Elevations of blood glucose are necessary for insulin release above basal levels, and other stimuli are relatively ineffective when plasma glucose is in the fasting range (4.4-5.5 mM or 80-100 mg %). These other stimuli include nutrient substrates, insulinotropic hormones released from the GI tract, and autonomic neural pathways. Neural stimuli cause some increase of insulin secretion prior to food consumption. Neural stimulation of insulin secretion occurs throughout the meal and contributes significantly to glucose tolerance. Arrival of nutrient chyme to the intestine leads to the release of insulinotropic peptides from specialized endocrine cells in the intestinal mucosa. Glucose-dependent insulinotropic polypeptide (GIP) and glucagon-like peptide 1 (GLP-1), together termed incretins, are the essential gut hormones contributing to glucose tolerance. They are secreted in proportion to the nutrient load ingested and relay this information to the islet as part of a feed-forward mechanism that allows an insulin response appropriate to meal size. Insulin secretion rates in healthy humans are highest in the early digestive phase of meals, preceding and limiting the peak in blood glucose. This pattern of premonitory insulin secretion is an essential feature of normal glucose tolerance. How to mimic this pattern is one of the key challenges for successful insulin therapy in diabetic patients.
Elevated circulating insulin concentrations lower glucose in blood by inhibiting hepatic glucose production and stimulating the uptake and metabolism of glucose by muscle and adipose tissue. Production of glucose is inhibited half-maximally by an insulin concentration of ~120 pmol/L, whereas glucose utilization is stimulated half-maximally at ~300 pmol/L. Some of the effects of insulin on the liver occur rapidly, within the first 20 min of meal ingestion, whereas stimulation of peripheral glucose uptake may require up to an hour to reach significant rates. Insulin has potent effects to reduce lipolysis from adipocytes, primarily through the inhibition of hormone-sensitive lipase, and increases lipid storage by promoting lipoprotein–lipase synthesis and adipocyte glucose uptake. Insulin also stimulates amino acid uptake and protein synthesis and inhibits protein degradation in muscle and other tissues.
The limited glycogen stores in skeletal muscle are mobilized at the onset of activity but most of the glucose support for exercise comes from hepatic gluconeogenesis. The dominant regulation of hepatic glucose production during exercise comes from EPI and NE. The catecholamines stimulate glycogenolysis and gluconeogenesis, inhibit insulin secretion, and enhance release of glucagon, all contributing to increased hepatic glucose output. In addition, catecholamines promote lipolysis, freeing fatty acids for oxidation in exercising muscle and glycerol for hepatic gluconeogenesis.
PANCREATIC ISLET PHYSIOLOGY AND INSULIN SECRETION. The pancreatic islets comprise 1-2% of the pancreatic volume. The pancreatic islet is a highly vascularized, highly innervated mini-organ containing 5 endocrine cell types: α cells that secrete glucagon, cells that secrete insulin, δ cells that secrete somatostatin, cells that secrete pancreatic polypeptide, and ε cells that secrete ghrelin.
Insulin is initially synthesized as a single polypeptide chain, preproinsulin (110 amino acid), which is processed first to proinsulin and then to insulin and C-peptide (Figure 43–2). This complex and highly regulated process involves the Golgi complex, the endoplasmic reticulum, and the secretory granules of the β cell. Secretory granules are critical in bringing insulin to the cell surface for exocytosis, and in the cleavage and processing of the prohormone to the final secretion products, insulin and C-peptide. Equimolar quantities of insulin and C-peptide (31 amino acids) are co-secreted. Insulin has a t1/2 of 5-6 min due to extensive hepatic clearance. C-peptide, in contrast, with no known physiological function or receptor, has a t1/2 of ~30 min. The C-peptide is useful in assessment of β cell secretion, and to distinguish endogenous and exogenous hyperinsulinemia (for example in the evaluation of insulin-induced hypoglycemia). The β cell also synthesizes and secretes islet amyloid polypeptide (IAPP) or amylin, a 37–amino acid peptide. IAPP influences GI motility and the speed of glucose absorption. Pramlintide is an agent used in the treatment of diabetes that mimics the action of IAPP.
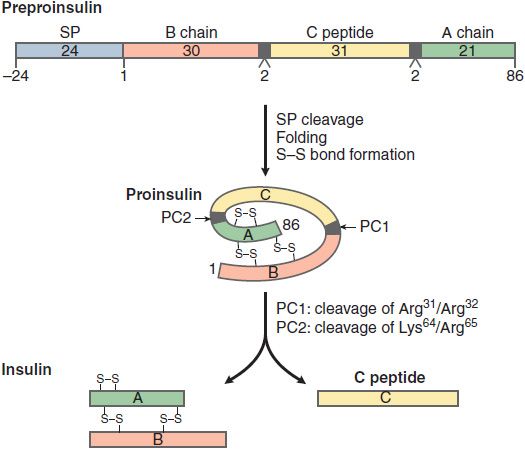
Figure 43–2 Synthesis and processing of insulin. The initial peptide, preproinsulin (110 amino acids) consists of a signal peptide (SP), B chain, C peptide, and A chain. The SP is cleaved and S-S bonds form as the proinsulin folds. Two prohormone convertases, PC1 and PC2, cleave proinsulin into insulin, C peptide, and 2 dipeptides. Insulin and C peptide are stored in granules and co-secreted in equimolar quantities.
Insulin secretion is tightly regulated to provide stable concentrations of glucose in blood during both fasting and feeding. This regulation is achieved by the coordinated interplay of various nutrients, GI hormones, pancreatic hormones, and autonomic neurotransmitters. Glucose, amino acids (arginine, etc.), fatty acids, and ketone bodies promote the secretion of insulin. Glucose is the primary insulin secretagogue, and insulin secretion is tightly coupled to the extracellular glucose concentration. Insulin secretion is much greater when the same amount of glucose is delivered orally compared to intravenously (incretin effect). Islets are richly innervated by both adrenergic and cholinergic nerves. Stimulation of α2 adrenergic receptors inhibits insulin secretion, whereas β2 adrenergic receptor agonists and vagal nerve stimulation enhance release. In general, any condition that activates the sympathetic branch of the autonomic nervous system (such as hypoxia, hypoglycemia, exercise, hypothermia, surgery, or severe burns) suppresses the secretion of insulin by stimulation of α2 adrenergic receptors. Glucagon and somatostatin inhibit insulin secretion.
The molecular events controlling glucose-stimulated insulin secretion begin with the transport of glucose into the β cell via GLUT, a facilitative glucose transporter, primarily GLUT1 in human β cells (Figure 43–3). Upon entry into the β cell, glucose is quickly phosphorylated by glucokinase (GK; hexokinase IV); this phosphorylation is the rate-limiting step in glucose metabolism in the β cell. GK’s distinctive affinity for glucose leads to a marked increase in glucose metabolism over the range of 5-10 mM glucose, where glucose-stimulated insulin secretion is most pronounced. The glucose-6-phosphate produced by GK activity enters the glycolytic pathway, producing changes in NADPH and the ratio of ADP/ATP. Elevated ATP inhibits an ATP-sensitive K+ channel (KATP channel), leading to cell membrane depolarization. This heteromeric KATP channel consists of an inward rectifying K+ channel (Kir6.2) and a closely associated protein known as the sulfonylurea receptor (SUR). Mutations in the KATP channel are responsible for some types of neonatal diabetes or hypoglycemia. Membrane depolarization then leads to opening of a voltage-dependent Ca2+ channel and increased intracellular Ca2+, resulting in exocytotic release of insulin from storage vesicles. These intracellular events are modulated by changes in cAMP production, amino acid metabolism, and the level of transcription factors. GPCRs for glucagon, GIP, and GLP-1 couple to Gs to stimulate adenylyl cyclase and insulin secretion; receptors for somatostatin and α2 adrenergic agonists couple to Gi to reduce cellular cAMP production and secretion.
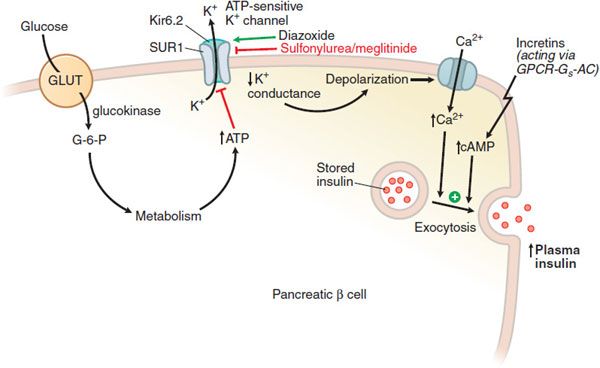
Figure 43–3 Regulation of insulin secretion from a pancreatic β cell. The pancreatic β cell in a resting state (fasting blood glucose) is hyperpolarized. Glucose, entering via GLUT transporters (primarily GLUT1 in humans, GLUT2 in rodents), is metabolized and elevates cellular ATP, which reduces K+ conductance through the KATP channel; the decreased K+ conductance results in depolarization, leading to Ca2+-dependent exocytosis of stored insulin. The KATP channel, with SUR1 and Kir 6.2 subunits, is the site of action of several classes of drugs: ATP binds to and inhibits Kir 6.2; sulfonylureas and meglitinides bind to and inhibit SUR1; all 3 agents thereby promote insulin secretion. Diazoxide and ADP-Mg2+ (low ATP) bind to and activate SUR1, thereby inhibiting insulin secretion. Incretins enhance insulin secretion.
The pancreatic α cell secretes glucagon, primarily in response to hypoglycemia. Glucagon biosynthesis begins with preproglucagon, which is processed in a cell-specific fashion to several biologically active peptides such as glucagon, GLP-1, and glucagon-like peptide 2 (GLP-2) (see Figure 43–9). In general, glucagon and insulin secretion are regulated in a reciprocal fashion; that is, the agents or processes that stimulate insulin secretion inhibit glucagon secretion. Notable exceptions are arginine and somatostatin: arginine stimulates and somatostatin inhibits the secretion of both hormones.
INSULIN ACTION. The insulin receptor is expressed on virtually all mammalian cell types. Tissues that are critical for regulation of blood glucose are liver, skeletal muscle, fat (see Figure 43–1), and specific regions of the brain and the pancreatic islet. The actions of insulin are anabolic, and insulin signaling is critical for promoting the uptake, use, and storage of the major nutrients: glucose, lipids, and amino acids. Insulin stimulates glycogenesis, lipogenesis, and protein synthesis; it also inhibits the catabolism of these compounds. On a cellular level, insulin stimulates transport of substrates and ions into cells, promotes translocation of proteins between cellular compartments, regulates the action of specific enzymes, and controls gene transcription and mRNA translation. Some effects of insulin (e.g., activation of glucose and ion transport systems, phosphorylation or dephosphorylation of specific enzymes) occur within seconds or minutes; other effects (e.g., those promoting protein synthesis and regulating gene transcription and cell proliferation) manifest over minutes to hours to days. The effects of insulin on cell proliferation and differentiation occur over days.
THE INSULIN RECEPTOR. Insulin action is transmitted through a receptor tyrosine kinase that bears functional similarity to the insulin-like growth factor 1 (IGF-1) receptor. The insulin receptor is composed of linked α/β subunit dimers that are products of a single gene; dimers linked by disulfide bonds form a transmembrane heterotetramer glycoprotein composed of 2 extracellular α-subunits and 2 membrane-spanning β-subunits (Figure 43–4). The number of receptors varies from 40/cell on erythrocytes to 300,000/cell on adipocytes and hepatocytes.
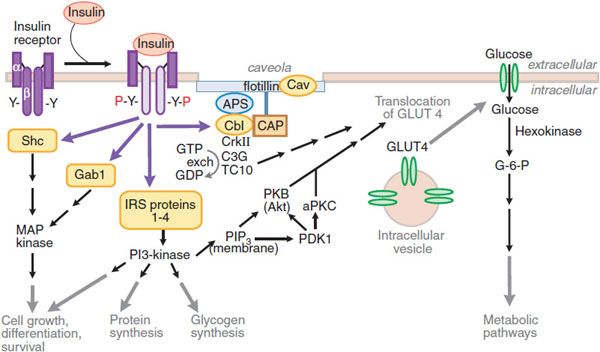
Figure 43–4 Pathways of insulin signaling. The binding of insulin to its plasma membrane receptor activates a cascade of downstream signaling events. Insulin binding activates the intrinsic tyrosine kinase activity of the receptor dimer, resulting in the tyrosine phosphorylation (Y-P) of the receptor’s β subunits and a small number of specific substrates (yellow shapes): the insulin receptor substrate (IRS) proteins, Gab-1 and SHC; within the membrane, a caveolar pool of insulin receptor phosphorylates caveolin (Cav), APS, and Cbl. These tyrosine-phosphorylated proteins interact with signaling cascades via SH2 and SH3 domains to mediate the effects of insulin, with specific effects resulting from each pathway. In target tissues such as skeletal muscle and adipocytes, a key event is the translocation of the Glut4 glucose transporter from intracellular vesicles to the plasma membrane; this translocation is stimulated by both the caveolar and noncaveolar pathways. In the noncaveolar pathway, the activation of PI3K is crucial, and PKB/Akt (anchored at the membrane by PIP3) and/or an atypical form of PKC is involved. In the caveolar pathway, caveolar protein flotillin localizes the signaling complex to the caveola; the signaling pathway involves series of SH2 domain interactions that add the adaptor protein CrkII, the guanine nucleotide exchange protein C3G, and small GTP-binding protein, TC10. The pathways are inactivated by specific phosphoprotein phosphatases (e.g., PTB1B). In addition to the actions shown, insulin also stimulates the plasma membrane Na+, K+-ATPase by a mechanism that is still being elucidated; the result is an increase in pump activity and a net accumulation of K+ in the cell. Abbreviations: APS, adaptor protein with PH and SH2 domains; CAP, Cbl associated protein; CrkII, chicken tumor virus regulator of kinase II; GLUT4, glucose transporter 4; Gab-1, Grb-2 associated binder; MAP kinase, mitogen-activated protein kinase; PDK, phosphoinositide-dependent kinase; PI3 kinase, phosphatidylinositol-3-kinase; PIP3, phosphatidylinositol trisphosphate; PKB, protein kinase B (also called Akt); aPKC, atypical isoform of protein kinase C; Y, tyrosine residue; Y-P, phosphorylated tyrosine residue.
The α-subunits inhibit the inherent tyrosine kinase activity of the β-subunits. Insulin binding to the α-subunits releases this inhibition and allows transphosphorylation of 1 β-subunit by the other, and autophosphorylation at specific sites from the juxtamembrane region to the intracellular tail of the receptor. Activation of the insulin receptor initiates signaling by phosphorylating a set of intracellular proteins such as the insulin receptor substrates (IRS) and Src-homology-2-containing protein (Shc). These IRS interact with effectors that amplify and extend the signaling cascade.
Insulin action on glucose transport depends on the activation of phosphatidylinositol-3-kinase (PI3K). PI3K is activated by interaction with IRS proteins and generates phosphatidylinositol 3,4,5-trisphosphate (PIP3), which regulates the localization and activity of several downstream kinases, including Akt, atypical isoforms of protein kinase C (PKC ζ and λ/τ), and mammalian target of rapamycin (mTOR). The isoform Akt2 appears to control the downstream steps that are important for glucose uptake in skeletal muscle and adipose tissue, and to regulate glucose production in the liver. Substrates of Akt2 coordinate the translocation of the glucose transporter 4 (GLUT4) to the plasma membrane through processes involving actin remodeling and other membrane trafficking systems. Actions of small G-proteins, such as Rac and TC10, have also been implicated in the actin remodeling necessary for GLUT4 translocation. GLUT4 is expressed in insulin-responsive tissues such as skeletal muscle and adipose tissue. In the basal state, most GLUT4 resides in the intracellular space; following activation of insulin receptors, GLUT4 is shifted rapidly and in abundance to the plasma membrane, where it facilitates inward transport of glucose from the circulation. Insulin signaling also reduces GLUT4 endocytosis, increasing the residence time of the protein in the plasma membrane. Following the facilitated diffusion into cells along a concentration gradient, glucose is phosphorylated to glucose-6-phosphate (G-6-P) by hexokinases. Hexokinase II is found in association with GLUT4 in skeletal and cardiac muscle and in adipose tissue. Like GLUT4, hexokinase II is regulated transcriptionally by insulin. G-6-P can be isomerized to G-1-P and stored as glycogen (insulin enhances the activity of glycogen synthase); G-6-P can enter the glycolytic pathway (for ATP production) and the pentose phosphate pathway.
PATHOPHYSIOLOGY AND DIAGNOSIS OF DIABETES MELLITUS
GLUCOSE HOMEOSTASIS AND THE DIAGNOSIS OF DIABETES
Broad categories of glucose homeostasis as defined by the fasting blood glucose or the glucose level following an oral glucose challenge include:
• Normal glucose homeostasis: fasting plasma glucose <5.6 mmol/L (100 mg/dL)
• Impaired fasting glucose (IFG): 5.6-6.9 mmol/L (100-125 mg/dL)
• Impaired glucose tolerance (IGT): glucose level between 7.8 and 11.1 mmol/L (140-199 mg/dL) 120 min after ingestion of 75 g liquid glucose solution
• Diabetes mellitus (see Table 43–1)
Table 43–1
Criteria for the Diagnosis of Diabetes
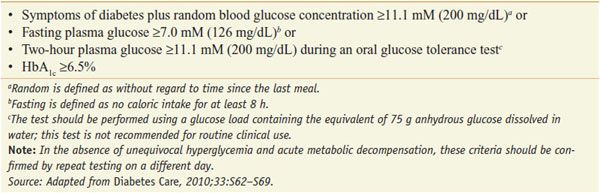
The American Diabetes Association (ADA) and the World Health Organization (WHO) have adopted criteria for the diagnosis of diabetes, based on the fasting blood glucose, the glucose value following an oral glucose challenge, or the level of hemoglobin A1c (HbA1c, or more simply, A1c; exposure of proteins to elevated [glucose] produces nonenzymatic glycation of proteins including Hb. Thus, the level of A1c represents a measure of the average glucose concentration to which the Hb has been exposed) (see Table 43–1). The diagnostic criteria have recently been changed to also include an A1c value ≥6.5%. Impaired fasting glucose (IFG) and impaired glucose tolerance (IGT), or an A1c of 5.7-6.4% portend a markedly increased risk of progressing to type 2 diabetes, and are associated with increased risk of cardiovascular disease.
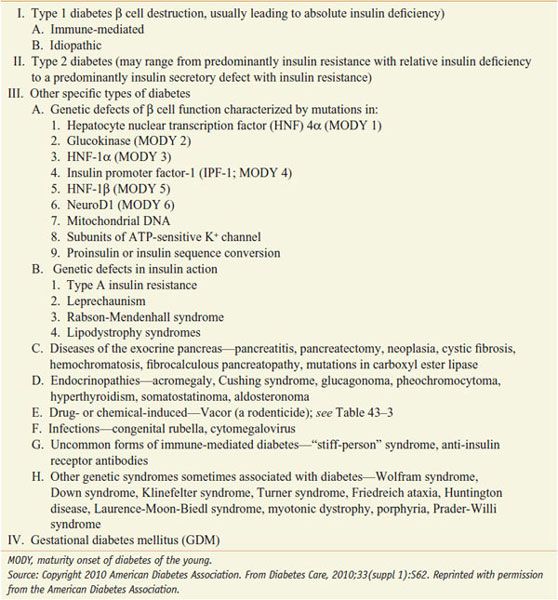
The 4 categories of diabetes include type 1 diabetes, type 2 diabetes, other forms of diabetes, and gestational diabetes (Table 43–2). Although hyperglycemia is common to all forms of diabetes, the pathogenic mechanisms leading to diabetes are quite distinct.
Table 43–2
Different Forms of Diabetes Mellitus
SCREENING FOR DIABETES AND CATEGORIES OF INCREASED RISK OF DIABETES. Many individuals with type 2 diabetes are asymptomatic at the time of diagnosis, and diabetes is often found on routine blood testing for nonglucose-related reasons. The ADA recommends widespread screening for type 2 diabetes of these individuals with the following features:
• >45 years of age, or
• Body mass index >25 kg/m2 with 1 of these additional risk factors: hypertension, low high-density lipoprotein, family history of type 2 diabetes, high-risk ethnic group (African American, Latino, Native American, Asian American, and Pacific Islander), abnormal glucose testing (IFG, IGT, A1c of 5.7-6.4%), cardiovascular disease, and women with polycystic ovary syndrome or who have previously delivered a large infant
Earlier diagnosis and treatment of type 2 diabetes should delay diabetes-related complications and reduce the burden of the disease. A number of interventions including pharmacological agents and lifestyle modification are effective. Screening for type 1 diabetes is not currently recommended.
PATHOGENESIS OF TYPE 1 DIABETES. Type 1 diabetes accounts for 5-10% of diabetes and results from autoimmune-mediated destruction of the β cells of the islet leading to total or near total insulin deficiency. Prior terminology included juvenile-onset diabetes mellitus or insulin-dependent diabetes mellitus. Type 1 diabetes resulting from autoimmune β cell destruction can occur at any age. Individuals with type 1 diabetes and their families have an increased prevalence of autoimmune diseases such as Addison disease, Graves and Hashimoto disease, pernicious anemia, vitiligo, and celiac sprue. The concordance of type 1 diabetes in genetically identical twins is 40-60%, indicating a significant genetic component. The major genetic risk (40-50%) is conferred by HLA class II genes encoding HLA-DR and HLA-DQ (and possibly other genes with the HLA locus). However, there clearly is a critical interaction of genetics and an environmental or infectious agent. Most individuals with type 1 diabetes (-75%) do not have a family member with type 1 diabetes, and the genes conferring genetic susceptibility are found in a significant fraction of the nondiabetic population.
Genetically susceptible individuals are thought to have a normal β cell number or mass until β cell–directed autoimmunity develops and β cell loss begins. The initiating or triggering stimulus for the autoimmune process is not known, but most favor exposure to viruses (enterovirus, etc.) or other ubiquitous environmental agents. The β cell destruction is cell mediated, and there is also evidence that infiltrating cells produce local inflammatory agents such as TNF-α, IFN-γ, and IL-1, all of which can lead to β cell death. The β cell destruction occurs over a period of months to years and when >80% of the β cells are destroyed, hyperglycemia ensues and the clinical diagnosis of type 1 diabetes is made. Most patients report several weeks of polyuria and polydipsia, fatigue, and often abrupt and significant weight loss. Some adults with the phenotypic appearance of type 2 diabetes (obese, not insulin-requiring initially) have islet cell autoantibodies suggesting autoimmune-mediated β cell destruction and are diagnosed as expressing latent-autoimmune diabetes of adults (LADA).
PATHOGENESIS OF TYPE 2 DIABETES. The condition is best thought of as a heterogeneous syndrome of dysregulated glucose homeostasis associated with impaired insulin secretion and action. Overweight or obesity is a common correlate of type 2 diabetes that occurs in -80% of affected individuals. For the vast majority of persons developing type 2 diabetes, there is no clear inciting incident; rather, the condition is thought to develop gradually over years with progression through identifiable prediabetic stages. Type 2 diabetes results when there is insufficient insulin action to maintain plasma glucose levels in the normal range. Insulin action is the composite effect of plasma insulin concentrations (determined by islet β cell function) and insulin sensitivity of key target tissues (liver, skeletal muscle, and adipose tissue). These sites of regulation are all impaired to variable extents in patients with type 2 diabetes (Figure 43–5). The etiology of type 2 diabetes has a strong genetic component. It is a heritable condition with a relative 4-fold increased risk of disease for persons having a diabetic parent or sibling, increasing to 6-fold if both parents have type 2 diabetes. Although more than 20 genetic loci with clear associations to type 2 diabetes have been identified through recent genome-wide association studies, the contribution of each is relatively small.
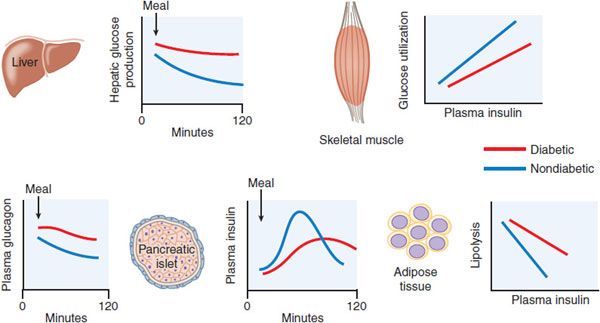
Figure 43–5 Pathophysiology of type 2 diabetes mellitus. Graphs show data from diabetic  and -nondiabetic
  patients, comparing postprandial insulin and glucagon secretion and hepatic glucose production, and the sensitivities of muscle glucose use and adipocyte lipolysis to insulin.
Impaired β Cell Function. In persons with type 2 diabetes, the sensitivity of the β cell to glucose is impaired, and there is also a loss of responsiveness to other stimuli such as insulinotropic GI hormones and neural signaling. This results in delayed secretion of insufficient amounts of insulin, allowing the blood glucose to rise dramatically after meals, and failure to restrain liver glucose release during fasting. The absolute mass of β cells also is greatly reduced in type 2 diabetes patients. Progressive reduction of β cell mass and function explains the natural history of type 2 diabetes in most patients who require steadily increasing therapy to maintain glucose control.
Type 2 diabetic patients frequently have elevated levels of fasting insulin, a result of their higher fasting glucose levels and insulin resistance. Another factor contributing to apparently high insulin levels early in the course of the disease is the presence of increased amounts of proinsulin. Proinsulin, the precursor to insulin, is inefficiently processed in the diabetic islet. Whereas healthy subjects have only 2-4% of total circulating insulin as proinsulin, type 2 diabetic patients can have 10-20% of the measurable plasma insulin in this form. Proinsulin has a considerably attenuated effect for lowering blood glucose compared to insulin.
Insulin Resistance. Insulin sensitivity is measured as the amount of glucose cleared from the blood in response to a dose of insulin. The failure of normal amounts of insulin to elicit the expected response is referred to as insulin resistance. There is inherent variability of insulin sensitivity among cells, tissues, and individuals. Insulin sensitivity is affected by many factors including age, body weight, physical activity levels, illness, and medications. Nonetheless, persons with type 2 diabetes or glucose intolerance have reduced responses to insulin and can easily be distinguished from groups with normal glucose tolerance.
The major insulin-responsive tissues are skeletal muscle, adipose tissue, and liver. Insulin resistance in muscle and fat is generally marked by a decrease in transport of glucose from the circulation. Hepatic insulin resistance generally refers to a blunted ability of insulin to suppress glucose production. Insulin resistance in adipocytes causes increased rates of lipolysis and release of fatty acids into the circulation, which can contribute to insulin resistance in liver and muscle, hepatic steatosis, and dyslipidemia. The sensitivity of humans to the effects of insulin administration is inversely related to the amount of fat stored in the abdominal cavity; more visceral adiposity leads to more insulin resistance. Intracellular lipid or its by-products may have direct effects to impede insulin signaling. Enlarged collections of adipose tissue, visceral or otherwise, are often infiltrated with macrophages and can become sites of chronic inflammation. Adipocytokines, secreted from adipocytes and immune cells, including TNF-α, IL-6, resistin, and retinol-binding protein 4, can also cause systemic insulin resistance.
Sedentary persons are more insulin resistant than active ones, and physical training can improve insulin sensitivity. Physical activity can decrease the risk of developing diabetes and improve glycemic control in persons who have diabetes. Insulin resistance is more common in the elderly; within populations, insulin sensitivity decreases linearly with age. At the cellular level, insulin resistance involves blunted steps in the cascade from the insulin receptor tyrosine kinase to translocation of GLUT4 transporters, but the molecular mechanisms are incompletely defined. There have been >75 different mutations in the insulin receptor discovered, most of which cause significant impairment of insulin action. These mutations affect insulin receptor number, movement to and from the plasma membrane, binding, and phosphorylation. Mutations involving the insulin binding domains of the extracellular α-chain cause the most severe syndromes. Insulin sensitivity is under genetic control but it is unclear whether insulin-resistant individuals have mutations in specific components of the insulin signaling cascade or whether they have a complement of signaling effectors that operate at the lower range of normal. Regardless, it is apparent that insulin resistance clusters in families and is a major risk factor for the development of diabetes.
Dysregulated Hepatic Glucose Metabolism. In type 2 diabetes, hepatic glucose output is excessive in the fasting state and inadequately suppressed after meals. Abnormal secretion of the islet hormones, both insufficient insulin and excessive glucagon, accounts for a significant portion of dysregulated hepatic glucose metabolism in type 2 diabetes. Increased concentrations of glucagon, especially in conjunction with hepatic insulin resistance, can lead to excessive hepatic gluconeogenesis and glycogenolysis and abnormally high fasting glucose concentrations. The liver is resistant to insulin action in type 2 diabetes. This contributes to the reduced potency of insulin to suppress hepatic glucose production and promote hepatic glucose uptake and glycogen synthesis after meals. Despite ineffective insulin effects on hepatic glucose metabolism, the lipogenic effects of insulin in the liver are maintained and even accentuated by fasting hyperinsulinemia. This contributes to hepatic steatosis and further worsening of insulin resistance.
PATHOGENESIS OF OTHER FORMS OF DIABETES. Mutations in key genes involved in glucose homeostasis cause monogenic diabetes, which is inherited in an autosomal dominant fashion. These fall in 2 broad categories: diabetes onset in the immediate neonatal period (<6 months of age) and diabetes in children or adults. Some forms of neonatal diabetes are caused by mutations in the SUR or its accompanying inward rectifying K+
Stay updated, free articles. Join our Telegram channel

Full access? Get Clinical Tree


