Chapter 28 Mitchell G. Scott, Ph.D., Vicky A. LeGrys, Ph.D., Dr.A., M.T.(A.S.C.P.), C.L.S.(N.C.A.) and Joshua L. Hood, M.D., Ph.D. Serum and plasma, obtained from blood collected by venipuncture into an evacuated tube, are the usual specimens analyzed for electrolytes. Capillary blood, collected in microsample tubes or capillary tubes, or applied directly from a fingerstick to some point-of-care devices, is another sample commonly analyzed. Heparinized whole blood arterial or venous specimens obtained for blood gas and pH determinations may also be used with direct ion-selective electrodes (ISEs). Differences in values between serum and plasma and between arterial and venous samples have been documented, but only the difference between serum and plasma K+ can be considered clinically significant. Heparin, either lithium or ammonium salt, is required if plasma or whole blood is assayed. Use of plasma or whole blood has the advantage of shortening turnaround time, because it is not necessary to wait for the blood to clot. Furthermore, plasma or whole blood provides a distinct advantage in determining K+ concentrations, which are invariably higher in serum depending on platelet count.42,72 Grossly lipemic blood can be a source of analytical error (see “Electrolyte Exclusion Effect”), with some methods making ultracentrifugation of lipemic serum or plasma necessary prior to analysis. Hemolysis of red blood cells will cause erroneously high K+ results; this problem is usually undetected when whole blood is analyzed. In addition, unhemolyzed specimens that are not promptly processed may have increased K+ concentrations because of K+ leakage from red blood cells when whole blood is stored at 4 °C. Sodium is the major cation of extracellular fluid. Because it represents approximately 90% of the ≈154 mmol of inorganic cations per liter of plasma, Na+ is responsible for almost one half the osmotic strength of plasma. It therefore plays a central role in maintaining the normal distribution of water and the osmotic pressure in the extracellular fluid compartment (ECF). The daily diet of the adult male in the United States contains 3 to 6 g (90 to 250 mmol) of Na+ (7 to 14 g of NaCl), which is nearly completely absorbed from the GI tract.84 The body requires only 1 to 2 mmol/d, and the excess is excreted by the kidneys, which are the ultimate regulators of the amount of Na+ (and thus water) in the body. Sodium is freely filtered by the kidney glomeruli. Seventy to 80% of the filtered Na+ load is then actively reabsorbed in the proximal tubules, with Cl− and water passively following in an iso-osmotic and electrically neutral manner. Another 20 to 25% is reabsorbed in the loop of Henle, along with Cl− and more water. In the distal tubules, interaction of the adrenal hormone aldosterone with the coupled Na+-K+ and Na+-H+ exchange systems results directly in the reabsorption of Na+, and indirectly of Cl−, from the remaining 5 to 10% of the filtered load. It is the regulation of this latter fraction of filtered Na+ that primarily determines the amount of Na+ excreted in the urine. These processes are discussed in detail in Chapter 48. Serum, plasma, and urine may be stored at 4 °C or may be frozen. Erythrocytes contain only one tenth of the Na+ present in plasma, so hemolysis does not cause significant errors in serum or plasma Na+ values. Lipemic samples should be ultracentrifuged and the infranatant analyzed unless a direct ISE is used (see “Electrolyte Exclusion Effect”). A typical reference interval for serum Na+ is 136 to 145 mmol/L.51 The central 95% of Na values from more than 16,000 subjects in the National Health and Nutrition Examination Survey III (NHANES III) was 136 to 146 mmol/L.54 The interval for premature newborns at 48 hours is 128 to 148 mmol/L, and the value for umbilical cord blood from full-term newborns is ≈127 mmol/L. Urinary sodium excretion varies with dietary intake, but for an adult male on an average diet containing 7 to 14 g of NaCl per day, an interval of 120 to 240 mmol/d is typical.84 A large diurnal variation in Na+ excretion has been noted, with the rate of Na+ excretion during the night being only 20% of the peak rate during the day. The Na+ concentration of cerebrospinal fluid is 136 to 150 mmol/L.94 Mean fecal Na+ excretion is less than 10 mmol/d.16 Factors that regulate distal tubular secretion of K+ include intake of Na+ and K+, mineralocorticoid concentration, and acid-base balance. Because renal conservation mechanisms are slow to respond, K+ depletion can be an early consequence of restricted K+ intake or loss of K+ by extrarenal routes such as diarrhea. A diminished glomerular filtration rate is typical of renal failure, and the consequent decrease in distal tubular flow rate is an important factor in the retention of K+ seen in chronic renal failure. Renal tubular acidosis (RTA) and metabolic and respiratory acidoses and alkaloses also affect renal regulation of K+ excretion. These topics are discussed in Chapters 48 and 49. Comments made earlier on specimens for Na+ analysis are generally applicable to those for K+ analysis. However, some additional points must be made. Potassium concentrations in plasma and whole blood are 0.1 to 0.7 mmol/L lower than those in serum, and most reference intervals for serum K+ are 0.2 to 0.5 mmol/L higher than those for plasma K+. The extent of this difference depends on the platelet count, because the additional K+ in serum is primarily a result of platelet rupture during coagulation.42,72 This variability in the amount of additional K+ in serum makes plasma the specimen of choice and emphasizes the necessity of noting on reports whether serum or plasma was assayed and using the appropriate reference interval. Specimens for determining K+ concentrations in serum or plasma must be collected by methods that minimize hemolysis, because release of K+ from as few as 0.5% of erythrocytes can increase K+ values by 0.5 mmol/L. An increase in K+ of 0.6% has been estimated for every 10 mg/dL of plasma hemoglobin caused by hemolysis.13 Thus slight hemolysis (Hb ≈50 mg/dL) can be expected to raise K+ values by ≈3%, marked hemolysis (Hb ≈200 mg/dL) by 12%, and gross hemolysis (Hb > 500 mg/dL) by as much as 30%. Several correction factors for estimating K+ in hemolyzed samples have been examined, but routine use of these is not recommended.65 Therefore it is imperative that any visible hemolysis be noted with reported K+ values with a comment that results are falsely elevated. If K+ concentrations are determined by ISE on whole blood specimens using a blood gas instrument or a point-of-care device, increases in K+ concentrations caused by hemolysis will often be overlooked. Whenever hemolysis is suspected, a portion of the specimen should be centrifuged and visually inspected. Clinically significant preanalytical errors can occur for K+ determinations if blood samples are not processed expediently.41 As mentioned earlier, maintenance of the intracellular-extracellular K+ gradient depends on the activity of the energy-dependent Na+-K+-ATPase. If a whole blood specimen is maintained at 4 °C versus 25 °C before separation, glycolysis is inhibited and the energy-dependent Na+-K+-ATPase cannot maintain the Na+/K+ gradient. An increase in plasma K+ will occur as a result of K+ leakage from erythrocytes and other cells. The increase of K+ in serum is on the order of 0.2 mmol/L by 1.5 hours at 25 °C, whereas at 4 °C, the increase is considerably greater and has been reported to be as much as 2 mmol/L after 4 hours at 4 °C.74 The opposite effect, namely, a falsely decreased K+ value, can be observed if an unseparated sample is stored at 37 °C, because glycolysis occurs and K+ shifts intracellularly. Even at room temperature, severe leukocytosis can initially cause falsely decreased K+ concentrations. The extent of this decrease depends on leukocyte count, temperature, and glucose concentrations but has been reported to be as much as 0.7 mmol/L at 37 °C.55 This effect is, however, biphasic. Initially, plasma K+ decreases as a result of glycolysis, but after the glucose substrate is exhausted, K+ will leak from cells. When the leukocyte count is greater than 100,000/µL and hypokalemia is present (as in acute myeloid leukemia), glycolysis at room temperature may cause the K+ deficit to seem greater than actuality.2 In addition to causing pseudohypokalemia,2 samples from leukemic patients with very high white blood cell counts (>300 × 109 cells/L) can result in a pseudohyperkalemia due to WBC rupture.1 Together, with the effect of glycolysis leading to increased cellular uptake of K+ followed by K+ leakage as a result of exhaustion of glucose, or inhibition of glycolysis by refrigeration, the recommendation for reliable K+ determinations is to collect blood with heparin and to maintain it near 25 °C, then to separate the plasma within minutes by high-speed centrifugation without cooling. In practical terms, separation within 1 hour when samples are maintained at room temperature is unlikely to introduce great error. Finally, skeletal muscle activity causes K+ efflux from muscle cells into plasma and can cause a marked elevation in plasma K+ values. A common example occurs when an upper arm tourniquet is not released before beginning to draw blood after a patient clenches his fist repeatedly. The plasma K+ values can artificially increase as much as 2 mmol/L because of the muscle activity.30 Reported reference intervals for the serum of adults vary from 3.5 to 5.1 mmol/L and from 3.7 to 5.9 for newborns. For plasma, a frequently cited interval is 3.4 to 4.8 mmol/L for adults. The central 95% of K+ values from more than 16,000 subjects in the NHANES III were from 3.4 to 4.7 mmol/L.54 Cerebrospinal fluid concentrations are ≈70% those of plasma.94 Urinary excretion of K+ varies with dietary intake, but a typical range observed in an average diet is 42 to 86 mmol/d for males and 33 to 70 mmol/d for females.84 Gastric juice contains K+ at ≈10 mmol/L. Fecal excretion has been reported as 18.2 ± 2.5 mmol/d, but in severe diarrhea, gastrointestinal loss may be as much as 60 mmol/d.16 Although AAS, FES, or spectrophotometric methods have been used for Na+ and K+ analyses in the past, most laboratories now use ISE methods. For example, in 2011, of the laboratories reporting proficiency data for Na+ and K+ to the College of American Pathologists (CAP), approximately 90 % were using ISE methods.15 Principle.: Samples are diluted in a diluent containing known amounts of lithium (or cesium, if lithium itself is being measured) and are aspirated into a propane-air flame. Sodium, potassium, lithium, and cesium ions, when excited, emit spectra with sharp, bright lines at 589, 768, 671, and 852 nm, respectively. Light emitted from the thermally excited ions is directed through separate interference filters to corresponding photodetectors. The Li+ or Cs+ emission signal is used as an internal standard against which the Na+ and K+ signals are compared. Details about reagents, procedures, and laboratory safety issues for flame photometry can be found in the third edition of this text.89 Analyzers fitted with ISEs usually contain Na+ electrodes with glass membranes and K+ electrodes with liquid ion-exchange membranes that incorporate valinomycin. Simply stated, potentiometry is the determination of change in electromotive force (E, potential) in a circuit between a measurement electrode (the ISE) and a reference electrode, as the selected ion interacts with the membrane of the ISE. In instrument applications, the measuring system is calibrated by the introduction of calibrator solutions containing defined amounts of Na+ and K+. The potentials of the calibrators are determined, and the ΔE/Δ log concentration responses are stored in microprocessor memory as a comparison for calculating unknown concentration when E of the unknown is measured. It is important to note that the response of potentiometric electrodes to analytes is a complex process that depends on the composition and thermodynamic and kinetic properties of the sensor membrane, bathing solution, and interface zone between membrane and analyte and between membrane and bathing solution.11 For simplicity, we classically describe E as the sum of the boundary potential (EPB1) at the (sample/ion-sensitive film boundary) and EPB2 at the (membrane/internal contact) boundary, and by the diffusion potential (ED) inside the membrane itself. A constant, C, is added to account for potential at the internal sensor/contact interface.11 Thus, we have the equation, E = EPB1 + ED + EPB2 + C. For simplicity, we typically assume that C and ED are zero. Thus, E = EPB1 + EPB2. This approximation is appropriate for most modern day electrodes, but the successful development of future solid state ion-selective electrodes (SS-ISEs) containing conducting polymers will require a newer approach to the complexity of E determinations. SS-ISEs are based on the covalent binding of ion recognition sites (metal complexing ligands) to a partially oxidized conductive polymer membrane, such as polypyrrole, where pyrrole nitrogens act as electron donors.67 Thus, ion-selective integration sites are directly coupled with the ion electron transducer (conductive polymer) on the electrode, eliminating internal filling solutions or gels.10 Development of SS-ISEs will allow for less electrode maintenance and electrode durability and miniaturization.11 This affords the possibly of constructing microscale or nanoscale sensors. Two types of ISE methods are in use and must be distinguished. With indirect ISE methods, the sample is introduced into the measurement chamber after mixing with a rather large volume of diluent. Indirect ISE methods are the methods used most commonly on today’s automated, high-throughput clinical chemistry systems. Indirect methods were developed early in the history of ISE technology, when dilution was necessary to present a small sample in a volume large enough to adequately cover a large electrode and to minimize the concentration of protein at the electrode surface. With direct ISE methods, the sample is presented to the electrodes without dilution. This approach became possible with the miniaturization of electrodes. Direct ISEs are most common in blood gas analyzers and point-of-care devices where whole blood is directly presented to the electrodes. Single-use, thin-film ISEs for Na+, K+, and Cl− are unique applications of a direct ISE method used by Ortho Vitros analyzers (Ortho Diagnostics, Raritan NJ).25 Errors observed in the use of ISEs fall into three categories. First are errors caused by lack of selectivity. For instance, many Cl− electrodes lack selectivity against other halide ions. Most chloride selective membranes use a quaternary ammonium chloride ion exchanger.73 Any ion that has a hydration energy equivalent to or higher than chloride can interfere with chloride selectivity. Examples include (1) iodide, (2) bromide, (3) thiocyanate, (4) bicarbonate, (5) salicylate, and (6) heparin. By far, bicarbonate is the most common interference, and its ionic activity is taken into account when the Nikolsky-Eisenman equation is used,73 when the electrical potential difference of the chloride electrode is calculated. Second are errors introduced by repeated protein coating of the ion-sensitive membranes, or by contamination of the membrane or salt bridge by ions that compete or react with the selected ion and thus alter the electrode response. Such errors in ISE measurements necessitate periodic changes of the membrane as part of routine maintenance. Finally, the electrolyte exclusion effect, which applies only to indirect methods and is caused by the solvent-displacing effect of lipid and protein in the sample, results in falsely decreased values.4 Spectrophotometric methods fall into three categories: those based on enzyme activation and those that detect the spectral shift produced when Na+ or K+ binds to a macrocyclic chromophore. These approaches have been applied to smaller instruments. However, the high cost of reagents for these methods and the fact that few problems exist with ISE methods have resulted in small “niche” use of these methods, primarily with smaller instruments used in physicians’ offices or clinics.83 Kinetic spectrophotometric assays for Na+ are based on activation of the enzyme β-galactosidase by Na+ to hydrolyze o-nitrophenyl-β-D-galactopyranoside.75 The rate of production of o-nitrophenol (the chromophore) is measured at 420 nm. K+-specific enzyme activation assays are illustrated by methods using tryptophanase,50 one of several K+-enhanced enzymes. Macrocyclic ionophores are molecules whose atoms are organized to form a cavity into which metal ions fit and bind with high affinity. Different macrocyclics can be made with cavities tailored to fit the ionic radii of different elements. When chromogenic properties are imparted to these ionophores, spectral shifts occur when the cation is bound. The specificity of many of these ionophores appears sufficient for clinical purposes.52 The electrolyte exclusion effect describes the exclusion of electrolytes from the fraction of the total plasma volume that is occupied by solids. The volume of total solids (primarily protein and lipid) in an aliquot of plasma is approximately 7%, so that ≈93% of plasma volume is actually water. The main electrolytes (Na+, K+, Cl−, Indirect ISE methods dilute the sample in a diluent of fixed high ionic strength so that for Na+, the activity coefficient approaches a value of 1. Under these circumstances, the measurement of activity, (a), where a = γ (concentration), and γ is the activity coefficient, is tantamount to measurement of concentration. It is the dilution of total plasma volume and the assumption that plasma water volume is constant that render both indirect ISE and flame photometry methods equally subject to the electrolyte exclusion effect. In certain settings, such as ketoacidosis with severe hyperlipidemia37 or multiple myeloma with severe hyperproteinemia,56 the negative exclusion effect may be so large that laboratory results lead clinicians to believe that electrolyte concentrations are normal or low when, in fact, the concentration in the water phase may be high or normal, respectively. In severe hypoproteinemia, the effect works in reverse, resulting in falsely high (2 to 4%) Na+ or K+ values. Plasma sodium, potassium, and chloride measurements by an indirect ISE were found to be affected by changes in plasma protein concentration when low plasma protein concentrations lead to an observed “pseudohyper” effect, and high plasma concentrations result in a “pseudohypo” effect.29 The relationship was found to be nonlinear with no ability to calculate an accurate predictive value between changes in plasma protein and electrolyte concentration. Most clinical chemists and physicians have reached the conclusion that direct ISE methods for electrolyte analysis are the methods of choice. They base their conclusion on the fact that great changes in plasma lipid or protein concentration can be expected in relatively common clinical conditions and in therapies such as parenteral alimentation with lipid emulsions. However, it is clear that results from direct methods will continue to be converted to total plasma volume concentrations by use of the “flame mode,” and indeed this is the recommendation of the Clinical Laboratory and Standard Institute (CLSI). This is also a good recommendation in that two thirds of laboratories still use indirect ISE methods.15 Tables 28-1 and 28-2 summarize methods that are and are not subject to electrolyte exclusion effects, respectively. One approach to improve the physiologic accuracy of electrolyte values from methods subject to the electrolyte exclusion effect consists of centrifugation (100,000 × g) and analysis of the chylomicron-poor infranatant.3 In situations in which both lipid and protein contents are altered, presenting plasma electrolyte values along with concurrent estimates of plasma water have been suggested. One approach to estimate plasma water (f) is Waugh’s empirical equation95: TABLE 28-1 TABLE 28-2 One of the earliest methods for determining Cl− in biological fluids is mentioned for historical purposes. A protein-free filtrate of specimen is titrated with mercuric nitrate solution in the presence of diphenylcarbazone as an indicator. Free Hg2+ combines with Cl− to form soluble but essentially nonionized mercuric chloride (HgCl2). Excess Hg2+ reacts with diphenylcarbazone to form a blue-violet color complex90 Reactions in coulometric-amperometric determinations of Cl− depend on the generation of Ag+ from a silver electrode at a constant rate and on the reaction of Ag+ with Cl− in the sample to form insoluble silver chloride (AgCl)26: Applications of the coulometric-amperometric principle (often called the Cotlove chloridometer technique)26 are the most precise methods for measuring Cl− over the entire range of concentrations found in body fluids. This method is subject to interferences by other halide ions, by CN− and SCN− ions, by sulfhydryl groups, and by heavy metal contamination. Maintenance of the systems is crucial for proper operation. Today, less than 1% of ≈5149 laboratories report Cl− results by using coulometry.15 However, some laboratories maintain these instruments as backups and for sweat analysis. Solvent polymeric membranes that incorporate quaternary ammonium salt anion exchangers, such as tri-n-octylpro-pylammonium chloride decanol, are used to construct Cl−-selective electrodes in clinical analyzers.73 Although they are by far the most common methods for measuring Cl− in clinical laboratories, these electrodes have been described to suffer from membrane instability and lot-to-lot inconsistency in terms of selectivity to other anions.73,93 Anions that tend to be problematic include other halides and organic anions, such as SCN−, which can be particularly problematic because of their ability to solubilize in the polymeric organic membrane of these electrodes. Approximately 82% of ≈5149 laboratories reporting in a 2008 CAP proficiency test survey for Cl− used indirect ISE methods.15 Reported reference intervals for Cl− in the serum or plasma vary from 98 to 107 mmol/L to 100 to 108 mmol/L. The central 95% of Cl− values from more than 16,000 subjects in NHANES III was 98 to 111 mmol/L.54 For neonates, the upper limit of the interval extends to 113 mmol/L. Serum values vary little during the day. Spinal fluid Cl− concentrations are ≈15% higher than those in serum.94 Urinary excretion of Cl− varies with dietary intake, but an interval of 110 to 250 mmol/d is typical. Fecal excretion of Cl− (for eight healthy subjects) has been reported as 3.2 ± 0.7 mmol/d (SEM).16 The same sample types used for Na+ or K+ may be assayed. Given a specimen in a vacuum-draw tube, the concentration of total CO2 is most accurately determined when the assay is done as promptly as possible after collection and centrifugation of the blood in the unopened tube. Ambient air contains far less CO2 than does plasma, and gaseous dissolved CO2 will escape from the specimen into the air, with a consequent decrease in the CO2 value of up to 4 to 5 mmol/L in the course of 1 hour.88 In practical terms, the logistics of high-volume processing and automated analysis of specimens almost ensures that most CO2 measurements are done on specimens that have lost some dissolved gaseous CO2, simply because preservation of anaerobic conditions is not practical between the time plasma is placed on an instrument and the time it is sampled. Thus the term bicarbonate may be preferable to total CO2. On the other hand, a sample that is rapidly processed and promptly analyzed has a much smaller error. One of the earliest methods for determining total CO2 was the manometric method for total CO2 content, using the Natelson microgasometer. This has been supplanted in clinical laboratories by automated methods. This method is described in some detail in an earlier edition of this text.90 The first step in automated methods is acidification or alkalinization of the sample. Acidifying the sample converts the various forms of CO2 in plasma to gaseous CO2 by dilution with an acid buffer. Alkalinizing the sample converts all CO2 and carbonic acid to Decreased absorbance of NADH at 340 nm is proportional to the total CO2 content. where Φ = osmotic coefficient, n = number of particles into which each molecule in the solution potentially dissociates, and C = molality in mol/kg H2O. A table of osmotic coefficients of most solutes of biological interest has been compiled.99 Glucose has an osmotic coefficient of 1.00, whereas the Φ for sodium chloride is 0.93 at the concentrations found in serum—thus the derivation of 1.86 × Na+ (mmol) in the formula to calculate plasma osmolality (NaCl potentially contributes two osmotically active particles times 0.93 = 1.86). Ethanol has an osmotic coefficient of 0.83.38 The total osmolality or osmotic pressure of a solution is equal to the sum of the osmotic pressures or osmolalities of all solute species present. The electrolytes Na+, Cl−, and Determination of plasma and urine osmolality can be useful in the assessment of electrolyte and acid-base disorders. Comparison of plasma and urine osmolalities can determine the appropriateness and status of water regulation by the kidneys in settings of severe electrolyte disturbances, as might occur in diabetes insipidus or the syndrome of inappropriate antidiuretic hormone (SIADH) (see Chapters 48 and 53). The major osmotic substances in normal plasma are Na+, Cl−, glucose, and urea; thus expected plasma osmolality can be calculated from the following empirical equation: The 9 mOsmol/kg added to the previous equation represents the contributions of other osmotically active substances in plasma, such as K+, Ca2+, and proteins, and 1.86 is two times the osmotic coefficient of Na+, reflecting the contributions of both Na+ and Cl−. Some versions of this equation does not include the plus 9 mOsmol/kg factor. The reference interval for plasma osmolality is 275 to 300 mOsmol/kg.87 Comparison of measured osmolality versus calculated osmolality can reveal the presence of an osmolal gap, which can be important in determining the presence of exogenous osmotic substances. Comparison of calculated and measured osmolalities can also confirm or rule out suspected pseudohyponatremia caused by the electrolyte exclusion effect. The instrument used is a freezing point depression osmometer, but it is often referred to simply as an osmometer. The components of a freezing point depression osmometer (Figure 28-2) are as follows: 1. A thermostatically controlled cooling bath or block maintained at −7 °C. 2. A rapid stir mechanism to initiate (“seed”) freezing of the sample. 3. A thermistor probe connected to a circuit to measure the temperature of the sample. (The thermistor is a glass bead attached to a metal stem whose resistance varies rapidly and predictably with temperature.) 4. A galvanometer that displays the freezing curve and that is used as a guide when the measuring potentiometer is used. where −1.86 °C is the molal freezing point depression of pure water. Day-to-day imprecision of ±2 mOsmol/kg H2O should be attainable by today’s osmometers. More than 98% of laboratories in the 2008 CAP surveys use freezing point depression osmometers.15 An important clinical difference between the vapor pressure technique and the freezing point depression osmometer is the failure of the former to include in its measurement of total osmolality any volatile solutes present in the serum. Substances such as ethanol, methanol, and isopropanol are volatile and thus escape from the solution and increase the vapor pressure instead of lowering the vapor pressure of the solvent (water). This makes the use of vapor pressure osmometers impractical for identifying osmolal gaps in acid-base disturbances (see Chapter 49), and use of this type of osmometer cannot be recommended for most clinical laboratories. Analysis of sweat for increased chloride concentration is used to confirm the diagnosis of cystic fibrosis (CF). CF is recognized as a syndrome with a wide spectrum of clinical presentations associated with a defect in the cystic fibrosis transmembrane conductance regulator protein (CFTR), a protein that normally regulates electrolyte transport across epithelial membranes. The genetics of CF is discussed in Chapter 40. More than 1600 mutations of CFTR have been identified.18 Although mutational analysis is available, it is not informative in all cases, and the sweat chloride test remains the standard for diagnostic testing.35 The U.S. Cystic Fibrosis Foundation (CFF) bases the diagnosis of CF on the following criteria35: 1. The presence of one or more characteristic phenotypic features. 2. Or a history of CF in a sibling. 3. Or a positive newborn screening test result. 4. And laboratory evidence of a CFTR abnormality as documented by elevated sweat chloride concentrations on two or more occasions; or identification of two CF-causing mutations; or demonstration of abnormal nasal epithelial ion transport. To provide appropriate care for CF patients and genetic counseling to their families, it is important that the diagnosis of CF be made accurately and promptly. Newborn screening (NBS) for CF, based on an elevated immunoreactive trypsinogen (IRT) and subsequent DNA mutational analysis or repeat IRT, is mandated throughout the United States. An infant identified by NBS as being at risk for CF must be followed with a sweat chloride test to confirm the diagnosis (Figure 28-3). This practice has led to testing of more infants younger than 1 month of age.
Electrolytes and Blood Gases
Electrolytes
Specimens for Electrolyte Determination
Sodium
Specimens
Reference Intervals87,91
Potassium
Specimens
Reference Intervals87
Methods for the Determination of Sodium and Potassium
Flame Emission Spectrophotometry
Ion-Selective Electrodes63
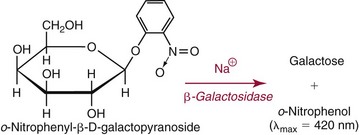
Spectrophotometric Methods
Electrolyte Exclusion Effect4
 ) are confined to the water phase. When a fixed volume of total plasma (e.g., 10 µL) is pipetted for dilution before flame photometry or indirect ISE analysis, only 9.3 µL of plasma water that contains the electrolytes is added to the diluent. Thus a concentration of Na+ determined by flame photometry or indirect ISE to be 140 mmol/L is the concentration in the total plasma volume, not in the plasma water volume. In fact, if the plasma contains 93% water, the concentration of Na+ in plasma water is [140 × (100/93)], or 150 mmol/L. This negative “error” in plasma electrolyte analysis has been recognized for many years.3 Even though it is the electrolyte concentration in plasma water that is physiologic (the Na+ concentration of normal saline is indeed 150 mmol/L), it was assumed that the volume fraction of water in plasma is sufficiently constant that this difference could be ignored. In fact, all electrolyte reference intervals are based on this assumption and actually reflect concentrations in total plasma volume and not in water volume. Indeed, virtually all concentrations measured in the clinical chemistry laboratory are related to the total sample volume rather than to the water volume. This electrolyte exclusion effect becomes problematic when pathophysiologic conditions are present that alter the plasma water volume, such as hyperlipidemia or hyperproteinemia. In these settings, falsely low electrolyte values are obtained whenever samples are diluted before analysis, as in flame photometry or with indirect ISE methods4 (Figure 28-1).
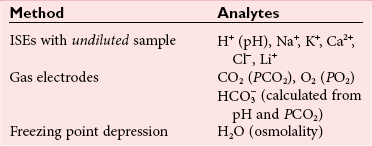
Method
Analytes
Flame photometry
Na+, K+, Li+
Atomic absorption spectrometry
Ca2+, Mg2+, and others
Amperometry/coulometry
Cl−
Indirect potentiometry
Na+, K+, Ca2+, Cl−

Chloride
Methods for Determination of Chloride in Body Fluids
Mercurimetric Titration
Coulometric-Amperometric Titration

Ion-Selective Electrode Methods
Reference Intervals51,91
Bicarbonate (Total Carbon Dioxide)
Specimens
Methods for Determination of Serum or Plasma Total Carbon Dioxide
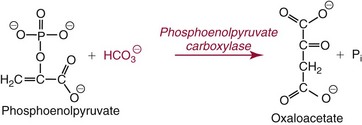
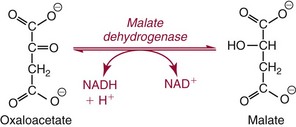
 . Methods for total CO2 measurement with today’s automated instruments may be electrode based or enzymatic. In indirect electrode-based methods, the amount of released gaseous CO2 after acidification is determined by a PCO2 electrode in the reaction chamber of the CO2 module. About 32% of laboratories reporting CAP data used an indirect ISE method in 2008.15 Direct ISE methods for total CO2 are no longer common on automated analyzers. Direct methods for total CO2 had problems with specificity and are no longer in use. For instance, one direct total CO2 electrode reacted almost equivalently with nitrate.27
Colligative Properties

 , which are present in relatively high concentrations, make the greatest contributions to serum osmolality. Nonelectrolytes such as glucose and urea, which are present normally at lower molal concentrations, contribute less, and serum proteins contribute less than 0.5% of the total serum osmolality because even the most abundant protein is present at millimolar concentrations.
Determination of Plasma and Urine Osmolality

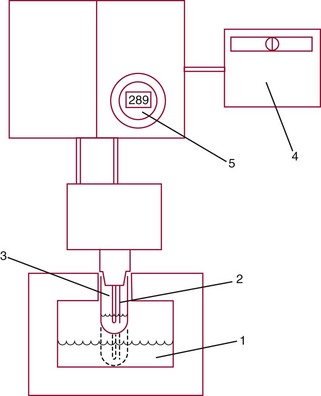
Freezing Point Depression Osmometer

Vapor Pressure Osmometer
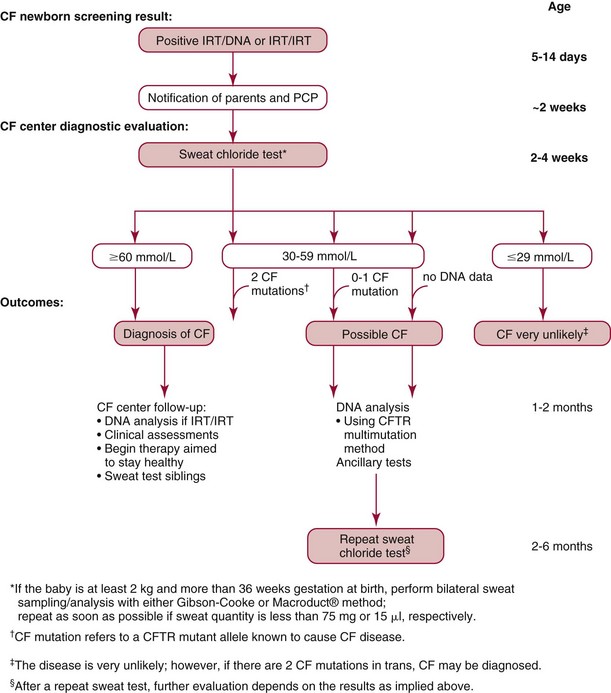
Sweat Testing
![]()
Stay updated, free articles. Join our Telegram channel

Full access? Get Clinical Tree


Basicmedical Key
Fastest Basicmedical Insight Engine
 . These electrolytes also have a role in acid-base balance and heart and muscle function, and serve as cofactors for enzymes. Virtually no metabolic process is independent or unaffected by electrolytes. Abnormal electrolyte concentrations may be the cause or the consequence of a variety of medical disorders. Because of their physiologic and clinical interrelationships, this chapter discusses determination of (1) electrolytes, (2) osmolality, (3) sweat testing, (4) blood gases and pH, and (5) blood oxygenation.
 ,
,  ,
,  , and
, and  , and some organic anions, such as lactate. Although amino acids and proteins in solution also carry an electrical charge, they are usually considered separately from electrolytes. Hydrogen ion (H+) concentration is routinely measured as pH, but its concentration is so low relative to other ions (10−9 vs. 10−3 mol/L) that for clinical purposes it is not categorized as an electrolyte. The major electrolytes (Na+, K+, Cl−,
  ) occur primarily as free ions, whereas significant amounts (>40%) of Ca2+, Mg2+, and trace elements are bound by proteins, mainly albumin. Determination of body fluid concentrations of the four major electrolytes (Na+, K+, Cl−, and
  ) is commonly referred to as an electrolyte profile.
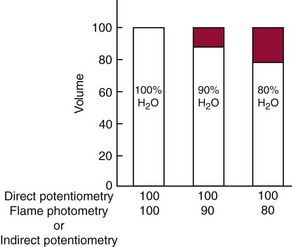
 . The enzymatic reactions are as follows: