(1)
Faculty of Life Sciences, Bar-Ilan University, Ramat-Gan, Israel
Keywords
In vivo monitoringMetabolic stateIn vivo versus in vitroVitality indexPatient monitoringIn this book, I tried to provide the reader with maximal information on the very challenging monitoring approach and system needed for patient monitoring. The central role of mitochondrial dysfunction in various human pathological processes was established and recognized by a large number of scientists active in the field of mitochondrial function. As of today there is a large and strong body of knowledge claiming that the next step in patient monitoring is to develop monitoring devices that will evaluate the tissue vitality of different organs in real time [1–3].
Although the monitoring of NADH fluorescence started many decades ago, the implementation of the technology into a medical device had started 10 years ago. In this chapter, I discuss a few issues that integrate some of the main subjects that are critical in the future of this technology.
One of the main questions is why monitoring of NADH fluorescence is the leading technology in monitoring mitochondrial function in vivo and in real time. It is clear that other electron carriers in the respiratory chain may have an advantage because they are localized only in the mitochondria. NADH appears in the cytosol, in addition to the mitochondria, and this point was discussed in Sect. 3.6. We have tried many options that will enable us to monitor flavoprotein (Fp) fluorescence together with NADH. It was found that Fp measurement is dramatically affected and sensitive to hemodynamic artifacts, and mainly to changes in hemoglobin oxygenation. Cytochrome oxidase monitoring suffers from the same problems because of overlapping with hemoglobin absorption spectrum. So, in the near future, NADH is the best candidate to monitor mitochondrial function in patients as well as in experimental animals.
10.1 From Isolated Mitochondria to Clinical Monitoring of NADH
The pioneer work of Chance, Williams, Connelly, and other collaborators, in the early 1950s, opened up new possibilities enabling the study of mitochondrial function in vitro, and later on in vivo monitoring became a reality [4–8]. The shift from studying mitochondrial NADH redox state in isolated mitochondria to higher cellular and tissue organization level started in the late 1950s [9]. The main breakthrough occurred in 1962, a year in which at least six papers described the in vivo monitoring of various organs in the anesthetized rat [10–15].
After more than 60 years of monitoring NADH fluorescence in many biological systems, two issues need our attention:
Can we extrapolate from the results obtained in monitoring of mitochondrial NADH in vitro to in vivo conditions?
Can we compare results obtained in animal models to events developed in patients?
Mitochondrial function and its metabolic states under in vivo condition are completely different from the definition made for isolated mitochondria by Chance and Williams in 1955. The main differences between the two situations are as follows:
1.
The isolated mitochondria are not interconnected to other intracellular organelles and components.
2.
The amount of oxygen available in the mitochondrial medium is not regulated by changes in blood flow or hemoglobin oxygenation under in vitro conditions.
3.
One of the largest oxygen or energy consumers, that is, the various ion pumps, are missing from the isolated mitochondria preparation.
4.
When ADP is added to state 4 mitochondria, ATP will be synthesized but will not be consumed in parallel as occurs under in vivo conditions.
5.
The isolated mitochondria preparation is not exposed to systemic changes in hemodynamic and other physiological parameters occurring in the organism.
In the classical table published in 1955 by Chance and Williams [7, 8], they show the relationship between the metabolic state and the level of NADH in the mitochondria (see Fig. 3.1). Of the five metabolic states defined in the table, two of them are in the physiological range and the other three described pathophysiological conditions developed in the cell or tissue.
The explanations given to the table in the original publication [4] are as follows:
States 2, 3, 4, and 5 are the states relevant to the present discussion and are described very briefly. State 2 is a ‘starved’ state in which ADP has been added to exhaust the endogenous substrate. Alternatively, the mitochondria are freed of endogenous substrate by any process that will increase the endogenous ADP level sufficiently to promote rapid respiration and exhaust the substrate. In addition, uncoupling agents soon lead to state 2. State 5, as is state 2, is characterized by zero respiration, but in this case oxygen is lacking, and instead of the components being oxidized, all those associated with the respiratory pathway are reduced, because reducing substrate was added to produce state 5. The ADP level will be high in state 5.
State 4 is an aerobic state characterized by a low respiration rate—a ‘resting’ state—even though substrate is present. Several components show large percentage reductions in this state, especially DPN. State 4 requires definite conditions for its establishment; mitochondria must be carefully prepared and be supplied with substrate and without phosphate acceptor.
State 3 is the ‘active’ state of rapid respiration and phosphorylation, with adequate supplies of substrate and phosphate acceptor.
Since 1962 a very large number of papers have described the use of NADH monitoring in intact animals exposed to a variety of physiological and pathological conditions. NADH was monitored in various animal models exposing most of the organs in the body to various perturbations (see Chap. 8). The interpretation of the results obtained in vivo is based on the “Chance and Williams” concepts defined for in vitro conditions [4]. The crucial question is could we interpret the in vivo data according to the concept developed for in vitro conditions.
Figure 10.1 illustrates the data interpretation dilemma. Figure 10.1a, b shows the spectra of NADH fluorescence measured in the isolated mitochondria and the responses to shifts in the metabolic state of the mitochondria. Figure 10.1c, d shows the response to anoxia measured from the intact rat brain in vivo under “state 4 to state 5” transition.

Fig. 10.1
The comparison between in vitro and in vivo monitoring of NADH fluorescence. The spectra in b was measured from isolated mitochondria (a) and the response of the intact brain to anoxia (c and d)
Can we compare and define the resting state (4) and active state (3) under in vivo situation to the in vitro definitions? As seen in Fig. 3.1, the maximal NADH level is achieved under complete O2 deprivation that can be induced under both in vitro and in vivo conditions, which signifies that this definitive point can be used to determine state 5 in vivo as well. As can be seen in the table (Fig. 3.1), the steady-state NADH level at state 4 is 99 %, that is, most of the NAD is in the reduced form, NADH. When the mitochondria are shifted to state 3, by adding ADP, the NADH becomes more oxidized and the NADH level is decreased to 53 % of the reduced form. Moving from state 4 to state 5, eliminating the oxygen from the media will have a very small effect on the NADH level, namely, changing from 99 % to 100 %. It is important to note that other members of the respiratory chain behave somewhat similarly to the NADH. When the mitochondria are shifted to state 2, NADH level is 0, because NAD is the dominant state in the absence of substrate.
The problem is to determine the ‘resting’ metabolic state of a tissue in an in vivo situation. If we adopt the in vitro value of a resting state (state 4), this would signify that the increase in NADH during state 5, induced by anoxia (0 % O2), would be only 1 %, that is, from 99 % to 100 %. According to all in vivo studies, this is not the case, and during anoxia the increase in NADH is much larger than the decrease under the state 4–state 3 transition.
When we started our monitoring of NADH redox state using fiber-optic-based fluorometry/reflectometry, we used the brain in vivo exposed to various conditions in real time. We found that the NADH level could either increase or decrease from the baseline level calibrated in the normoxic animal. The initial results were plotted against the perturbation used (shown on right side of Fig. 10.2).

Fig. 10.2
Comparison between the mitochondrial metabolic state, defined by Chance and Williams, and responses of the in vivo brain to changes in O2 supply and brain activation. (© American Physiological Society, reprinted with permission [26])
The relative changes in brain NADH under various perturbations were compared to the Chance and Williams definitions. Although the maximal level of NADH could be achieved in vivo by exposing the animal to anoxia (100 % nitrogen), the minimal level that could be monitored in vivo is very hard to achieve. We tried to build a scale between maximal and minimal level of NADH by exposing the brain to many types of perturbations. In the table, the horizontal lines represent the relative change in NADH recorded during the perturbation. The values are not accurate but rather are trying to map the scale of NADH changes. The question is how to locate the in vivo scale relative to the in vitro definition shown on the left side. According to the changes recorded, it seems that the so-called “resting brain” is not at state 4 (99 % NADH) but rather around 3.5. NADH will be increased by various factors such as anesthesia, hypoxia, and partial ischemia. Under complete ischemia or anoxia, NADH will reach its maximal level, state 5. Exposing the animal to hyperoxia or uncoupler led to decrease in NADH toward state 3. Activation of the brain by inducing seizures or cortical spreading depression led to a very large decrease in NADH. The main issue in the scaling or the responses is how to “push” the brain in vivo to minimal NADH levels. As of now it seems that this question remains open and unsolved.
Activation of the brain under conditions of restricted amount of oxygen, such as partial ischemia, will lead to increased NADH (reduction) instead of decreased (oxidation) as found in the normoxic brain. Those results found in various experimental conditions led to the dilemma. According to Chance and Williams, ATP production related to the state 4 to state 3 transition is always correlated to decrease or oxidation of NADH from 99 % to 53 %. The question is how ATP turnover could increase under NADH increase (reduction) and not decrease (oxidation). We want to make sure that the experimental results are not representing a technical artifact related to the monitoring itself. We assumed that by using appropriate modeling methods the dilemma could be clarified or resolved. Figure 7.59 [16] compares the response to spreading depression in the model calculated for the normoxic (Fig. 7.59a) and the partially ischemic (Fig. 7.59b) brain.
Now, I discuss the second issue mentioned earlier, namely, can we compare results obtained in animal models to events developed in patients? When a medical device for NADH monitoring is used as a diagnostic tool in patients, the user should compare the data to studies performed in animal models. There are differences in the structure of the fluorometer to be used in patients.
Figure 10.3a shows the initial fluorometer developed for animal monitoring as compared to the clinical environment, shown in Fig. 10.3b. The very dramatic shifts in the monitoring device between 1951 (Fig. 10.3c) and the one used in patients in the ICU (Fig. 10.3d) are presented.
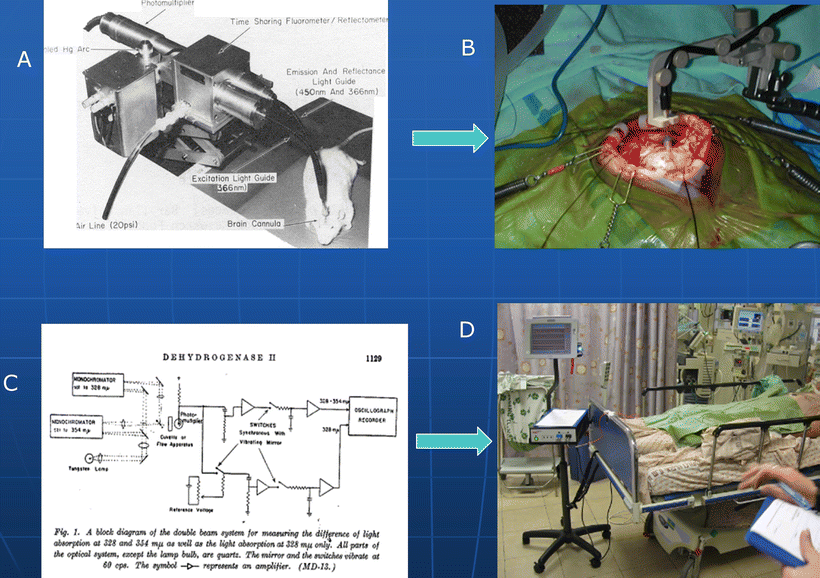
Fig. 10.3
Comparison between monitoring of NADH in animal model (a and c) and technological development in the monitoring devices (b and d)
As mentioned in the previous section, the responses to cortical spreading depression (CSD) in the normoxic and ischemic brain are different. Figure 10.4 presents the responses to SD in a rat model at the upper part and in patients at the lower part. When we induced SD in the animal study, we were sure about the oxygen supply to the animal. The blood supply to the brain decreased between Fig. 10.4a and Fig. 10.4b. The shift in response to SD from the normoxic (Fig. 10.4a) to the ischemic (Fig. 10.4b) state is clear, as discussed in Chap. 7. When we move to patient monitoring, we want to use the NADH trace as an indicator of the physiological state of the patient, or the brain in this example. As seen in the lower part, the two responses developed in the neurosurgical patients (Fig. 10.4c, d) are not the same: there are similarities between Fig. 10.4a and c as well as between Fig. 10.4b and d. Therefore, we concluded that the brain of the patient in state ‘c’ was probably normoxic whereas in ‘d’ the brain was partially ischemic. Indeed, this patient was deteriorating over time and finally brain death was determined. This example demonstrates that the basic pathophysiological events developed in patients are very similar to those monitored in animal models.

Fig. 10.4


Responses to cortical spreading depression measured in normoxic (a) and ischemic (b) brain in the rat. c, d Measurements in head-injured patient (see Chap. 9)
Stay updated, free articles. Join our Telegram channel
Full access? Get Clinical Tree
