Diabetes Mellitus
Benjamin J. Miller
Key Questions
• What are the differentiating characteristics of type 1 and type 2 diabetes?
• How do the pathophysiologic processes differ among the various types of diabetes?
• How is diabetes mellitus diagnosed, monitored, and managed?
• What are the acute and chronic complications of diabetes mellitus?
![]()
http://evolve.elsevier.com/Copstead/
The public health impact of diabetes mellitus is enormous. In the United States, nearly 25.8 million persons (8.3% of the population) have diabetes mellitus, although it is estimated that only 72% are aware of their diagnosis. Should this trend continue unabated, worldwide the number of persons with diabetes will rise to 366 million by 2015.1 The annual cost of diabetes to the U.S. medical care system was estimated to be $176 billion in 2007, with half of the total cost attributed to inpatient diabetes care.2 Diabetes mellitus is the seventh leading cause of death and a major cause of disability in the United States. It increases the risk for heart disease, end-stage renal disease, blindness, amputation, and complications of pregnancy. The disease disproportionately affects non-Caucasian and elderly individuals.3
Regulation of Glucose Metabolism
Because diabetes mellitus affects the utilization of all energy nutrients, it is helpful to review energy nutrient metabolism to understand the disease process of diabetes mellitus. The energy requirements of humans are predominantly met by glucose and fats. Produced from endogenous glycogen stores in the muscles and liver or manufactured from such substrates as amino acids and lactate, glucose is supplied to the bloodstream from the gastrointestinal tract and liver. Glucose is typically present in greater quantities in extracellular fluid than within cells.3
Cells are variously permeable to glucose, and the diffusion of glucose into them is accomplished by glucose transporters (GLUT 1-4) specific to each tissue. GLUT 1-3 transporters are insulin independent; they remain in the plasma membrane whether or not insulin is present. GLUT 1 is the major glucose transporter at the blood-brain barrier and GLUT 3 is the dominant glucose transport molecule for neurons. GLUT 2 is the primary glucose transporter in the liver and is present in small quantities in the pancreatic β cells.4 GLUT 1 and GLUT 3 are the predominant glucose transport molecules in the pancreatic β cells.5
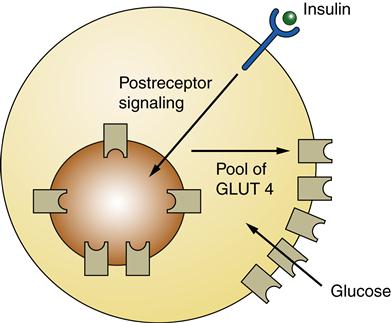
GLUT 4, found in muscle and adipose cells, is insulin dependent. In the absence of insulin GLUT 4 is sequestered in vesicles located within the cell. When insulin binds to insulin receptors, an intracellular signaling cascade occurs that causes the vesicles with GLUT 4 in their membranes to move (translocate) to the plasma membrane, enabling glucose entry into the muscle cell or adipocyte. When insulin no longer binds to its receptor, GLUT 4 is removed from the plasma membrane.4,6
Hormonal Regulation
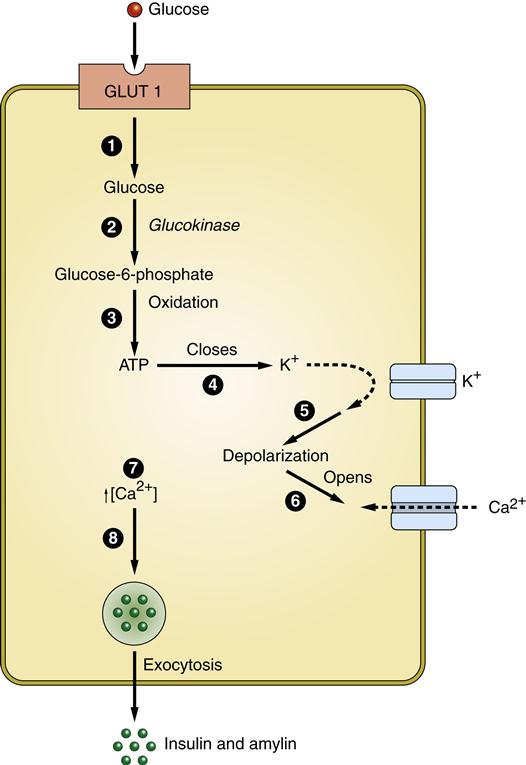
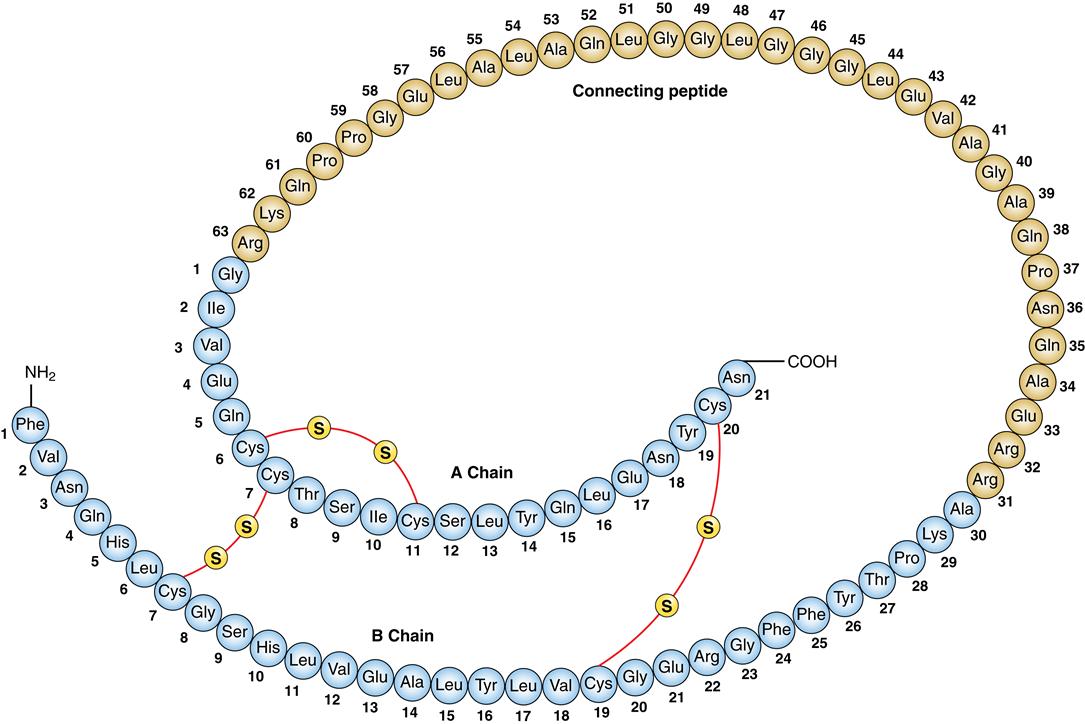
Protein and fat metabolism is regulated by the anabolic effects of insulin. Insulin is synthesized in the pancreas by the β cells of the islets of Langerhans. The islets are groups of cells dispersed throughout the pancreas. Within the islets can be found β cells that produce insulin in the form of proinsulin, α cells that produce glucagon, δ cells that produce somatostatin, and F cells that produce pancreatic polypeptide. The primary stimulus for release of insulin from the pancreatic β cells is glucose. Glucose enters the β cells by facilitated diffusion through GLUT 1 and GLUT 3 carriers in the plasma membrane (Figure 41-1). The concentration of glucose in the extracellular fluids determines how much enters the cell. Glucose within the β cell triggers a cascade of events that results in exocytosis of vesicles containing insulin (see Figure 41-1). Proinsulin is produced and packaged into vesicles along with enzymes that cleave proinsulin into insulin and C-peptide (Figure 41-2). Insulin binds to its receptor on insulin-sensitive cells and triggers glucose uptake through GLUT 4 carriers (Figure 41-3). These carriers are sequestered within the cell when insulin levels are low and then sent to the plasma membrane to transport glucose when insulin levels are higher. Insulin mediates other effects besides glucose uptake. Insulin appears to increase the uptake and to decrease the release of amino acids by skeletal muscle, thus inducing protein synthesis and preventing muscle breakdown. The amount of stored fats in the form of triglyceride is potentiated by the action of insulin in preventing fat breakdown and inducing lipid formation. Insulin also appears to have a role in growth by stimulating the secretion of insulin-like growth factor 1 (IGF-1, somatomedin).7
Normal glucose metabolism is usually described in reference to the fed and fasting (or absorptive and postabsorptive, respectively) states. The fed state occurs after ingestion of a meal and is characterized by utilization and storage of ingested energy nutrients. The fasting state is characterized by utilization of stored nutrients for the energy needs of the body.7
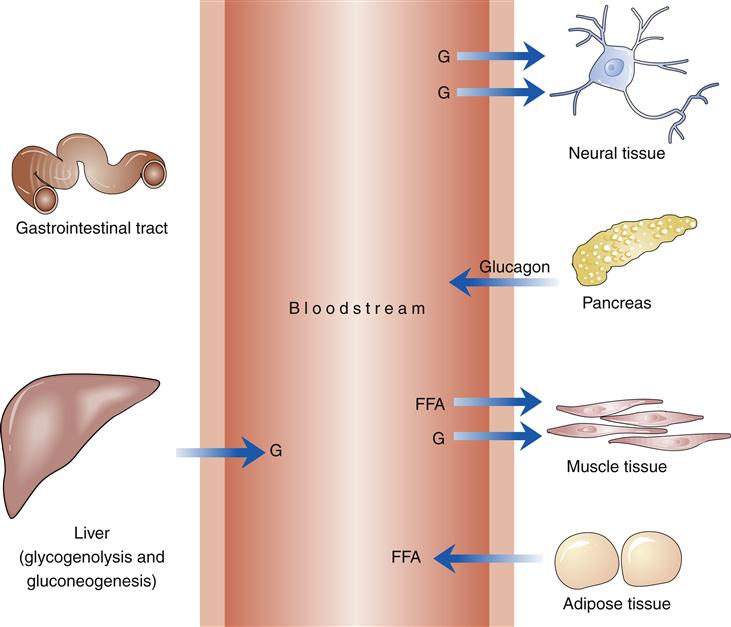
In the fed state, glucose from ingested food provides the primary energy source (Figure 41-4). The postprandial rise in blood glucose level and the presence of certain gastrointestinal hormones stimulate the production of insulin. Initial stimulation produces a brief rise in insulin secretion, termed the first phase. The continued presence of increased concentration of glucose produces the second phase of insulin secretion, a state characterized by insulin synthesis. Amylin is a peptide hormone produced by pancreatic β cells and cosecreted with insulin. Amylin acts upon the area postrema (AP) in the brain to inhibit gastric emptying, induce satiety, and prevent postprandial spikes in blood glucose levels.8–10 Suppression of glucagon release by amylin is from a paracrine effect within the pancreatic islets and does not require any participation by the area postrema.11
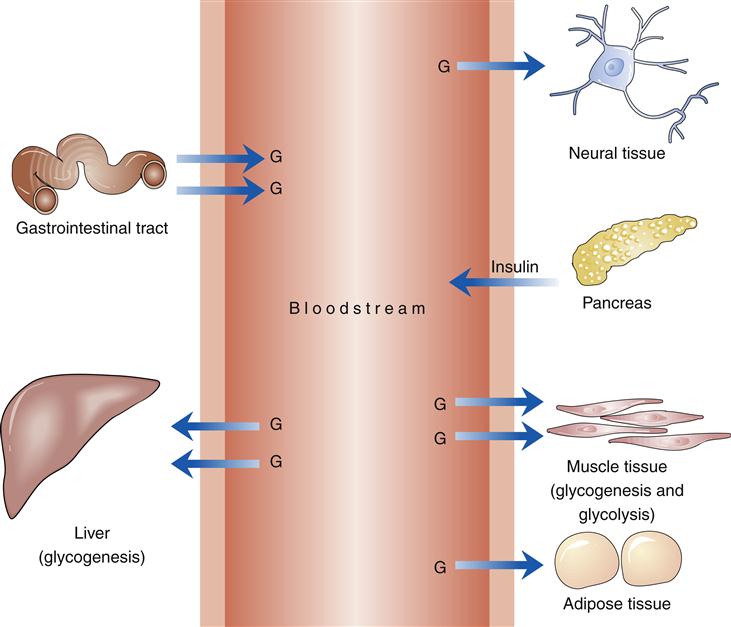
G, Glucose.
The ingestion of nutrients stimulates the release of incretin hormones, which include glucose-dependent insulinotropic polypeptide (GIP) and glucagon-like peptide 1 (GLP-1) from cells in the gut. Both hormones stimulate production of insulin in the presence of glucose, promote proliferation of β cells, and inhibit apoptosis. The presence of these hormones and their effect on blood glucose level is known as the incretin effect. With parenteral nutrition, the incretin effect is not observed. In addition, GLP-1 delays gastric emptying, inhibits glucagon production, and increases satiety.12
The presence of insulin stimulates the diffusion of glucose into adipose and muscle tissue and inhibits the production of glucose by the liver. After diffusion into the cell, glucose may be oxidized for the energy needs of the cell, a process termed glycolysis. Most ingested glucose is utilized in glycogenesis (production of glycogen in the muscle and the liver) (see Metabolic Syndrome section in Chapter 42).
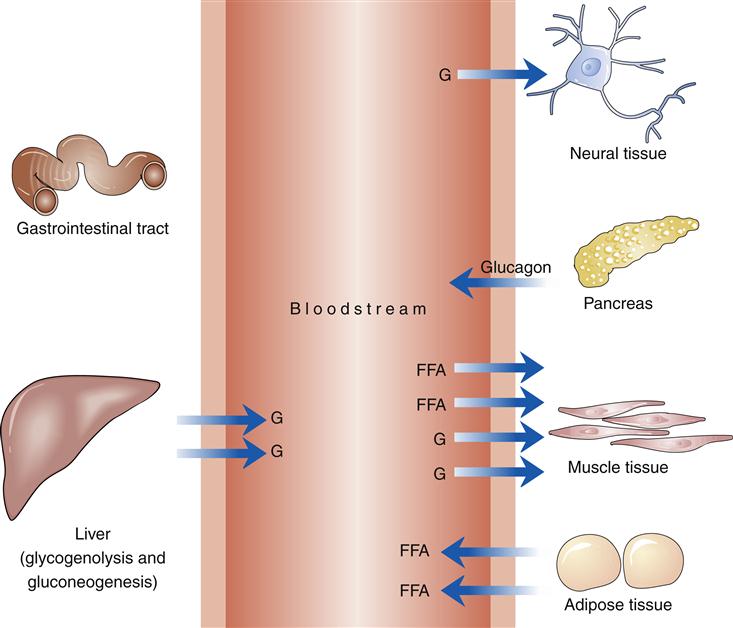
In the fasting state, glucose is produced by glycogenolysis (breakdown of stored glycogen) in the liver and muscles and by gluconeogenesis (production of glucose from amino acids and other substrates) in the liver (Figure 41-5). Insulin levels, no longer stimulated by an influx of ingested glucose, fall to a basal level. The catabolic effects of the absence of insulin are evident in the stimulation of glycogenolysis and are accompanied by a rise in glucagon levels. If insulin is the hormone that dominates the fed state, glucagon dominates the fasting state. Glucagon-stimulated glycogenolysis and gluconeogenesis are responsible for up to 75% of glucose production in the fasting state. The primary source of energy to muscle tissue in the fasting state is free fatty acids produced by lipolysis (breakdown of fat from adipose tissue). Lipolysis is stimulated by the decline in plasma insulin levels.13
Other hormones referred to as counter-regulatory hormones have a role in glucose metabolism in the fasting state. Corticosteroids stimulate gluconeogenesis and counteract the hypoglycemic action of insulin. Growth hormone increases peripheral insulin resistance and prevents insulin from suppressing hepatic glucose production. Catecholamines augment glucose production by prompting hepatic glycogenolysis and gluconeogenesis.13
Neural Regulation
There is a strong connection between the neural regulatory pathways and the enteric function of digestion, motility, secretion, absorption, and defense. Neural influences from the sympathetic and parasympathetic nervous system are directly involved with carbohydrate metabolism and glucose utilization.14 There are glucose-sensitive receptors in the brain, mouth, and pancreatic β cells and also in the hepatic portal vein. Once food is placed in the mouth, there is stimulation of the parasympathetic nervous system with stimulation of the β cells for insulin release. This is referred to as first-phase insulin release.14,15 Glucose-sensitive cells are located in many areas of the brain. These are activated by a decline in glucose levels (glucose-inhibited neurons [GI neurons]) or by a rise in glucose concentrations (glucose-excited neurons [GE neurons]). Under the control of the vagus pathway, the parasympathetic nervous system not only stimulates the release of insulin but also can influence the secretion activity and β-cell mass.15
Glucagon is predominantly regulated by the sympathetic nervous system in response to hypoglycemia. The hepatoportal vein contains glucose-sensitive nerve fibers; when stimulated they release norepinephrine and, along with epinephrine released from the adrenals, activate α cells to release glucagon.15,16
Exercise
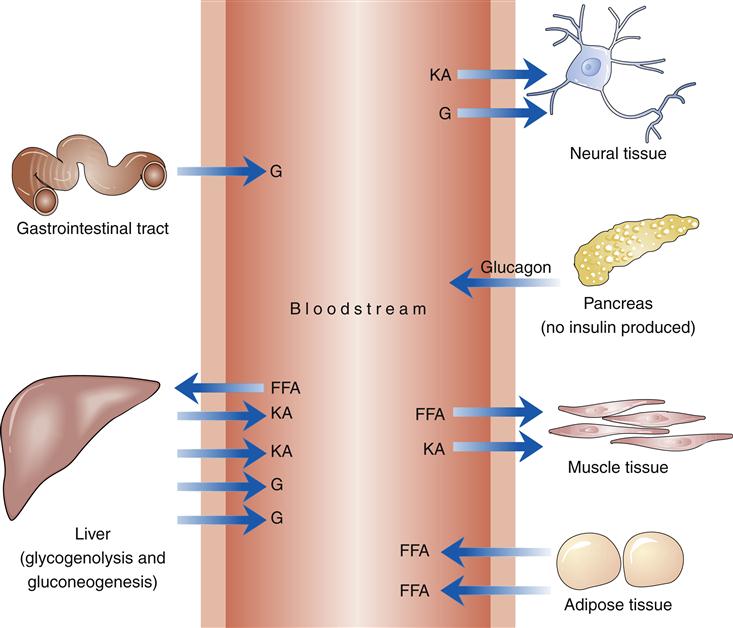
Increasing activity requires increased fuel for muscle tissue. At the onset of exercise, insulin levels drop and glucagon and catecholamine levels initially rise and increase the production of free fatty acids, the primary energy source of resting muscle (Figure 41-6). Falling insulin levels and increased glucagon levels stimulate glycogenolysis. Under the influence of catecholamines, muscle tissue shifts from using primarily fatty acids for fuel to using stored glycogen. The relative absence of insulin and the increased production of glucagon also stimulate hepatic glycogenolysis. Glucose released by the liver increasingly meets the energy needs of muscle tissue while exercise continues. After 10 to 40 minutes of exercise, blood glucose use by muscle tissue increases 7 to 20 times. The interactions of hormones thus produce the mixture of glucose and free fatty acids used by muscle tissue during exercise.13
Muscle tissue is affected not only by the influence of hormones but also by exercise itself. The resulting increase in insulin sensitivity can last as long as 16 hours. Thus in normal metabolism, increased insulin sensitivity allows normal blood glucose values in the presence of lower levels of circulating insulin.
Stress
During stress such as injury, illness, and pain, stress hormones, including corticosteroids and catecholamines, interact to ensure continuous supplies of glucose. Corticosteroids increase the production of glucose in the liver and elevate the production of glucagon. Glucocorticoids also decrease the utilization of glucose by muscle tissue by diminishing the effect of insulin on glucose transporters and by generating a decline in the number of insulin receptors and their function.
Catecholamines increase plasma glucagon levels, increase glucose production by the liver, and decrease the use of glucose by muscle and fat tissue. The production of fatty acids that is triggered by the action of catecholamines further inhibits glucose uptake in the periphery. The series of events produced by traumatic stress is referred to as stress hyperglycemia.13
Psychological stress can produce metabolic changes comparable with those of physical stress. Deterioration in metabolic control has been noted in stressed diabetic subjects. However, the response is by no means universal. An increase in blood glucose levels has frequently been observed during acute stress reflecting responses to psychological stress (e.g., disordered eating).17
Glucose Intolerance Disorders
Classification of Glucose Intolerance Disorders
Diabetes mellitus is not a single disease entity; as many as 30 different disorders may be called diabetes. Criteria for diagnosing the different conditions, all associated with glucose intolerance, were established by the Expert Committee on the Diagnosis and Classification of Diabetes Mellitus in 2011.18
Classifications include two pre-diabetes classes and four clinical classes (Box 41-1). Pre-diabetes classes are impaired glucose tolerance and impaired fasting glucose tolerance. The four clinical classes are type 1 diabetes mellitus, type 2 diabetes mellitus, other specific types of diabetes mellitus, and gestational diabetes mellitus.
Pre-Diabetes
Impaired Glucose Tolerance and Impaired Fasting Glucose Tolerance
Guidelines for diagnosing the categories of impaired glucose tolerance (IGT) and impaired fasting glucose tolerance (IFG) are listed in Box 41-2. Impaired glucose tolerance and IFG are intermediate stages between normal glucose metabolism and the onset of diabetes. The pathophysiology of pre-diabetes is complex with a distinct relationship of elevated glucose levels and the development of insulin resistance. Glucose release is stimulated by the mass of metabolically active tissues, including fat free mass and fat mass. The signals to stimulate gluconeogenesis are greater than the counter-regulatory effects, resulting in hepatic insulin resistance.19
When glucose levels remain high, the fat-free tissues such as muscle become supersaturated with glucose and start to down-regulate the glucose transporters, accelerating systemic insulin resistance.19–21
Diabetes Mellitus
Type 1 Diabetes Mellitus
Type 1 diabetes mellitus (type 1 DM) is, by definition, characterized by destruction of the β cells of the pancreas. Type 1 diabetes can occur at any age but peaks at the ages of 2, 4-6, and 10-14 years of age. Type 1 diabetes accounts for 10% of all diabetes and affects 1.4 million people in the United States and approximately 10 to 20 million people globally.22–24 The incidence is 1 in every 300 to 600 children and adolescents. Caucasian populations are more susceptible to type 1 diabetes mellitus than are African-American, Hispanic, Asian, or Native American populations. Little difference is noted in the incidence of type 1 diabetes mellitus in children younger than age 15.23,24 However, more men than women are affected in the population.24
Etiology
The two forms of type 1 diabetes are type 1A immune-mediated diabetes, which is the most common, and type 1B idiopathic, which is rare. Immune-mediated type 1A can be further delineated into three subcategories. Polygenic type 1 diabetes involves two or more genetic loci and accounts for 80% to 90% of type 1 cases. Monogenic causes of type 1 diabetes are rare and associated with IPEX syndrome (immune dysfunction, polyendocrinopathy, enteropathy, X-linked). The final subgroup of type 1 diabetes is latent autoimmune diabetes in adults (LADA).25 LADA is linked to the development of T-cell reactivity to islet antigens and autoantibodies to glutamic acid decarboxylase 65 (GADA65). LADA accounts for 2% to 12% of all cases of diabetes and is typically diagnosed after the age of 35. Often initially misdiagnosed as type 2 diabetes, LADA involves destruction of the pancreatic β cells, resulting in insulinopenia.25–27
Type 1A diabetes is the result of an autoimmune attack on the β cells of the pancreas. A strong association with the presence of a gene or genes in the major histocompatibility complex on chromosome 6 has been observed. Genes in the major histocompatibility complex (MHC) are responsible for the creation of cell-surface proteins (human leukocyte antigens, or HLAs) influencing the lymphocytes to stimulate or suppress antibody production. Recent evidence demonstrates that two primary loci (DR and DQ) confer a genetic predisposition whereas other loci may have a protective effect on the development of type 1 diabetes mellitus.25,28
Viral infection or exposure to a toxic agent may be the responsible environmental influence for triggering the autoimmune process in susceptible individuals. The immune system activation is a complex process of antigen recognition (please see Chapter 9 for a detailed explanation).
The etiologic progression of type 1B diabetes mellitus is not known. Idiopathic diabetes is associated with β-cell destruction without autoimmune markers or HLA association.
Pathogenesis and clinical manifestations
Type 1A diabetes is the result of destruction of the pancreatic β cells. The process is mediated by macrophages and T lymphocytes with detectable autoantibodies to various β cells. The T lymphocytes infiltrate the islets and destroy the β cells through the secretion of cytokines (CD4 cells) and direct cytotoxic action (CD8 cells). The preclinical β-cell autoimmunity is variable and precedes the clinical diagnosis. Specific antibodies that develop against glutamic acid decarboxylase 65 (GADA65), insulinoma-antigen 2 (IA-2), or insulin frequently appear early in the onset of immune-mediated diabetes. Antibodies may be present for as long as 13 years before diagnosis and the order of antibody appearance is not significant; however, the presence of multiple antibodies is highly predictive of type 1A diabetes.23 The presence of these antibodies results in the destruction of the pancreatic β cells. The presence of hyperglycemia indicates that autoimmune destruction of β cells has reached the point at which insulin secretion is inadequate.29
Type 1A and 1B diabetes mellitus is characterized by an absolute insulin deficiency, and thus glucose cannot enter muscle and adipose tissue (Figure 41-7). Production of glucose by the liver is no longer opposed by insulin. Overproduction of glucagon by pancreatic α cells stimulates glycogenolysis and gluconeogenesis. Plasma blood glucose levels rise. When the maximal tubular absorptive capacity of the kidney is exceeded, glucose is lost in the urine, and the resulting glycosuria and osmotic fluid loss eventually lead to profound hypovolemia. Tissues dependent on insulin for glucose transport do not have glucose available as a substrate. Neural tissue in the brain responds to this emergency by promoting eating behavior. The increased thirst (polydipsia), increased urination (polyuria), and increased hunger (polyphagia) resulting from the aforementioned processes are the classic symptoms of diabetes.13
Type 2 Diabetes Mellitus
Etiology
Individuals with type 2 diabetes mellitus are resistant to the action of insulin on peripheral tissues. Type 2 diabetes mellitus affects 90% to 95% of individuals with diabetes in the United States. Non-Caucasian and elderly populations are disproportionately affected. The prevalence of diabetes is 7.1% in the non-Hispanic white population, 12.6% in non-Hispanic blacks, and 11.8% in Hispanic/Latino-Americans. The age-adjusted prevalence of diabetes in Native American populations ranges from 5.5% among Alaska Native adults to 33.5% in American Indians in southern Arizona. Overall, close to 26.9% of American individuals older than 65 years have diabetes mellitus. In people under the age of 20, diabetes affects 25.6 million people in the United States or 11.3% of the population. The greatest at-risk population is adolescent Native Americans.3
Risk factors include aging and a sedentary lifestyle, but the most powerful predictor is obesity. Excessive abdominal (visceral) fat introduces a greater threat of diabetes mellitus (and cardiovascular disease) than does lower body obesity. The initial symptoms of polydipsia, polyuria, polyphagia, and weight loss may be subtle or absent in type 2 diabetic patients.3
Epidemiologic studies indicate a strong genetic component, but no specific human leukocyte antigen (HLA) type has been identified. Studies indicate that the prevalence of type 2 diabetes mellitus in identical twins when one twin is affected is close to 100%.30
Pathogenesis and clinical manifestations
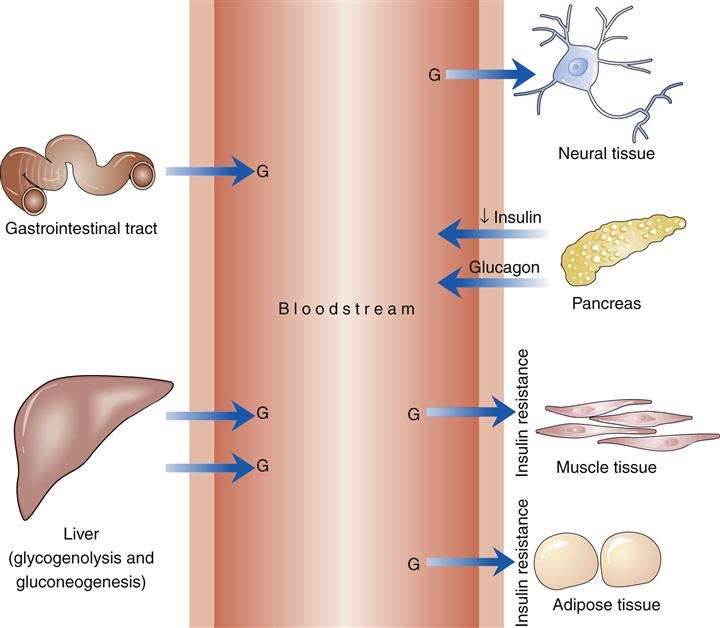
Type 2 diabetes is characterized by a relative lack of insulin. The processes instrumental in producing the relative lack of insulin are insulin resistance and β-cell dysfunction (Figure 41-8).3,30
The insulin resistance of type 2 diabetes mellitus is defined as a requirement for more insulin for the same biological action, along with lowered glucose utilization at all levels of insulin concentration. A decreased number of insulin receptors and such postreceptor defects as decreased action of glucose transporters are associated with insulin resistance. Impaired glycogen synthesis may also be a factor in the development of type 2 diabetes.31 Impaired production of insulin by the pancreatic β cells that intensifies as the disease progresses is also present in type 2 diabetes mellitus. Individuals with type 2 diabetes mellitus ultimately have an absent first-phase insulin response and a diminished second-phase response.
Basal insulin secretion may be higher than normal in type 2 diabetes. Glucagon secretion is increased absolutely or relatively (relative to insulin levels). The incretin effect, stimulation of insulin secretion by GLP-1 and GIP, is diminished in type 2 diabetes.12,30 Individuals with type 2 diabetes may be predominantly insulin resistant or predominantly insulin deficient.
Type 2 diabetes mellitus is a progressive disease characterized by the development of insulin resistance, at first compensated by increased insulin production and hyperinsulinemia. Decompensation occurs as the impaired β cells are unable to produce sufficient insulin to overcome insulin resistance. Insulin levels, however, remain elevated above normal until later in progression of the disease. Relatively decreased insulin levels, continued insulin resistance, and hyperglucagonemia result in the hyperglycemia of diabetes. Hyperglycemia itself may then increase insulin resistance and further diminish insulin secretion. The latter process has been termed glucose toxicity.30
Other Specific Types of Diabetes
• Genetic defects in insulin action: The disorders listed in Box 41-1 result in relatively rare, genetically determined defects of the insulin receptor.
• Diseases of the exocrine pancreas: Diseases of the pancreas can affect the insulin-producing capability of the organ (see Box 41-1).
• Endocrinopathies: Excessive production of insulin antagonists (e.g., cortisol, growth hormone, glucagon, and epinephrine) affects glucose metabolism (see Box 41-1).
• Drug- or chemical-induced diabetes: Many chemicals can affect the ability of the pancreas to produce insulin (see Box 41-1).
• Infections: Destruction of the β cells of the pancreas has been linked to various infectious agents (see Box 41-1).
• Uncommon forms of immune-mediated diabetes: Certain autoimmune disorders are linked to glucose intolerance (see Box 41-1).
• Other genetic syndromes sometimes associated with diabetes: Certain genetic syndromes are linked to glucose intolerance (see Box 41-1).
Gestational Diabetes Mellitus
Gestational diabetes mellitus (GDM) is by definition a disorder of glucose intolerance of variable severity with onset or first recognition during pregnancy. Approximately 4% (may range from 1% to 14% depending on population) of pregnancies are affected by gestational diabetes. GDM represents 90% of all pregnancies complicated by diabetes.18
Etiology
In its pathophysiologic characteristics, gestational diabetes mellitus closely resembles type 2 diabetes mellitus. As in type 2 diabetes, tissue insulin resistance is present during normal pregnancy. Insulin resistance in normal pregnancy is most likely precipitated by the presence of placental hormones: human chorionic somatomammotropin, estrogen, and cortisol. The weight gain of pregnancy is also responsible for an increase in insulin resistance. During pregnancy, women require two to three times as much insulin as they do in the nonpregnant state. Women with gestational diabetes are unable to produce sufficient insulin to meet their needs during pregnancy.18
Risk factors for gestational diabetes mellitus include severe obesity, history of gestational diabetes, previous offspring weighing more than 9 lb at birth, presence of glycosuria, or a strong family history of type 2 diabetes. High-risk individuals should be screened as soon as possible after confirmation of pregnancy. Because insulin needs rise sharply in the twenty-fourth to twenty-eighth weeks of pregnancy, it is recommended that all pregnant women older than 25 years be screened for gestational diabetes during the twenty-fourth to twenty-eighth weeks with either 50 or 100 grams (g) of oral glucose. Younger pregnant women who are obese, have a first-degree relative with diabetes, are members of an ethnic/racial group with a high prevalence of diabetes (e.g., African American, Hispanic, Asian, Native American), have a history of abnormal glucose tolerance, or have a history of poor obstetric outcome should also be screened. If the venous plasma glucose concentration is 140 mg/dl or greater with 50 g of glucose, an oral glucose tolerance test is performed using 100-g load (Table 41-1).32 Untreated gestational diabetes can result in metabolic abnormalities and stillbirth. However, the most common complications of gestational diabetes are macrosomia and neonatal hypoglycemia. Macrosomia (birth weight greater than 4000 g or >90% for gestational age) is a result of increased glucose, free fatty acids, and amino acids delivered to the fetus. Neonatal hypoglycemia is due to increased production of insulin by the fetal pancreas in response to the chronic stimulation of hyperglycemia while in utero.33,34
TABLE 41-1
DIAGNOSIS OF GDM WITH A 100- OR 75-g GLUCOSE LOAD∗
| 100-g GLUCOSE LOAD | 75-g GLUCOSE LOAD | |
| Fasting | 95 mg/dl | 95 mg/dl |
| 1 hour | 180 mg/dl | 180 mg/dl |
| 2 hours | 155 mg/dl | 155 mg/dl |
| 3 hours | 140 mg/dl | ∗∗ |
∗Two or more blood glucose level determinations must be equal to or greater than these values to establish the diagnosis. The test should be done in the morning after an overnight fast of between 8 and 14 hours and after at least 3 days of unrestricted diet (150 g of carbohydrate per day) and unlimited physical activity. The subject should remain seated and should not smoke throughout the test.
Data from American Diabetes Association: Diagnosis and classification of diabetes mellitus, Diabetes Care 34(suppl 1):S62-S69, 2011.
Treatment
Management of gestational diabetes mellitus includes education regarding appropriate dietary choices, implementation of an exercise regimen, and observation of blood glucose and urine ketone levels. If hyperglycemia persists, insulin therapy should be initiated. Only glyburide does not cross the placenta to cause fetal hypoglycemia; this sulfonylurea may be used in gestational diabetes mellitus.32,33
Glucose tolerance will return to normal after parturition in 97% of women with gestational diabetes mellitus. Women with gestational diabetes mellitus have a markedly increased risk for the development of type 2 diabetes mellitus or impairment in glucose tolerance later in life, especially within the first 5 years postpartum.34 In subsequent pregnancies, recurrence varies between 30% and 84% in women with a history of gestational diabetes mellitus.35
Screening for Diabetes
Because of the high prevalence of undiagnosed type 2 diabetes mellitus, current recommendations are to screen all adults older than age 45 for diabetes at least every 3 years. There is some controversy regarding screening individuals with asymptomatic disease. Individuals with risk factors should be screened at more frequent intervals (Box 41-3).32
