Chapter 16 Critical care medicine
Introduction
Critical care medicine (or ‘intensive care medicine’) is concerned predominantly with the management of patients with acute life-threatening conditions (’the critically ill’) in specialized units. As well as emergency cases, such units admit high-risk patients electively after major surgery (Table 16.1). Intensive care medicine also encompasses the resuscitation and transport of those who become acutely ill, or are injured in the community. Management of seriously ill patients throughout the hospital (e.g. in coronary care units, acute admissions wards, postoperative recovery areas or emergency units), including critically ill patients who have been discharged to the ward (‘outreach care’), is also undertaken. Teamwork and a multidisciplinary approach are central to the provision of intensive care and are most effective when directed and coordinated by committed specialists.
Table 16.1 Some common indications for admission to intensive care
General aspects of managing the critically ill
Recognition and diagnosis of critical illness
Early recognition and immediate resuscitation are fundamental to the successful management of the critically ill. In order to facilitate identification of ‘at risk’ patients on the ward and early referral to the critical care emergency or outreach team a number of early warning systems have been devised (e.g. the Modified Early Warning Score, MEWS; see Box 16.1). These are based primarily on bedside recognition of deteriorating physiological variables and can be used to supplement clinical intuition. A MEWS score of ≥5 is associated with an increased risk of death and warrants immediate admission to ICU. Another example of a system used to trigger referral to a Medical Emergency Team (MET) is also shown in Box 16.1 (see also ‘Management of shock and sepsis’ and ‘Clinical assessment of respiratory failure’, below).
 Box 16.1
Early warning systems for referral of ‘at risk’ patients to the critical care team
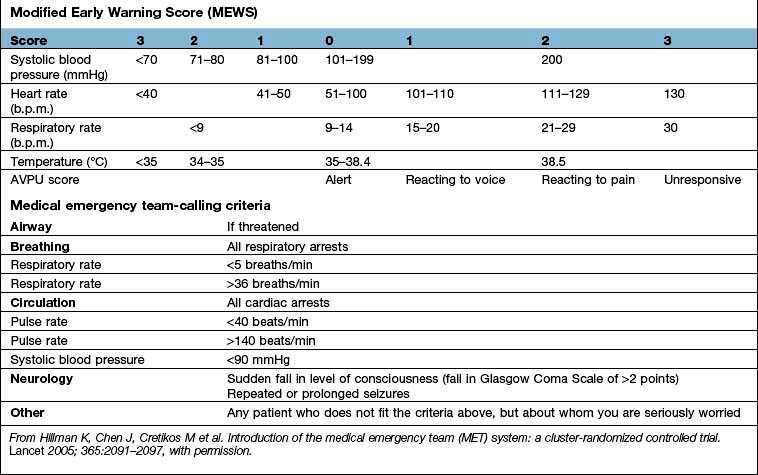
Medical emergency team-calling criteria
Airway | If threatened |
Breathing | All respiratory arrests |
Respiratory rate | <5 breaths/min |
Respiratory rate | >36 breaths/min |
Circulation | All cardiac arrests |
Pulse rate | <40 beats/min |
Pulse rate | >140 beats/min |
Systolic blood pressure | <90 mmHg |
Neurology | Sudden fall in level of consciousness (fall in Glasgow Coma Scale of >2 points) |
| Repeated or prolonged seizures |
Other | Any patient who does not fit the criteria above, but about whom you are seriously worried |
From Hillman K, Chen J, Cretikos M et al. Introduction of the medical emergency team (MET) system: a cluster-randomized controlled trial. Lancet 2005; 365:2091–2097, with permission.
In some of the most seriously ill patients, the precise underlying diagnosis is initially unclear but in all cases, the immediate objective is to preserve life and prevent, reverse or minimize damage to vital organs such as the lungs, brain, kidneys and liver. This involves a rapid assessment of the physiological derangement followed by prompt institution of measures to support cardiovascular and respiratory function in order to restore perfusion of vital organs, improve delivery of oxygen to the tissues and encourage the removal of carbon dioxide and other waste products of metabolism (following the ABC approach: Airway, Breathing, Circulation, see Fig. 16.25, below). The patient’s condition and response to treatment should be closely monitored throughout. The underlying diagnosis may only become clear as the results of investigations become available, a more detailed history is obtained and a more thorough physical examination is performed. In practice resuscitation, assessment and diagnosis usually proceed in parallel.
Critically ill patients require multidisciplinary care with:
 Intensive skilled nursing care (usually 1 : 1 or 1 : 2 nurse/patient ratio in the UK).
 Specialized physiotherapy including mobilization and rehabilitation.
 Management of pain and distress with judicious administration of analgesics and sedatives (see p. 893).


 Care of the mouth, prevention of constipation and of pressure sores.
 Nutritional support (see p. 222). Protein energy malnutrition is common in critically ill patients and is associated with muscle wasting, weakness, delayed mobilization, difficulty weaning from ventilation, immune compromise and impaired wound healing. There is also an association between malnutrition and increased mortality. It is therefore recommended that nutritional support should be instituted as soon as is practicable in those unable to meet their nutritional needs orally, ideally within 1–2 days of the acute episode. Enteral nutrition, which is less expensive, preserves gut mucosal integrity, is more physiological and is associated with fewer complications, is preferred. Recently, the value of early feeding has been questioned, apart from giving small amounts to ensure gut viability. Parenteral nutrition is sometimes indicated at a later stage for those unable to tolerate or absorb enteral nutrition and should be initiated without delay, at least within 3 days. Persistent attempts at enteral nutrition in those with gastrointestinal intolerance leads to underfeeding and malnutrition.
 Critically ill patients commonly require intravenous insulin infusions, often in high doses, to combat hyperglycaemia and insulin resistance (see p. 1006). Although the use of intensive insulin therapy to achieve ‘tight glycaemic control’ (blood glucose level between 4.4 and 6.1 mmol/L) was shown to improve outcome (at least when combined with aggressive nutritional support), more recent studies have failed to confirm this finding and have indicated that this approach is associated with an unacceptably high incidence of hypoglycaemia, and possibly an increase in mortality. Current recommendations suggest that blood glucose levels should be maintained at <8–10 mmol/L.
FURTHER READING
Casaer MP, Mesotten O, Hermans G et al. Early versus late parenteral nutrition in critically ill adults. N Engl J Med 2011; 365:506–517.
The NICE-SUGAR Study Investigators. Intensive versus conventional glucose control in critically ill patients. N Engl J Med 2009; 360:1293–1297.
Ziegler TR. Parenteral nutrition in the critically ill patient. N Engl J Med 2009; 361:1088–1097.
Applied cardiorespiratory physiology
Oxygen delivery and consumption
Oxygen delivery (DO2) (Fig. 16.1) is defined as the total amount of oxygen delivered to the tissues per unit time. It is dependent on the volume of blood flowing through the microcirculation per minute (i.e. the total cardiac output,  ) and the amount of oxygen contained in that blood (i.e. the arterial oxygen content, CaO2). Oxygen is transported both in combination with haemoglobin and dissolved in plasma. The amount combined with haemoglobin is determined by the oxygen capacity of haemoglobin (usually taken as 1.34 mL of oxygen per gram of haemoglobin) and its percentage saturation with oxygen (SO2), while the volume dissolved in plasma depends on the partial pressure of oxygen (PO2). Except when hyperbaric oxygen is administered, the amount of dissolved oxygen in plasma is insignificant.
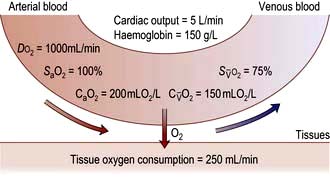
 , mixed venous oxygen content;
  , mixed venous oxygen saturation; CaO2, arterial oxygen content.
Oxygenation of the blood
Oxyhaemoglobin dissociation curve
The saturation of haemoglobin with oxygen is determined by the partial pressure of oxygen (PO2) in the blood, the relationship between the two being described by the oxyhaemoglobin dissociation curve (Fig. 16.2). The sigmoid shape of this curve is significant for a number of reasons:
 Modest falls in the partial pressure of oxygen in the arterial blood (PaO2) may be tolerated (since oxygen content is relatively unaffected) provided that the percentage saturation remains above 92%.


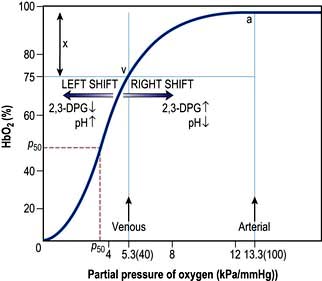
Figure 16.2 The oxyhaemoglobin dissociation curve. a, arterial point; v, venous point; x, arteriovenous oxygen content difference. HbO2 (%) is the percentage saturation of haemoglobin with oxygen. The curve will move to the right in the presence of acidosis (metabolic or respiratory), pyrexia or an increased red cell 2,3-DPG concentration. For a given arteriovenous oxygen content difference, the mixed venous PO2 will then be higher. Furthermore, if the mixed venous PO2 is unchanged, the arteriovenous oxygen content difference increases and more oxygen is off-loaded to the tissues (see p. 374). P50 (the PO2 at which haemoglobin is half saturated with O2) is a useful index of these shifts – the higher the P50 (i.e. shift to the right), the lower the affinity of haemoglobin for O2.
 .
.Alveolar oxygen tension (PAO2)
The partial pressures of inspired gases are shown in Figure 16.3. By the time the inspired gases reach the alveoli they are fully saturated with water vapour at body temperature (37°C), which has a partial pressure of 6.3 kPa (47 mmHg) and contain CO2 at a partial pressure of approximately 5.3 kPa (40 mmHg); the PAO2 is thereby reduced to approximately 13.4 kPa (100 mmHg).
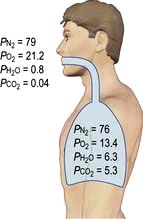
The clinician can influence PAO2 by administering oxygen or by increasing the barometric pressure.
Pulmonary gas exchange
In normal subjects there is a small alveolar-arterial oxygen difference (PA–aO2). This is due to:


Pathologically, there are three possible causes of an increased PA–aO2 difference:
 Diffusion defect. This is not a major cause of hypoxaemia even in conditions such as lung fibrosis, in which the alveolar-capillary membrane is considerably thickened. Carbon dioxide is also not affected, as it is more soluble than oxygen.
 Right-to-left shunts. In certain congenital cardiac lesions or when a segment of lung is completely collapsed, a proportion of venous blood passes to the left side of the heart without taking part in gas exchange, causing arterial hypoxaemia. This hypoxaemia cannot be corrected by administering oxygen to increase the PAO2, because blood leaving normal alveoli is already fully saturated; further increases in PO2 will not, therefore, significantly affect its oxygen content. On the other hand, because of the shape of the carbon dioxide dissociation curve (Fig. 16.4), the high PCO2 of the shunted blood can be compensated for by over-ventilating patent alveoli, thus lowering the CO2 content of the effluent blood. Indeed, many patients with acute right-to-left shunts hyperventilate in response to the hypoxia and/or to stimulation of mechanoreceptors in the lung, so that their PaCO2 is normal or low.
 Ventilation/perfusion mismatch (see p. 796). Diseases of the lung parenchyma (e.g. pulmonary oedema, acute lung injury) result in
  mismatch, producing an increase in alveolar deadspace and hypoxaemia. The increased deadspace can be compensated for by increasing overall ventilation. In contrast to the hypoxia resulting from a true right-to-left shunt, that due to areas of low
  can be partially corrected by administering oxygen and thereby increasing the PAO2 even in poorly ventilated areas of lung.

 and saturation (
 )
) is the partial pressure of oxygen in pulmonary arterial blood that has been thoroughly mixed during its passage through the right heart. Assuming PaO2 remains constant,
  and
and  will fall if more oxygen has to be extracted from each unit volume of blood arriving at the tissues. A low
  therefore indicates either that oxygen delivery has fallen or that tissue oxygen requirements have increased without a compensatory rise in cardiac output. If
  falls, the effect of a given degree of pulmonary shunting on arterial oxygenation will be exacerbated. Thus, worsening arterial hypoxaemia does not necessarily indicate a deterioration in pulmonary function but might instead reflect a fall in cardiac output and/or a rise in oxygen consumption.
 and
and  may reflect impaired tissue oxygen extraction (due to microcirculatory dysfunction) and/or reduced oxygen utilization (e.g. due to mitochondrial dysfunction) as seen in severe sepsis (see below).
 ), rather than pulmonary artery blood is less invasive and has been shown to be a valuable guide to the resuscitation of critically ill patients (see
 Cardiac output
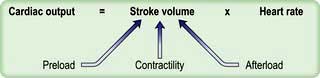
Cardiac output is the product of heart rate and stroke volume, and is affected by changes in either of these (see Fig. 16.5).
 ) and this may precipitate ischaemia in areas of the myocardium with restricted coronary perfusion. When the heart rate falls, a point is reached at which the increase in stroke volume is insufficient to compensate for bradycardia and again cardiac output falls.
Stroke volume
Three interdependent factors determine the stroke volume (see p. 671).
Preload
This is defined as the tension of the myocardial fibres at the end of diastole, just before the onset of ventricular contraction, and is therefore related to the degree of stretch of the fibres. As the end-diastolic volume of the ventricle increases, tension in the myocardial fibres is increased and stroke volume rises (Fig. 16.6). Myocardial oxygen consumption ( ) increases only slightly with an increase in preload (produced, for example, by a ‘fluid challenge’, see below) and this is therefore the most efficient way of improving cardiac output.
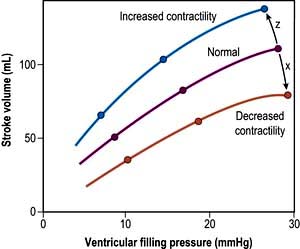
Myocardial contractility
This refers to the ability of the heart to perform work, independent of changes in preload and afterload. The state of myocardial contractility determines the response of the ventricles to changes in preload and afterload. Contractility is often reduced in critically ill patients, as a result of either pre-existing myocardial damage (e.g. ischaemic heart disease), or the acute disease process itself (e.g. sepsis). Changes in myocardial contractility alter the slope and position of the Starling curve; worsening ventricular performance is manifested as a depressed, flattened curve (Fig. 16.6 and Fig. 14.5). Inotropic drugs can be used to increase myocardial contractility (see below).
Afterload
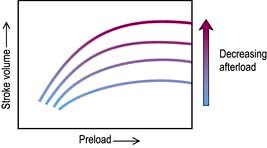
Decreasing the afterload (exercise, sepsis, vasodilator agents) can increase the stroke volume achieved at a given preload (Fig. 16.7), while reducing  . The reduction in wall tension also leads to an increase in coronary blood flow, thereby improving the myocardial oxygen supply/demand ratio. Excessive reductions in afterload will cause hypotension.
 . Right ventricular afterload is normally negligible because the resistance of the pulmonary circulation is very low but is increased in pulmonary hypertension.
Monitoring critically ill patients
Assessment of tissue perfusion
 Pale, cold skin, delayed capillary refill and the absence of visible veins in the hands and feet indicate poor perfusion. Although peripheral skin temperature measurements can help clinical evaluation, the earliest compensatory response to hypovolaemia or a low cardiac output, and the last to resolve after resuscitation is vasoconstriction in the splanchnic region.

 Urinary flow is a sensitive indicator of renal perfusion and haemodynamic performance.
Blood pressure
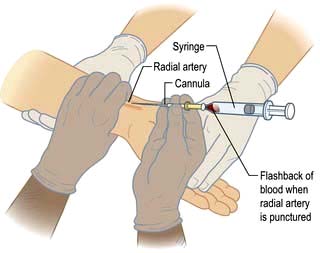
Hypotension jeopardizes perfusion of vital organs. The adequacy of blood pressure in an individual patient must always be assessed in relation to the premorbid value. Blood pressure is traditionally measured using a sphygmomanometer but if rapid alterations are anticipated, continuous monitoring using an intra-arterial cannula is indicated (Practical Box 16.1; Fig. 16.8).
 Practical Box 16.1
Radial artery cannulation
Technique
1. The procedure is explained to the patient and, if possible, consent obtained.
2. The arm is supported, with the wrist extended, by an assistant. (Gloves should be worn.)
3. The skin should be cleaned with chlorhexidine.
4. The radial artery is palpated where it arches over the head of the radius.
5. In conscious patients, local anaesthetic is injected to raise a weal over the artery, taking care not to puncture the vessel or obscure its pulsation.
6. A small skin incision is made over the proposed puncture site.
7. A small parallel-sided cannula (20 gauge for adults, 22 gauge for children) is used in order to allow blood flow to continue past the cannula.
8. The cannula is inserted over the point of maximal pulsation and advanced in line with the direction of the vessel at an angle of approximately 30°.
9. ‘Flashback’ of blood into the cannula indicates that the radial artery has been punctured.
10. To ensure that the shoulder of the cannula enters the vessel, the needle and cannula are lowered and advanced a few millimetres into the vessel.
11. The cannula is threaded off the needle into the vessel and the needle withdrawn.
12. The cannula is connected to a non-compliant manometer line filled with saline. This is then connected via a transducer and continuous flush device to a monitor, which records the arterial pressure.


Central venous pressure (CVP)
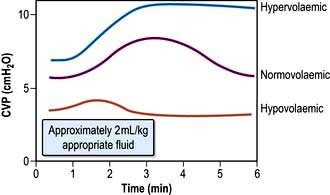
This provides a fairly simple, but approximate method of gauging the adequacy of a patient’s circulating volume and the contractile state of the myocardium. The absolute value of the CVP is not as useful as its response to a fluid challenge (the infusion of 100–200 mL of fluid over a few minutes) (Fig. 16.9). The hypovolaemic patient will initially respond to transfusion with little or no change in CVP, together with some improvement in cardiovascular function (falling heart rate, rising blood pressure, increased peripheral temperature and urine output). As the normovolaemic state is approached, the CVP usually rises slightly and reaches a plateau, while other cardiovascular values begin to stabilize. At this stage, volume replacement should be slowed, or even stopped, in order to avoid overtransfusion (indicated by an abrupt and sustained rise in CVP, often accompanied by some deterioration in the patient’s condition). In cardiac failure, the venous pressure is usually high; the patient will not improve in response to volume replacement, which will cause a further, sometimes dramatic, rise in CVP.
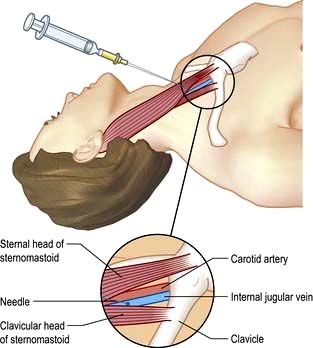
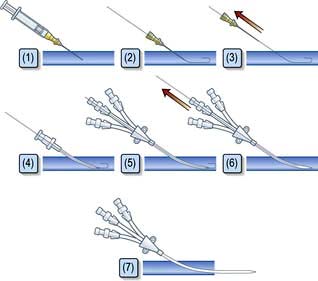
Central venous catheters are usually inserted via a percutaneous puncture of the subclavian or internal jugular vein using a guidewire technique (Practical Box 16.2; Figs 16.10, 16.11). The guidewire techniques can also be used in conjunction with a vein dilator for inserting multilumen catheters, double lumen cannulae for haemofiltration or pulmonary artery catheter introducers. The routine use of ultrasound to guide central venous cannulation reduces complication rates.
 Practical Box 16.2
Internal jugular vein cannulation
Technique
1. The procedure is explained to the patient and, if possible, consent obtained.
2. The patient is placed head-down to distend the central veins (this facilitates cannulation and minimizes the risk of air embolism but may exacerbate respiratory distress and is dangerous in those with raised intracranial pressure).
3. The skin is cleaned with an antiseptic solution such as chlorhexidine. Sterile precautions are taken throughout the procedure.
4. Local anaesthetic (1% plain lidocaine) is injected intradermally to raise a weal at the apex of a triangle formed by the two heads of sternomastoid with the clavicle at its base.
5. A small incision is made through the weal.
6. The cannula or needle is inserted through the incision and directed laterally downwards and backwards in the direction of the nipple until the vein is punctured just beneath the skin and deep to the lateral head of sternomastoid.
Ultrasound-guided puncture is recommended to reduce the incidence of complications.
7. Check that venous blood is easily aspirated.
8. The cannula is threaded off the needle into the vein or the guidewire is passed through the needle (see Fig. 16.11).
9. The CVP manometer line is connected to a manometer/transducer.
10. A chest X-ray should be taken to verify that the tip of the catheter is in the superior vena cava and to exclude pneumothorax.


The following are common pitfalls in interpreting central venous pressure readings:
 Blocked catheter. This results in a sustained high reading, with a damped or absent waveform, which often does not correlate with clinical assessment.
 Transducer wrongly positioned. Failure to level the system is a common cause of erroneous readings.

Left atrial pressure
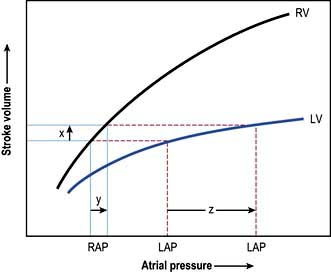
In uncomplicated cases, careful interpretation of the CVP provides a reasonable guide to the filling pressures of both sides of the heart. In many critically ill patients, however, there is a disparity in function between the two ventricles. Most commonly, left ventricular performance is worse, so that the left ventricular function curve is displaced downward and to the right (Fig. 16.12). High right ventricular filling pressures, with normal or low left atrial pressures, are less common but occur with right ventricular dysfunction and in cases where the pulmonary vascular resistance (i.e. right ventricular afterload) is raised, such as in acute respiratory failure and pulmonary embolism.
Pulmonary artery pressure
A ‘balloon flotation catheter’ enables reliable catheterization of the pulmonary artery. These ‘Swan–Ganz’ catheters can be inserted centrally (Fig. 16.10) or through the femoral vein, or via a vein in the antecubital fossa. Passage of the catheter from the major veins, through the chambers of the heart, into the pulmonary artery and into the wedged position is monitored and guided by the pressure waveforms recorded from the distal lumen (Practical Box 16.3; Fig. 16.13). A chest X-ray should always be obtained to check the final position of the catheter. In difficult cases, screening with an image intensifier may be required.
 Practical Box 16.3
Passage of a pulmonary artery balloon flotation catheter through the chambers of the heart into the ‘wedged’ position
Consent should be obtained if possible from the patient after explanation of the procedure.
Note: (a), (b), (c), (d) refer to Figure 16.13.
1. A balloon flotation catheter is inserted through a large vein (see text).
2. Once in the thorax, respiratory oscillations are seen. The catheter should be advanced further towards the lower superior vena cava/right atrium (a), where pressure oscillations become more pronounced. The balloon should then be inflated and the catheter advanced.
3. When the catheter is in the right ventricle (b), there is no dicrotic notch and the diastolic pressure is close to zero. The patient should be returned to the horizontal, or slightly head-up, position before advancing the catheter further.
4. When the catheter reaches the pulmonary artery (c) a dicrotic notch appears and there is elevation of the diastolic pressure. The catheter should be advanced further with the balloon inflated.
5. Reappearance of a venous waveform indicates that the catheter is ‘wedged’. The balloon is deflated to obtain the pulmonary artery pressure. The balloon is inflated intermittently to obtain the pulmonary artery occlusion (also known as pulmonary artery, or capillary, ‘wedge’) pressure (d).
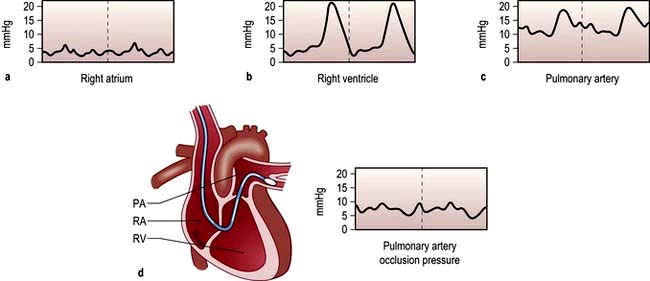
Figure 16.13 Passage of pulmonary artery balloon flotation catheter through the chambers of the heart into the ‘wedged’ position to measure the pulmonary artery occlusion pressure. (See Practical Box 16.3.)
 .
.Less invasive techniques for assessing cardiac function and guiding volume replacement
Arterial pressure variation as a guide to hypovolaemia
Systolic arterial pressure decreases during the inspiratory phase of intermittent positive pressure ventilation (p. 894). The magnitude of this cyclical variability has been shown to correlate more closely with hypovolaemia than other monitored variables, including CVP. Systolic pressure (or pulse pressure) variation during mechanical ventilation can therefore be used as a simple and reliable guide to the adequacy of the circulatory volume. The response to fluid loading can also easily be predicted by observing the changes in pulse pressure during passive leg raising.
Oesophageal Doppler
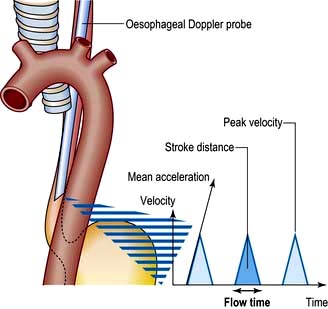
Stroke volume, cardiac output and myocardial function can be assessed non-invasively using Doppler ultrasonography. A probe is passed into the oesophagus to continuously monitor velocity waveforms from the descending aorta (Fig. 16.14). Although reasonable estimates of stroke volume, and hence cardiac output can be obtained, the technique is best used for trend analysis rather than for making absolute measurements. Oesophageal Doppler probes can be inserted quickly and easily and are particularly valuable for perioperative optimization of the circulating volume and cardiac performance in the unconscious patient. They are contraindicated in patients with oropharyngeal/oesophageal pathology.
Echocardiography
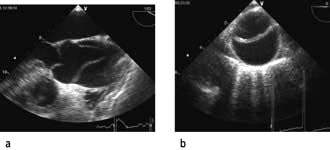
Echocardiography is being used increasingly often to provide immediate diagnostic information about cardiac structure and function (myocardial contractility, ventricular filling) in the critically ill patient. Transoesophageal echocardiography (TOE) is preferred because of its superior image clarity (Fig. 16.15).
Disturbances of acid–base balance
The physiology of acid–base control is discussed on page 660. Acid–base disturbances can be described in relation to the diagram illustrated in Figure 13.13, p. 663 (which shows PaCO2 plotted against arterial [H+]).
Blood gas and acid–base values (normal ranges) are shown in Table 16.2. (For blood gas analysis, see p. 891.)
Table 16.2 Arterial blood gas and acid–base values (normal ranges)
H+ | 35–45 nmol/L | pH 7.35–7.45 |
PO2 (breathing room air) | 10.6–13.3 kPa | (80–100 mmHg) |
PCO2 | 4.8–6.1 kPa | (36–46 mmHg) |
Base deficit | ±2.5 |
|
Plasma HCO3– | 22–26 mmol/L |
|
O2 saturation | 95–100% |
|
Respiratory acidosis. This is caused by retention of carbon dioxide. The PaCO2 and [H+] rise. A chronically raised PaCO2 is compensated by renal retention of bicarbonate, and the [H+] returns towards normal. A constant arterial bicarbonate concentration is then usually established within 2–5 days. This represents a primary respiratory acidosis with a compensatory metabolic alkalosis (see p. 666). Common causes of respiratory acidosis include ventilatory failure and COPD (type II respiratory failure where there is a high PaCO2 and a low PaO2, see p. 814).
Respiratory alkalosis. In this case, the reverse occurs and there is a fall in PaCO2 and [H+], often with a small reduction in bicarbonate concentration. If hypocarbia persists, some degree of renal compensation may occur, producing a metabolic acidosis, although in practice this is unusual. A respiratory alkalosis may be produced, intentionally or unintentionally, when patients are mechanically ventilated; it may also be seen with hypoxaemic (type I) respiratory failure (see Ch. 15, p. 817), spontaneous hyperventilation and in those living at high altitudes.
Metabolic acidosis (p. 664). This may be due to excessive acid production, most commonly lactate and H+ (lactic acidosis) as a consequence of anaerobic metabolism during an episode of shock or following cardiac arrest. A metabolic acidosis may also develop in chronic renal failure or in diabetic ketoacidosis. It can also follow the loss of bicarbonate from the gut or from the kidney in renal tubular acidosis. Respiratory compensation for a metabolic acidosis is usually slightly delayed because the blood–brain barrier initially prevents the respiratory centre from sensing the increased blood [H+]. Following this short delay, however, the patient hyperventilates and ‘blows off’ carbon dioxide to produce a compensatory respiratory alkalosis. There is a limit to this respiratory compensation, since in practice values for PaCO2 less than about 1.4 kPa (11 mmHg) are rarely achieved. Spontaneous respiratory compensation cannot occur if the patient’s ventilation is controlled or if the respiratory centre is depressed, for example by drugs or head injury.
Shock, sepsis and acute disturbances of haemodynamic function
Causes of shock
Abnormalities of tissue perfusion can result from:


The causes of shock are shown in Table 16.3. Often shock can result from a combination of these factors (e.g. in sepsis, distributive shock is frequently complicated by hypovolaemia and myocardial depression).
| Hypovolaemic | Obstructive |
|---|---|
Pathophysiology
The sympatho-adrenal response to shock (Fig. 16.16)
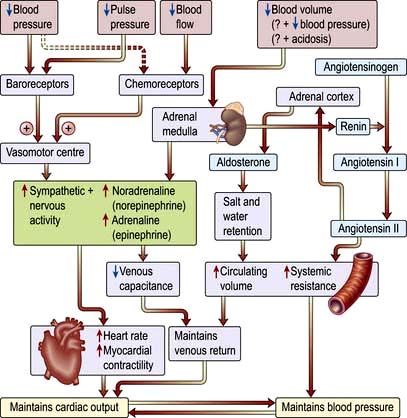
Reduction in perfusion of the renal cortex stimulates the juxtaglomerular apparatus to release renin. This converts angiotensinogen to angiotensin I, which in turn is converted in the lungs and by the vascular endothelium to the potent vasoconstrictor angiotensin II. Angiotensin II also stimulates secretion of aldosterone by the adrenal cortex, causing sodium and water retention (p. 566). This helps to restore the circulating volume (see p. 639).
Neuroendocrine response
 There is release of pituitary hormones such as adrenocorticotrophic hormone (ACTH), vasopressin (antidiuretic hormone, ADH) and endogenous opioid peptides. (In septic shock there may be a relative deficiency of vasopressin.)
 There is release of cortisol, which causes fluid retention and antagonizes insulin.
 There is release of glucagon, which raises the blood sugar level.
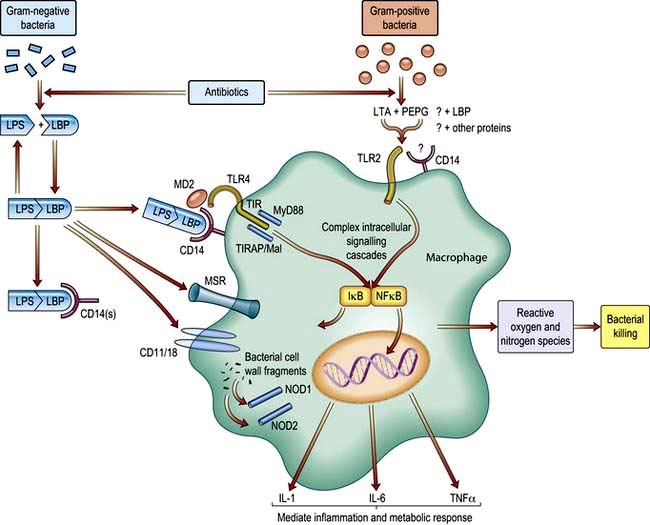
Release of pro- and anti-inflammatory mediators
Severe infection (often with bacteraemia or endotoxaemia), the presence of large areas of damaged tissue (e.g. following trauma or extensive surgery), hypoxia or prolonged/repeated episodes of hypoperfusion can trigger an exaggerated inflammatory response with systemic activation of leucocytes and release of a variety of potentially damaging ‘mediators’ (see also Ch. 3). Although beneficial when targeted against local areas of infection or necrotic tissue, dissemination of this ‘innate immune’ response can produce shock and widespread tissue damage. Characteristically the initial episode of overwhelming inflammation is followed by a period of immune suppression, which in some cases may be profound and during which the patient is at increased risk of developing secondary infections. It also seems that pro- and anti-inflammatory elements of the host response may co-exist.