Chapter 3 Clinical Pharmacokinetics and Issues in Therapeutics
| Abbreviations | |
|---|---|
| AUC | Area under the drug plasma concentration–time curve |
| Css | Steady-state concentration of drug |
| C(t) | Concentration of drug in plasma at any time “t” |
| CL | Clearance |
| CLp | Plasma clearance |
| E | Hepatic extraction ratio |
| F | Bioavailability |
| GI | Gastrointestinal |
| IA | Intraarterial |
| IM | Intramuscular |
| IV | Intravenous |
| Q | Hepatic blood flow |
| SC | Subcutaneous |
| t1/2 | Half-life |
| T | Dosing interval |
| TI | Therapeutic index |
| Vd | Apparent volume of distribution |
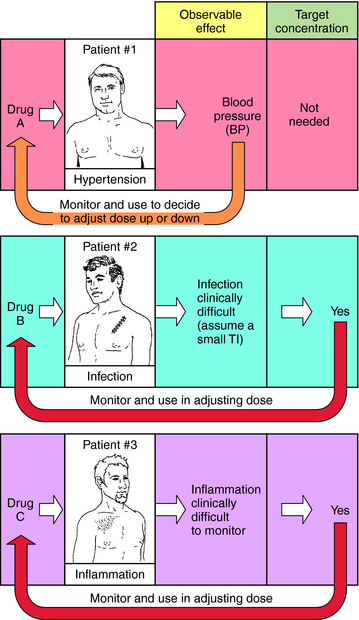
When planning drug therapy for a patient, deciding on the choice of drug and its dosing schedule is obviously critical. To make such decisions, an observable pharmacological effect is usually selected, and the dosing rate is manipulated until this effect is observed. This approach works quite well with some drugs. For example, blood pressure can be monitored in a hypertensive patient (Fig. 3-1, Drug A) and the dose of drug modified until blood pressure is reduced to the desired level. However, for other drugs this approach is more problematic, usually because of the lack of an easily observable effect, a narrow TI (ratio of therapeutic to toxic dose), or changes in the condition of the patient that require modification of dosing rate.
For example, when an antibiotic with a low TI is used to treat a severe infection (Fig. 3-1, Drug B), it can be difficult to quantify therapeutic progress, because a visible effect is not apparent immediately. Because of its narrow TI, care must be taken to ensure that the drug concentration does not become too high and cause toxicity. Similarly, if the desired effect is not easily visualized because of other considerations, such as inflammation in an internal organ, this approach is also problematic (Fig. 3-1, Drug C). Finally, changes in the condition of the patient can also necessitate adjustments in dose rates. For example, if a drug is eliminated through the kidneys, changes in renal function will be important. Without an observable effect that is easily monitored (as with drugs B and C), it is not always clear that such adjustments are beneficial.
schedule, and the mode and route of administration must be specified. Pharmacokinetic considerations have a major role in establishing the dosing schedule, or in adjusting an existing schedule, to increase effectiveness of the drug or to reduce symptoms of toxicity.
Major routes of administration are divided into (1) enteral, drugs entering the body via the gastrointestinal (GI) tract, and (2) parenteral, drugs entering the body by injection. Specific examples are given in Box 3-1. The oral route is most popular because it is most convenient. However, poor absorption in the GI tract, first-pass metabolism in the liver, delays in stomach emptying, degradation by stomach acidity, or complexation with food may preclude oral administration. Intramuscular (IM), subcutaneous (SC), and topical routes bypass these problems. In many cases absorption into the blood is rapid for drugs given IM and only slightly slower after SC administration. The advantage of the intravenous (IV) route is a very rapid onset of action and a controlled rate of administration; however, this is countered by the disadvantages of possible infection, coagulation problems, and a greater incidence of allergic reactions. Also, most injected drugs, especially when given IV, require trained personnel.
Single-Dose IV Injection and Plasma Concentration
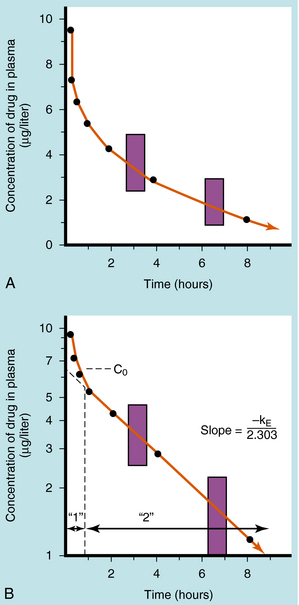
If a drug is injected into a vein as a single bolus over 5 to 30 seconds and blood samples are taken periodically and analyzed for the drug, the results appear as in Figure 3-2, A. The concentration will be greatest shortly after injection, when distribution of drug in the circulatory system has reached equilibrium. This initial mixing of drug and blood (red blood cells and plasma) is essentially complete after several passes through the heart. Drug leaves the plasma by several processes:
Some of the drug in plasma is bound to proteins or other plasma constituents; this binding occurs very rapidly and usually renders the bound portion of the drug inactive. Similarly, a considerable fraction of the injected dose may pass through capillary walls and bind to extravascular tissue, also rendering this fraction of drug inactive. The values of drug concentration plotted on the vertical scale in Figure 3-2 represent the sum of unbound drug and bound drug. Note that the concentration-time profile shows continuous curvature.
If concentrations are plotted on a logarithmic scale (Fig. 3-2, B), the terminal data points (after 1 hour) lie on a straight line. The section marked “1” on this graph represents the distribution phase (sometimes called alpha phase), representing the main process of drug distribution across membranes and into body regions that are not well perfused. Section “2” (beta phase or elimination) represents elimination of the drug, which gradually decreases plasma concentration. In many clinical situations, the duration of the distribution phase is very short compared with that of the elimination phase.
If the distribution phase in Figure 3-2 (A or B) is neglected, the equation of the line is:
where:
Equation 3-1 describes a curve on an arithmetic scale (Fig. 3-2, A) that becomes a straight line on a semilogarithmic scale (Fig. 3-2, B). In this case the slope will be –kE/2.3, and the y-intercept is log C0. A characteristic of this type of curve is that a constant fraction of drug dose remaining in the body is eliminated per unit time.
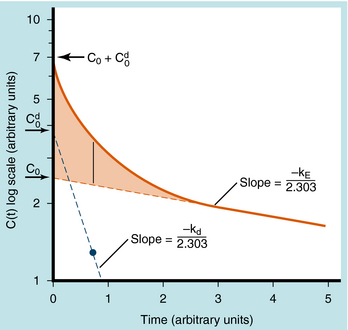
When elimination is rapid, the error in describing C(t) becomes appreciable if the distribution phase is omitted. Although the mathematical derivation is beyond the scope of this text, such a situation is plotted in Figure 3-3 to emphasize the importance of the distribution phase. For most drugs, distribution occurs much more rapidly than elimination, and therefore the distribution term becomes zero after only a small portion of the dose is eliminated. By back extrapolation of the linear postdistribution data, the value of C0 can be obtained, whereas kE can be determined from the slope. The concentration component responsible for the distribution phase (shaded area in Fig. 3-3) is obtained as the difference between the actual concentration and the extrapolated elimination line. This difference can be used to calculate the rate constant for distribution (kd) and the extrapolated time zero-concentration component for the distribution phase  . However, this complexity is often ignored because C(t) for many drugs can be described adequately in terms of the monoexponential equation 3-1. Therefore this chapter discusses only the postdistribution phase kinetics described by equation 3-1.
Single Oral Dose and Plasma Concentration
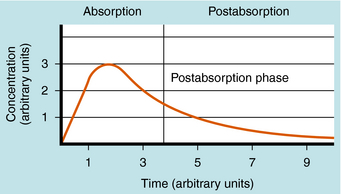
The plot of C(t) versus time after oral administration is different from that after IV injection only during the drug absorption phase, assuming equal bioavailability. The two plots become identical for the postabsorption or elimination phase. A typical plot of plasma concentration versus time after oral administration is shown in Figure 3-4. Initially, there is no drug in the plasma because the preparation must be swallowed, undergo dissolution if administered as a tablet, await stomach emptying, and be absorbed, mainly in the small intestine. As the plasma concentration of drug increases as a result of rapid absorption, the rate of elimination also increases, because elimination is usually a first-order process, where rate increases with increasing drug concentration. The peak concentration is reached when the rates of absorption and elimination are equal.
CALCULATION OF PHARMACOKINETIC PARAMETERS
As shown in Figures 3-2 and 3-4, the concentration-time profile of a drug in plasma is different after IV and oral administration. The shape of the area under the concentration-time curve (AUC) is determined by several factors, including dose magnitude, route of administration, elimination capacity, and single or multiple dosing. In experiments the information derived from such profiles allows derivation of the important pharmacokinetic parameters—clearance, volume of distribution, bioavailability, and t 1/2. These terms are used to calculate drug dosing regimens.
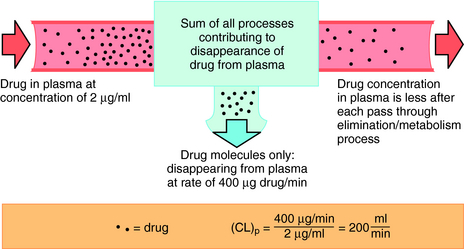
Drug clearance is defined as the volume of blood cleared of drug per unit time (e.g., mL/min) and describes the efficiency of elimination of a drug from the body. Clearance is an independent pharmacokinetic parameter; it does not depend on the volume of distribution, t1/2, or bioavailability, and is the most important pharmacokinetic parameter to know about any drug. It can be considered to be the volume of blood from which all drug molecules must be removed each minute to achieve such a rate of removal (Fig. 3-5). Chapter 2 contains descriptions of the mechanisms of clearance by renal, hepatic, and other organs. Total body clearance is the sum of all of these and is constant for a particular drug in a specific patient, assuming no change in patient status.
The plot of C(t) versus time (see Fig. 3-2) shows the concentration of drug decreasing with time. The corresponding elimination rate (e.g., mg/min) represents the quantity of drug being removed. The rate of removal is assumed to follow first-order kinetics, and total body clearance can be defined as follows:
where CLp indicates total body removal from plasma (p).
| Body Weight | Body H2O (percentage) | Volume (approx. liters) |
|---|---|---|
| Plasma | 4 | 3 |
| Extracellular | 20 | 15 |
| Total body | 60 | 45 |
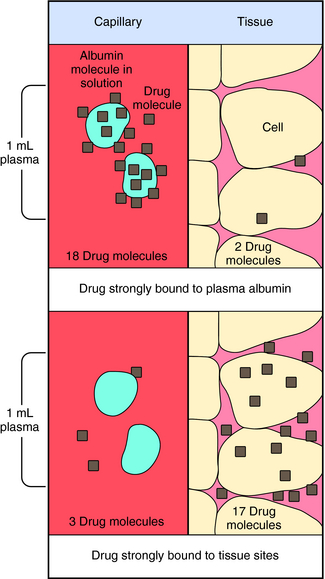
Experimental values of Vd vary from 5 to 10 L for drugs, such as warfarin and furosemide, to 15,000 to 40,000 L for chloroquine and loratadine in a 70 kg adult. How can one have Vd values grossly in excess of the total body volume? This usually occurs as a result of different degrees of protein and tissue binding of drugs and using plasma as the sole sampling source for determination of Vd (Fig. 3-6). For a drug such as warfarin, which is 99% bound to plasma albumin at therapeutic concentrations, nearly all the initial dose is in the plasma; a plot of log C(t) versus time, when extrapolated back to time zero, gives a large value for C0 (for bound plus unbound drug). Using a rearranged equation 3-4, Vd = D/C0, the resulting value of Vd is small (usually 2 to 10 L). At the other extreme is a drug such as chloroquine, which binds strongly to tissue sites but weakly to plasma proteins. Most of the initial dose is at tissue sites, thereby resulting in very small concentrations in plasma samples. In this case a plot of log C(t) versus time will give a small value for C0 that can result in Vd values greatly in excess of total body volume.
Equation 3-1 for C(t) was given earlier without explanation of its derivation or functional meaning. Experimental data for many drugs demonstrate that the rates of drug absorption, distribution, and elimination are generally directly proportional to concentration. Such processes follow first-order kinetics because the rate varies with the first power of the concentration. This is shown quantitatively as:
where dC(t)/dt is the rate of change of drug concentration, and kE is the elimination rate constant. It is negative because the concentration is being decreased by elimination.
Stay updated, free articles. Join our Telegram channel

Full access? Get Clinical Tree


