10 Chromatographic theory
Void volume and capacity factor
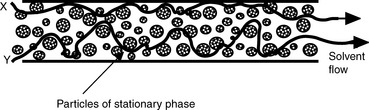
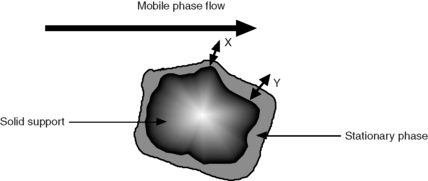
Figure 10.1 shows an HPLC column packed with a solid stationary phase with a liquid mobile phase flowing through it.
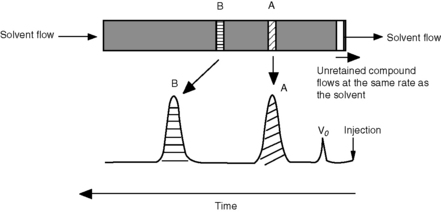
where Vo is the void volume of the column; Vr is the retention volume of the analyte; to is the time taken for an unretained molecule to pass through the void volume; and tr is the time taken for the analyte to pass through the column. In the example shown in Figure 10.1, compound B has a larger capacity factor than compound A. For example, if a compound had a K′ of 4, the Vo of a column was 1 ml and the solvent was flowing through the column at 1 ml/min, the total time taken for the compound to pass through the column would be 5 min, i.e. for the 1 min required to pass through the void space in the column 4 min would be spent in the stationary phase. This is a simplification of the actual process but it provides a readily understandable model. As can be seen in Figure 10.1 the peaks produced by chromatographic separation actually have width as well as a retention time and the processes which give rise to this width will be considered later.
Calculation of column efficiency
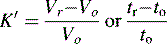
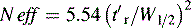
The broader a chromatographic peak is relative to its retention time, the less efficient the column it is eluting from. Figure 10.2 shows a chromatographic peak emerging at time tr after injection; the efficiency of the column is most readily assessed from the width of the peak at half its height W1/2 and its retention time using Equation 1:
 Equation 1
where n is the number of theoretical plates.
Column efficiency is usually expressed in theoretical plates per metre:

where L is the column length in cm.
A stricter measure of column efficiency, especially if the retention time of the analyte is short, is given by Equation 2:
 Equation 2
where N eff is the number of effective plates and reflects the number of times the analyte partitions between the mobile phase and the stationary phase during its passage through the column and t′r = tr−to.
Another term which is used as a measure is H, the ‘height of a theoretical plate’:

where H is the length of column required for one partition step to occur.
Origins of band broadening in HPLC
Van Deemter equation in liquid chromatography
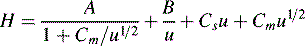
Chromatographic peaks have width and this means that molecules of a single compound, despite having the same capacity factor, take different lengths of time to travel through the column. The longer an analyte takes to travel through a column, the more the individual molecules making up the sample spread out and the broader the band becomes. The more rapidly a peak broadens the less efficient the column. Detailed mathematical modelling of the processes leading to band broadening is very complex.1 The treatment below gives a basic introduction to the origins of band broadening. The causes of band broadening can be formalised in the Van Deemter equation (Equation 3) as applied to liquid chromatography:
 Equation 3
u is the linear velocity of the mobile phase, simply how many cm/s an unretained molecule travels through the column, and A is the ‘eddy’ diffusion term; broadening occurs because some molecules take longer erratic paths while some, for instance those travelling close to the walls of the column, take more direct paths, thus eluting first. As shown in Figure 10.3, for two molecules of the same compound, molecule X elutes before molecule Y. In liquid chromatography the eddy diffusion term also contains a contribution from streaming within the solvent volume itself, i.e. A (see the Cm term) is reduced if the diffusion coefficient of the molecule within the mobile phase is low because molecules take less erratic paths through not being able to diffuse out of the mainstream so easily.
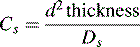
where d2 thickness is the square of the stationary-phase film thickness and Ds is the diffusion coefficient of the analyte in the stationary phase.
Obviously the thinner and more uniform the stationary-phase coating, the smaller the contribution to band broadening from this term. In the example shown in Figure 10.4, molecule Y is retarded more than molecule X. It could be argued that this effect evens out throughout the length of the column, but in practice the number of random partitionings during the time required for elution is not sufficient to eliminate it. As might be expected, Cs makes less contribution as u decreases.
< div class='tao-gold-member'>
Stay updated, free articles. Join our Telegram channel

Full access? Get Clinical Tree


