CHAPTER OUTLINE
Maturity-Onset Type Diabetes in the Young
Type 1 Diabetes: Insulin-Dependent Diabetes Mellitus
Pathophysiology of Type 1 Diabetes
The Immunology of Type 1 Diabetes
Type 2 Diabetes: Noninsulin-Dependent Diabetes Mellitus
Pathophysiology of Type 2 Diabetes
Mitochondrial Dysfunction in Obesity and T2D
Therapeutic Intervention for Hyperglycemia
High-Yield Terms
Polyuria: excessive urine output as is typical in most forms of diabetes
Polyphagia: excessive hunger typically associated with Type 1 diabetes
Polydipsia: excessive thirst as is often associated with diabetes
Oral glucose tolerance test, OGTT: a test to measure the plasma responses to intake of a bolus of glucose; used to determine insulin function and the potential for diabetes
Type 1 diabetes, T1D: insulin-dependent diabetes mellitus (IDDM); insulin-deficient form diabetes most often manifesting in children as a result of autoimmune destruction of the α-cells of the pancreas
Diabetic ketoacidosis, DKA: a potentially life-threatening condition of excess ketone production by the liver in response to uncontrolled fatty acid release from adipose tissue resulting from excess glucagon secretion
Type 2 diabetes, T2D: noninsulin-dependent diabetes mellitus (NIDDM); a form of the disease associated with peripheral insulin resistance progressing to loss of insulin production
Gestational diabetes mellitus, GDM: a specific form of diabetes mellitus characterized by glucose intolerance first appearing during pregnancy
Maturity-onset type diabetes of the young, MODY: a class of T2D caused by inherited or somatic mutations in any of several genes involved in pancreatic function
Neonatal diabetes: hyperglycemia resulting from dysfunction in insulin action within the first 6 months of life and thus, not Type 1 diabetes
HbA1c: designates the glycosylated form of adult hemoglobin; is a measure of the level of glucose in the plasma
Diabetes Defined
Diabetes is any disorder characterized by excessive urinary output. The most common form of diabetes is diabetes mellitus, a metabolic disorder in which there is an inability to completely dispose of glucose due to disturbances in insulin function resulting in glucosuria and hyperglycemia. Additional symptoms of diabetes mellitus include polydipsia (excessive thirst), polyuria (excessive urine output), polyphagia (excessive hunger), and lipemia.
Two primary criteria are used to clinically establish an individual as suffering from diabetes mellitus. One is a fasting plasma glucose (FPG) level in excess of 126 mg/dL (7 mmol/L) where normal levels should be less than 100 mg/dL (5.6 mmol/L). The second is defined by the results of a glucose tolerance test where having plasma glucose levels in excess of 200 mg/dL (11 mmol/L) at 2 time points during an oral glucose tolerance test (OGTT), one of which must be within 2 hours of ingestion of glucose (Figure 47-1).

FIGURE 47-1: Glucose tolerance curve for a normal person and one with noninsulin-dependent diabetes mellitus (NIDDM, Type 2 diabetes). The dotted lines indicate the boundaries for the range of glucose concentration expected in a normal individual. Reproduced with permission of themedicalbiochemistrypage, LLC.
The earlier a person is diagnosed with diabetes (principally type 2), the better chance the person has of staving off the primary negative consequences which are renal failure, blindness and limb amputations due to circulatory problems. The American Diabetes Association recommends that physicians consider patients to be prediabetic if their FPG is above 100 mg/dL but less than 125 mg/dL and whose glucose levels are at least 140 mg/dL but less than 200 mg/dL following an oral glucose tolerance test (OGTT).
Types of Diabetes Mellitus
Diabetes mellitus is a heterogeneous clinical disorder with numerous causes. Two main classifications of diabetes mellitus exist, idiopathic and secondary. Idiopathic diabetes is divided into 2 main types: insulin dependent and noninsulin-dependent. Insulin-dependent diabetes mellitus (IDDM) is more commonly referred to as Type 1 diabetes, T1D. Noninsulin-dependent diabetes mellitus (NIDDM) is more commonly referred to as Type 2 diabetes, T2D.
Gestational diabetes mellitus (GDM) is considered a specific form of diabetes mellitus. It is characterized by glucose intolerance first appearing during pregnancy. Insulin resistance normally increases during pregnancy but most women respond to this with a compensatory increase in insulin secretion. A failure of this response is what causes gestational diabetes. Gestational diabetes most often manifests during the third trimester. Women who experience GDM are at higher risk for future development of typical Type 2 diabetes.
Another form of diabetes is diabetes insipidus, which is the result of a deficiency of antidiuretic hormone (ADH, also referred to as vasopressin or arginine vasopressin, AVP). The major symptom of diabetes insipidus (excessive output of dilute urine) results from an inability of the kidneys to reabsorb water.
High-Yield Concept
There is a strong correlation between obesity and the onset of Type 2 diabetes with its associated insulin resistance. Due to the rise in childhood obesity, many children are developing Type 2 diabetes at an alarming rate. Although there is a strong correlation, it is important to recognize that obesity alone does not always lead to insulin resistance as some individuals who are obese do not experience insulin resistance and, conversely, some individuals who manifest insulin resistance are not obese. These latter observations point to the added role of genetics in the acquisition of insulin resistance.
Type 1 diabetes most often manifests in childhood (archaically called juvenile onset diabetes) and is the result of an autoimmune destruction of the β-cells of the pancreas. This form of diabetes is defined by the development of potentially fatal ketoacidosis in the absence of insulin therapy.
Type 2 diabetes is characterized by persistent hyperglycemia but rarely leads to ketoacidosis. Type 2 diabetes generally manifests after age 40 and, therefore, has the obsolete name of adult onset-type diabetes. Type 2 diabetes can result from genetic defects that cause either insulin resistance or insulin deficiency or both. There are 2 main forms of Type 2 diabetes defined as late onset associated with obesity and late onset not associated with obesity.
Secondary causes of diabetes mellitus are numerous and can be associated with the pharmacology of certain drugs and as a consequence of unrelated diseases and disorders (Table 47-1). Many other genetic syndromes have either diabetes or impaired glucose tolerance associated with them such as the encephalomyopathies associated with mitochondrial disorders (see Chapter 17).

Maturity-Onset Type Diabetes in the Young
All cases of MODY are associated with some level of impaired β-cell function characterized by defective GSIS (glucose-stimulated insulin secretion). Patients may also exhibit insulin resistance and late β-cell failure. Evidence indicates that mutations in 10-12 different genes have been correlated with the development of MODY (Table 47-2).

Type 1 Diabetes: Insulin-Dependent Diabetes Mellitus
Etiology of Type 1 Diabetes
Type 1 diabetes has been shown to be the result of an autoimmune reaction to antigens of the islet cells of the pancreas (Table 47-3). There is a strong association between T1D and other endocrine autoimmunities (eg, Addison disease). Additionally, there is an increased prevalence of autoimmune disease in family members of T1D patients.

High-Yield Concept
Maturity-onset type diabetes of the young (MODY) is a form of diabetes characterized by onset prior to age 25 but not associated with autoimmune loss of pancreatic β-cells. MODY was previously considered to be a third form of Type 2 diabetes; however, with the discovery that specific gene mutations are the cause of the various forms of MODY, it is now classified as a specific type of diabetes.
Pathophysiology of Type 1 Diabetes
The autoimmune destruction of pancreatic β-cells in T1D leads to a deficiency of insulin secretion. It is this loss of insulin secretion that leads to the metabolic derangements associated with T1D.
The resultant inappropriately elevated glucagon level exacerbates the metabolic defects due to insulin deficiency. The most pronounced example of this metabolic disruption is that patients with T1D rapidly develop diabetic ketoacidosis in the absence of insulin administration. Particularly problematic for long-term T1D patients is an impaired ability to secrete glucagon in response to hypoglycemia. This leads to potentially fatal hypoglycemia in response to insulin treatment in these patients.
Although insulin deficiency is the primary defect in T1D, in patients with poorly controlled T1D there is also a defect in the ability of target tissues to respond to the administration of insulin. There are multiple biochemical mechanisms that account for this impairment. Deficiency in insulin leads to elevated levels of free fatty acids in the plasma as a result of uncontrolled lipolysis in adipose tissue. Free fatty acids suppress glucose metabolism in peripheral tissues such as skeletal muscle. This impairs the action of insulin in these tissues, that is, the promotion of glucose utilization. Additionally, insulin deficiency decreases the expression of a number of genes necessary for target tissues to respond normally to insulin such as glucokinase in liver and the GLUT4 class of glucose transporters in adipose tissue and skeletal muscle. The major metabolic derangements which result from insulin deficiency in T1D are impaired glucose, lipid, and protein metabolism (Figure 47-2).

FIGURE 47-2: Metabolic disruptions occurring in T1D. The major metabolic disturbances associated with T1D are the result of the loss of insulin and uncontrolled increases in glucagon secretion from the pancreas. Glucagon stimulates triglyceride hydrolysis in adipose tissue and increases glycogen breakdown and gluconeogenesis in the liver. The glucose released from the liver is not taken up by adipose tissue or muscle due to loss of insulin-mediated GLUT4 migration to the plasma membrane. Lipid homeostasis in the liver is shifted to oxidation resulting in elevated ketone production. Whatever triglyceride that is incorporated into very-low-density lipoprotein (VLDL) in the liver and in chylomicrons from the gut cannot be taken up by adipose tissue due to the enhanced lipolysis occurring in this tissue. Skeletal muscle alanine and lactate contribute to glucose production by the liver exacerbating the hyperglycemia resulting from impaired insulin responses. Reproduced with permission of themedicalbiochemistrypage, LLC.
Glucose metabolism
Uncontrolled T1D leads to increased hepatic glucose output. Excess glucagon stimulates hepatic glycogen breakdown and gluconeogenesis resulting in intracellular glucose levels exceeding the metabolic capacity of the liver so it is released to the blood. In addition, the level of hepatic glucokinase is regulated by insulin. Therefore, a reduced rate of glucose phosphorylation in hepatocytes leads to increased glucose delivery to the blood.
The insulin deficiency simultaneously impairs nonhepatic tissue utilization of glucose, primarily adipose tissue and skeletal muscle, resulting in hyperglycemia. Other enzymes involved in anabolic metabolism of glucose are affected by insulin primarily through induced covalent modifications. The combination of increased hepatic glucose production and reduced peripheral tissues metabolism leads to elevated plasma glucose levels. When the capacity of the kidneys to absorb glucose is surpassed, glucosuria ensues. Glucose is an osmotic diuretic and an increase in renal loss of glucose is accompanied by loss of water and electrolytes, termed polyuria. The result of the loss of water (and overall volume) leads to the hyperactivation of the thirst mechanism (polydipsia). The negative caloric balance which results from the glucosuria and tissue catabolism leads to an increase in appetite and food intake (polyphagia).
High-Yield Concept
In addition to the loss of insulin secretion, the function of pancreatic α-cells is also abnormal resulting in excessive secretion of glucagon in T1D patients. Normally, hyperglycemia leads to reduced glucagon secretion. However, in patients with T1D, glucagon secretion is not suppressed by hyperglycemia.
Lipid metabolism
One major role of insulin is to stimulate the storage of food energy following the consumption of a meal. This energy storage is in the form of glycogen in hepatocytes and skeletal muscle. Additionally, insulin stimulates hepatocytes to synthesize triglycerides and storage of triglycerides in adipose tissue. Adipocyte tissue storage of triglycerides is normally favored due to insulin-mediated inhibition of lipolysis. In uncontrolled T1D there is a rapid mobilization of triglycerides due to excess glucagon release from the pancreas leading to increased levels of plasma free fatty acids (FFAs). The FFAs are taken up by numerous tissues, including the liver, and metabolized to provide energy.
Normally, the levels of malonyl-CoA are high in the presence of insulin. These high levels of malonyl-CoA inhibit carnitine palmitoyltransferase I, the enzyme required for the transport of fatty acyl-CoAs into the mitochondria where they are subjected to oxidation for energy production. Thus, in the absence of insulin, malonyl-CoA levels fall and transport of fatty acyl-CoAs into the mitochondria increases. Mitochondrial oxidation of fatty acids generates acetyl-CoA, which can be further oxidized in the TCA cycle. In hepatocytes the majority of the acetyl-CoA is metabolized into the ketone bodies (see Chapter 25). These ketone bodies leave the liver and are used for energy production by the brain, heart, and skeletal muscle. In T1D, the increased availability of free fatty acids exacerbates the reduced uptake and utilization of glucose by adipose tissue and skeletal muscle, furthering the ensuing hyperglycemia.
High-Yield Concept
Production of ketone bodies in excess of the ability to utilize them leads to ketoacidosis which is called diabetic ketoacidosis, DKA (see Clinical Box 47-1) in T1D. If the DKA is not treated it can lead to fatal consequences in T1D patients. Ketoacidosis can be easily diagnosed by smelling the breath since acetone, a spontaneous breakdown product of acetoacetate, is volatilized by the lungs producing a distinctive odor.

Normally, plasma triglycerides are acted upon by lipoprotein lipase (LPL), an enzyme on the surface of the endothelial cells lining the vessels. In particular, LPL activity allows fatty acids to be taken from circulating triglycerides for storage in adipocytes or utilization by skeletal muscle and heart. The level and activity of LPL are induced by insulin, therefore in the absence of insulin in T1D a hypertriglyceridemia results.
Protein metabolism
Insulin regulates the synthesis of many genes, either positively or negatively that then affect overall metabolism. Insulin has a global effect on protein metabolism, increasing the rate of protein synthesis and decreasing the rate of protein degradation. Thus, insulin deficiency will lead to increased catabolism of protein. The increased rate of proteolysis leads to elevated concentrations in plasma amino acids, particularly alanine and glutamine. These amino acids serve as precursors for hepatic, intestinal, and renal gluconeogenesis. In liver, the increased gluconeogenesis further contributes to the hyperglycemia seen in T1D (Clinical Box 47-1).
The Immunology of Type 1 Diabetes
The majority of genetic loci associated with the development of Type 1 diabetes (T1D) map to the human leukocyte antigen (HLA) class II proteins which are encoded for by genes in the major histocompatibility complex (MHC). This is not to say that all genetic associations in T1D are due to mutations in HLA genes as more than 40 additional T1D susceptibility loci have been identified that are not HLA genes.
The most frequently observed non-HLA genes associated with T1D are the insulin (INS), protein tyrosine phosphatase, nonreceptor type 22 (PTPN22), cytotoxic T-lymphocyte–associated protein 4 (CTLA4), interleukin-2 receptor-α (IL2RA), and interferon-induced with helicase C domain 1 (IFIH1) genes. Polymorphisms in the INS gene account for approximately 10% of genetic susceptibilities to T1D.
Children with the high-risk HLA alleles DR3/4–DRQ or DR4/DR4 and who have a family history of T1D have a nearly 1 in 5 chance of developing islet cell autoantibodies resulting in T1D. These same children born into a family with no history of T1D still have a 1 in 20 chance of developing T1D. The class II HLA molecules that are associated with increased risk of T1D have been shown to bind peptides derived from the currently identified autoantigens described in Table 47-3 and present these peptides to CD4+ T cells which then activate CD8+ cytotoxic T cells resulting in killing of islet β cells.
Type 2 Diabetes: Noninsulin-Dependent Diabetes Mellitus
Etiology of Type 2 Diabetes
Type 2 diabetes refers to the common form of idiopathic diabetes mellitus. Type 2 diabetes is generally characterized by late onset (hence the archaic term of adult-onset diabetes) and a lack of ketoacidosis. Type 2 diabetes is not an autoimmune disorder; however, there are strong genetic correlations to the susceptibility to this form of diabetes. Obesity is a major risk factor that predisposes one to T2D. Genetic studies have demonstrated a link between genes responsible for obesity and those that cause diabetes mellitus.
CLINICAL BOX 47-1: DIABETIC KETOACIDOSIS
The most severe and life-threatening complication of poorly controlled Type 1 diabetes is diabetic ketoacidosis (DKA). DKA is characterized by metabolic acidosis, hyperglycemia, and hyperketonemia. Diagnosis of DKA is accomplished by detection of hyperketonemia and metabolic acidosis (as measured by the anion gap) in the presence of hyperglycemia. The anion gap refers to the difference between the concentration of cations other than sodium and the concentration of anions other than chloride and bicarbonate. The anion gap, therefore, represents an artificial assessment of the unmeasured ions in plasma. Calculation of the anion gap involves sodium (Na+), chloride (Cl−), and bicarbonate (HCO3−) measurements and it is defined as [Na+ − (Cl− + HCO3−)], where the sodium and chloride concentrations are measured in mEq/L and the bicarbonate concentration in mmol/L. The anion gap will increase when the concentration of plasma K+, Ca2+, or Mg2+ is decreased, when organic ions such as lactate are increased (or foreign anions accumulate), or when the concentration or charge of plasma proteins increases. Normal anion gap is between 8 and 12 mEq/L and a higher number is diagnostic of metabolic acidosis. Rapid and aggressive treatment is necessary as the metabolic acidosis will result in cerebral edema and coma eventually leading to death. The hyperketonemia in DKA is the result of insulin deficiency and unregulated glucagon secretion from α-cells of the pancreas. Circulating glucagon stimulates the adipose tissue to release fatty acids stored in triglycerides. The free fatty acids enter the circulation and are taken up primarily by the liver where they undergo fatty acid oxidation to acetyl-CoA. Normally, acetyl-CoA is completely oxidized to CO2 and water in the TCA cycle. However, the level of fatty acid oxidation is in excess of the livers’ ability to fully oxidize the excess acetyl-CoA and, thus, the compound is diverted into the ketogenesis pathway. The ketones (ketone bodies) are β-hydroxybutyrate and acetoacetate with β-hydroxybutyrate being the most abundant. Acetoacetate will spontaneously (nonenzymatic) decarboxylate to acetone. Acetone is volatile and is released from the lungs giving the characteristic sweet smell to the breath of someone with hyperketonemia. The ketones are released into the circulation and because they are acidic lower the pH of the blood resulting in metabolic acidosis. Insulin deficiency also causes increased triglyceride and protein metabolism in skeletal muscle. This leads to increased release of glycerol (from triglyceride metabolism) and alanine (from protein metabolism) to the circulation. These substances then enter the liver where they are used as substrates for gluconeogenesis, which is enhanced in the absence of insulin and the elevated glucagon. The increased rate of glucose production in the liver coupled with the glucagon-mediated inhibition of glucose storage into glycogen results in the increased glucose release from the liver and consequent hyperglycemia. The resultant hyperglycemia produces an osmotic diuresis that leads to loss of water and electrolytes in the urine. The ketones are also excreted in the urine, and this results in an obligatory loss of Na+ and K+. The loss in K+ is large, sometimes exceeding 300 mEq/L/24 h. Initial serum K+ is typically normal or elevated because of the extracellular migration of K+ in response to the metabolic acidosis. The level of K+ will fall further during treatment as insulin therapy drives K+ into cells. If serum K+ is not monitored and replaced as needed (see below), life-threatening hypokalemia may develop. Each case of DKA must be treated on an individual basis. Table 47-4 shows a general scheme for diagnosis and treatment of DKA.
Pathophysiology of Type 2 Diabetes
Insulin resistance (IR) is suggested to be the primary cause of T2D. However, because a moderate degree of IR is not sufficient to cause T2D others contend that insulin deficiency is the primary cause. Patients with T2D who do not control their glucose levels through proper diet and exercise will eventually see a reduction or loss of insulin production and will, therefore, eventually require insulin injections to control their disease.
The major clinical complications of T2D are the result of persistent hyperglycemia which leads to numerous pathophysiological consequences (Figure 47-3). As the glucose level rises in the blood, the blood becomes more viscous which makes circulation in the small capillaries difficult. The reduced circulation results in progressive vascular complications leading to diabetic retinopathy (referred to as diabetic blindness), peripheral neuropathy (resulting in numbness in the extremities and tingling in fingers and toes), poor wound healing, renal failure, and erectile dysfunction. In addition to these major clinical complications, the body reacts by increasing the level of glucose excretion by the kidneys leading to frequent urination (polyuria). As the glucose is excreted there is a concomitant loss of water to maintain normal osmolarity of the urine. The water loss leads to excessive thirst called polydypsia.
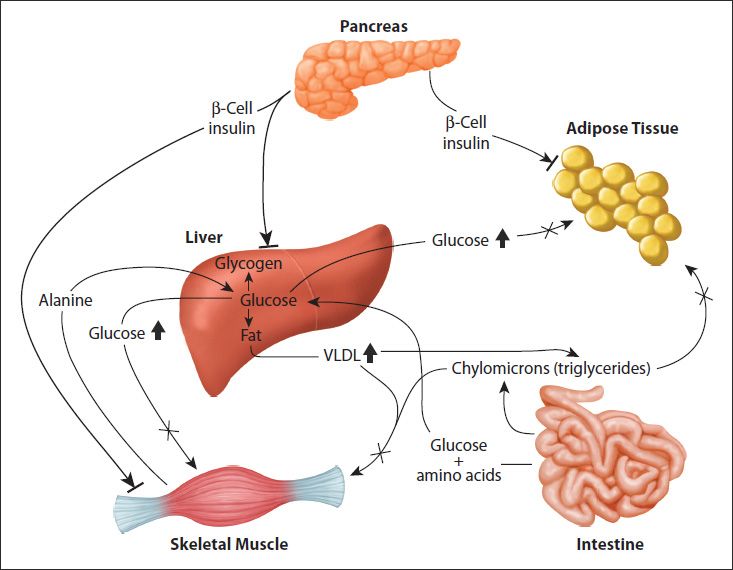
FIGURE 47-3: Metabolic disruptions occurring in T2D. The major metabolic disturbances associated with T2D are the result of impaired peripheral tissue responses to insulin, primarily the liver, skeletal muscle, and adipose tissue. The bars at the ends of the insulin arrows denote the failure of the hormone to activate normal signaling in these tissues. The insulin resistance results in elevated glucose and VLDL output by the liver; this coupled to impaired glucose uptake by skeletal muscle and adipose tissue results in hyperglycemia and hyperlipidemia. Reproduced with permission of themedicalbiochemistrypage, LLC.
High-Yield Concept
The highest risk populations for the development of T1D are children born with the HLA DR3/4–DQ8 serotype allele which accounts for almost 50% of all children who develop antibodies against pancreatic islet cells and thus develop T1D by the age of 5.
High-Yield Concept
Unlike patients with T1D, those with T2D have detectable levels of circulating insulin. On the basis of oral glucose tolerance testing the essential elements of T2D can be divided into 4 distinct groups; those with normal glucose tolerance, chemical diabetes (called impaired glucose tolerance), diabetes with minimal fasting hyperglycemia (FPG <140 mg/dL), and diabetes in association with overt fasting hyperglycemia (FPG >140 mg/dL). Most patients with T2D will first exhibit normal to high insulin secretion but have impaired peripheral tissue responses, primarily reduced adipose tissue and skeletal muscle glucose disposal.
As pointed out, persistent hyperglycemia is the major physiological complication associated with T2D. Indeed, the development of hypoglycemia inducing drugs is the major pharmacological focus of T2D therapies.
Since hemoglobin is present in red blood cells and these cells have a limited life span of 120 days in the circulation, measurement of HbA1c levels is a relatively accurate measure of the amount of glucose in the blood and the length of time the level has been elevated.
Genetics of Type 2 Diabetes
Development of T2D is the result of multifactorial influences that include lifestyle, environment, and genetics. The disease arises when insulin resistance–induced compensatory insulin secretion is exhausted. A high-caloric diet, coupled with a sedentary lifestyle, is the major contributing factors in the development of the insulin resistance and pancreatic β-cell dysfunction. However, a predisposing genetic background has long been suspected in playing a contributing role in the development of T2D.
Using genome-wide association studies (GWAS), the first major susceptibility locus for T2D was identified in 1996. This locus was designated NIDDM1. The first gene identified in the NIDDM1 locus with polymorphisms correlated to T2D susceptibility was calpain 10 (CAPN10). Calpain 10 is a calcium-activated neutral protease that is likely to have a critical role in the survival of pancreatic β-cells. Genetic variants in CAPN10 may alter insulin secretion or insulin action as well as the production of glucose by the liver. Recent studies indicate that CAPN10 may have a critical role in the survival of pancreatic β-cells.
High-Yield Concept
Assessment of therapeutic efficacy in the treatment of the hyperglycemia in T2D is accomplished by routine measurement of the circulating levels of glycosylated hemoglobin, designated as the level of HbA1c, often designated as just A1c (Clinical Box 47-2). HbA1 is the major form of adult hemoglobin in the blood and the “c” refers to the glycosylated form of the protein.
CLINICAL BOX 47-2: MEASUREMENT OF HBA1C LEVELS
Typical values for HbA1c measurement (using the previous standard Diabetes Control and Complications Trial [DCCT] units of %) are shown in Table 47-5. Beginning in 2011 a new international standard (International Federation of Clinical Chemistry [IFCC[ units) for the measurement of HbA1c levels will be utilized. This new standard equates the mmol of HbA1c per mole of total measured hemoglobin, Hb (mmol/mol). The method for calculating the relationship between these 2 measurement values is to use the following formula:
IFCC−HbA1c (mmol/mol) = [DCCT −HbA1c (%)− 2.15] × 10.929
To calculate the estimated average glucose (eAG) level in the blood using the DCCT (%) values, one would use the following formula:
eAG(mg/dL) = 28.7 × A1c − 46.7 (for glucose level in mM use: eAG(mM) = 1.59 × A1c − 2.59
With new IFCC standard the target range of HbA1c for healthy levels is 48-59 mmol/mol.

More recent GWAS screens for single nucleotide polymorphisms (SNPs) associated with T2D have identified several new candidate genes (Table 47-6). The transcription factor TCF7L2 (transcription factor 7-like 2, T-cell specific HMG-box) is involved in the signaling pathways initiated by the Wnt family of secreted growth factors (see Chapter 46). Two SNPs identified in the TCF7L2 gene are the most highly correlated polymorphisms with T2D.

Neonatal Diabetes
Neonatal diabetes can be transient or permanent. If an infant suffers from the transient form they are at increased risk for developing full-blown diabetes later in life. The permanent form of the disease is termed permanent neonatal diabetes mellitus (PNDM). PNDM is a rare event occurring with a frequency of approximately 2 cases per 100,000 births. Definitive determination of PNDM requires early gene screening as soon as symptoms manifest. Very low birth weight is highly correlated to PNDM and is associated with fetal lack of insulin. The most prominent of symptoms is the onset of hyperglycemia within the first 6 months after birth. Affected infants do not secrete insulin in response to glucose or glucagon but will secrete insulin in response to sulfonylurea administration. Many infants will exhibit similar neurological abnormalities, including developmental delay, muscle weakness, and epilepsy. In patients manifesting with neurological abnormalities, there are often associated dysmorphic features, including prominent metopic suture, a downturned mouth, bilateral ptosis, and limb contractures.
Genetic evidence demonstrates that PNDM is the result of single-gene defects. The disorder can be inherited, although it is most often the result of a sporadic mutation in one of the parental gametes. At least 12 genes have been identified as being associated with the development of PNDM. The most commonly mutated genes are the potassium inwardly-rectifying channel, subfamily J, member 11 (KCNJ11), ATP-binding cassette transporter, subfamily C, member 8 (ABCC8), and insulin (INS) genes.
Mitochondrial Dysfunction in Obesity and T2D
Chapter 17 discusses the normal biogenesis of mitochondria and the gene defects associated with the mitochondrial encephalomyopathies.
Mitochondrial dysfunction results in increased production of reactive oxygen species (ROS), which activates stress responses leading to increased activity of MAPK and JNK. Both of these serine/threonine kinases phosphorylate IRS1 and IRS2 resulting in decreased signaling downstream of the insulin receptor such as activation of PI3K. Inhibition of PI3K results in reduced glucose uptake in skeletal muscle and adipose tissue due to impaired mobilization of GLUT4 vesicles to the plasma membrane.
High-Yield Concept
Neonatal diabetes refers to a circumstance in which hyperglycemia results from dysfunction in insulin action within the first 6 months of life. The etiology of diabetes in the first year of life is different from that of the autoimmune forms of T1D more classically diagnosed when children are older.
High-Yield Concept
Mitochondrial dysfunction, particularly as it relates to the processes of oxidative phosphorylation (oxphos), is contributory to the development of encephalomyopathy, mitochondrial myopathy, and several age-related disorders that include neurodegenerative diseases, the metabolic syndrome, and diabetes. Indeed, with respect to diabetes, several mitochondrial diseases manifest with diabetic complications such as mitochondrial myopathy, encephalopathy, lactic acidosis, and stroke-like episodes (MELAS) and maternally inherited diabetes and deafness (MIDD).
Mitochondrial dysfunction also results in a reduction in the level of enzymes involved in β-oxidation leading to increases in intramyocellular lipid content. Indeed, skeletal muscle metabolism of lipids is impaired in T2D. An increased delivery of fatty acids to skeletal muscle, as well as diminished mitochondrial oxidation, results in increased intracellular content of fatty acid metabolites such as diacylglycerol (DAG), fatty acyl-CoAs, and ceramides. These metabolites of fatty acids are all known to induce the activity of protein kinase C isoforms (PKCβ and PKCδ) that phosphorylate IRS1 and IRS2 on serine residues resulting in impaired insulin signaling downstream of the insulin receptor (see Figure 46-7).
Skeletal muscle consumes large amounts of serum glucose, therefore mitochondrial dysfunction in this tissue will have the greatest impact on glucose disposal. However, adipose tissue also plays an important role in glucose homeostasis and mitochondrial dysfunction in this tissue also results in impaired glucose homeostasis contributing to the hyperglycemia in T2D. Adipose tissue secretes a number of proteins classified as adipokines (see Chapter 45). Adiponectin promotes insulin sensitivity in insulin-responsive tissues, such as skeletal muscle. Enhanced adipocyte mitochondrial biogenesis results in increased adiponectin release from adipose tissue. Conversely, expression of adiponectin expression is decreased in adipocytes with mitochondrial dysfunction.
Given that impaired mitochondrial function is clearly associated with obesity and T2D, it is not surprising that there is great interest in the use of pharmacological agents to augment mitochondrial function in the treatment of these disorders. Of significance is the fact that the thiazolidinedione (TZD) class of drug, used to treat the hyperglycemia of T2D (see the next section), activate PPARγ which in turn increases the level of activity of PGC-1α which is a major regulator of mitochondrial biogenesis. Antioxidants have also been shown to enhance mitochondrial function by reducing the production of ROS. Resveratrol (found in grape skins and red wine) is a potent antioxidant whose activity is, in part, due to its ability to activate the deacetylase SIRT1. Activated SIRT1 deacetylates PGC-1α resulting in increased transcriptional activity and, thus, enhanced mitochondrial biogenesis.
Therapeutic Intervention for Hyperglycemia
Many, if not all, of the vascular consequences of insulin resistance are due to the persistent hyperglycemia seen in T2D. For this reason, a major goal of therapeutic intervention in T2D is to reduce circulating glucose levels. There are many pharmacological strategies to accomplish these goals (Table 47-7).

Stay updated, free articles. Join our Telegram channel

Full access? Get Clinical Tree


