CHAPTER OUTLINE
The Insulin Receptor and Signaling
Glucose-Stimulated Insulin Secretion
Nutrient Intake and Hormonal Control of Insulin Release
Intestinal Wnt Signaling, GLP-1, and Insulin Secretion
Insulin Regulation of Carbohydrate Homeostasis
Insulin Regulation of Lipid Homeostasis
Insulin Function as a Growth Factor
Lipemia in Obesity and Insulin Resistance
Ceramides and Insulin Resistance
High-Yield Terms
Incretin: any gut hormone associated with food intake-stimulation of insulin secretion from the pancreas
Glucose-stimulated insulin secretion, GSIS: process of glucose uptake and metabolism by β-cells leading to increased ATP production which inhibits a potassium-dependent ATP (KATP) channel resulting in depolarization of the membrane triggering calcium influx and insulin secretory vesicle fusion with plasma membrane
ABCC8/KCNJ11: ATP-binding cassette, subfamily C, member 8 (ABCC8-encoded protein is also known as the sulfonylurea receptor, SUR) and potassium inwardly rectifying channel, subfamily J, member 11, protein components of the KATP channel of β-cells that regulates insulin secretion
TCF7L2: transcription factor 7-like 2, T-cell–specific HMG-box, involved in Wnt signal transduction, polymorphisms in this gene are the most highly correlated with potential for development of T2D
Insulin resistance, IR: a phenomenon whereby binding of insulin to its receptor results in impaired or failed propagation of normal signal transduction events
Introduction
Insulin was one of the first identified pancreatic hormones. It is secreted by the β-cells of the pancreas and directly infused, via the portal vein, to the liver where it exerts profound metabolic effects. Its major function as a pancreatic hormone is to counter the concerted action of a number of hyperglycemia-generating hormones and to maintain low blood glucose levels, particularly in response to food consumption. In addition to its role in regulating glucose homeostasis, insulin stimulates lipogenesis, diminishes lipolysis, and increases amino acid transport into cells. Because there are numerous hyperglycemic hormones, untreated disorders associated with insulin generally lead to severe hyperglycemia and shortened life span as is typically seen in poorly controlled type 2 diabetes, T2D (see Chapter 47).
Insulin also exerts activities typically associated with growth factors (Figure 46-1). Insulin is a member of a family of structurally and functionally similar molecules that includes the insulin-like growth factors (IGF-1 and IGF-2), and relaxin. The tertiary structure of all 4 molecules is similar, and all have growth-promoting activities. Insulin modulates transcription and stimulates protein translocation, cell growth, DNA synthesis, and cell replication, effects that it holds in common with the insulin-like growth factors and relaxin.
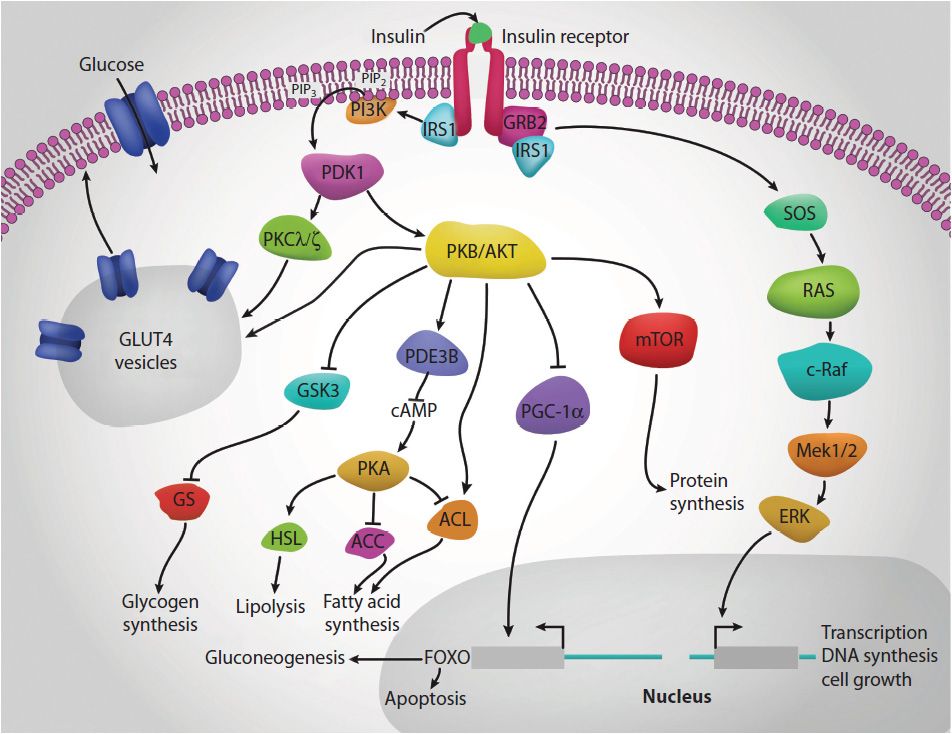
FIGURE 46-1: Multiple roles of insulin. When insulin binds to its receptor it triggers receptor autophosphorylation that in turn triggers the activation of a wide array of signal transducing proteins (highly simplified in this figure). The end results of insulin receptor activation are varied and in many cases cell-type specific but includes alterations in metabolism, ion fluxes, protein translocation, transcription rates, and growth properties of responsive cells. Protein abbreviations are described throughout the text. Reproduced with permission of themedicalbiochemistrypage, LLC.
The Insulin Receptor and Signaling
All of the effects of insulin are the result of the activation of the insulin receptor. The insulin receptor belongs to the class of cell surface receptors that exhibit intrinsic tyrosine kinase activity (see Chapter 40). The insulin receptor is a heterotetramer of 2 extracellular α-subunits disulfide bonded to 2 transmembrane β-subunits (Figure 46-2).

FIGURE 46-2: Structure of the insulin receptor. Reproduced with permission of themedicalbiochemistrypage, LLC.
All of the postreceptor responses initiated by insulin binding to its receptor are mediated as a consequence of the activation of several divergent and/or intersecting signal transduction pathways (see Figure 46-1). These include association of insulin receptor substrates (of which there are 4: IRS1, IRS2, IRS3, and IRS4) with the receptor resulting in the activation of phosphatidylinositol-3 kinase, PI3K and growth factor receptor-binding protein 2 (GRB2). Activated PI3K phosphorylates membrane phospholipids, the major product being phosphatidylinositol-3,4,5-trisphosphate (PIP3). PIP3 in turn activates the enzyme, PIP3-dependent kinase 1 (PDK1). PDK1 activates another kinase called protein kinase B, PKB (also called Akt). PKB/Akt then exerts effects on numerous pathways that ultimately regulate carbohydrate and lipid homeostasis.
Insulin-mediated glucose uptake involves activated PDK1 which phosphorylates some isoforms of protein kinase C, PKC. The PKC isoform, PKCλ/ζ, phosphorylates intracellular vesicles containing the glucose transporter, GLUT4, resulting in their migration to and fusion with, the plasma membrane. This results in increased glucose uptake and metabolism.
The activation of GRB2 results in signal transduction via the monomeric G-protein, RAS. Activation of RAS ultimately leads to changes in the expression of numerous genes via activation of members of the extracellular signal-regulated kinases, ERK.
In addition to its effects on enzyme activity, insulin exerts effects on the transcription of numerous genes, effects that are primarily mediated by regulated activity of sterol-regulated element-binding protein, SREBP (see Chapter 26). These transcriptional effects include (but are not limited to) increases in glucokinase, liver pyruvate kinase (LPK), lipoprotein lipase (LPL), fatty acid synthase (FAS), and acetyl-CoA carboxylase (ACC) gene expression, and decreases in glucose 6-phosphatase, fructose-1,6-bisphosphatase, and phosphoenolpyruvate carboxykinase (PEPCK) gene expression.
Functional Insulin Synthesis
Insulin is synthesized as a preprohormone in the β-cells of the islets of Langerhans. Its signal peptide is removed in the cisternae of the endoplasmic reticulum and it is packaged into secretory vesicles in the Golgi, folded to its native structure, and locked in this conformation by the formation of 2 disulfide bonds. Specific protease activity cleaves the center third of the molecule, which dissociates as C peptide, leaving the amino terminal B peptide disulfide bonded to the carboxy terminal A peptide (Figure 46-3).

FIGURE 46-3: Structure of human proinsulin. Insulin and C-peptide molecules are connected at 2 sites by dipeptide links. An initial cleavage by a trypsin-like enzyme (open arrows) followed by several cleavages by a carboxypeptidase-like enzyme (solid arrows) results in the production of the heterodimeric (AB) insulin molecule (colored) and the C-peptide (white). Murray RK, Bender DA, Botham KM, Kennelly PJ, Rodwell VW, Weil PA. Harper’s Illustrated Biochemistry, 29th ed. New York, NY: McGraw-Hill; 2012.
Glucose-Stimulated Insulin Secretion
The KATP channel is a complex of 8 polypeptides comprising 4 copies of the protein encoded by the ABCC8 (ATP-binding cassette, subfamily C, member 8) gene and 4 copies of the protein encoded by the KCNJ11 (potassium inwardly rectifying channel, subfamily J, member 11; also known as Kir6.2) gene. The ABCC8-encoded protein is also known as the sulfonylurea receptor (SUR). The KCNJ11-encoded protein forms the core of the KATP channel. As might be expected, the role of KATP channels in insulin secretion presents a viable therapeutic target for treating hyperglycemia due to insulin insufficiency as is typical in type 2 diabetes.
High-Yield Concept
Insulin secretion from β-cells is principally regulated by plasma glucose levels and is referred to as glucose-stimulated insulin secretion, GSIS. Increased uptake of glucose by pancreatic β-cells leads to a concomitant increase in glucose oxidation and an elevation in the ATP/ADP ratio (Figure 46-4). This in turn leads to the inhibition of an ATP-sensitive potassium channel (KATP channel). The net result is a depolarization of the cell leading to Ca2+ influx and insulin secretion.
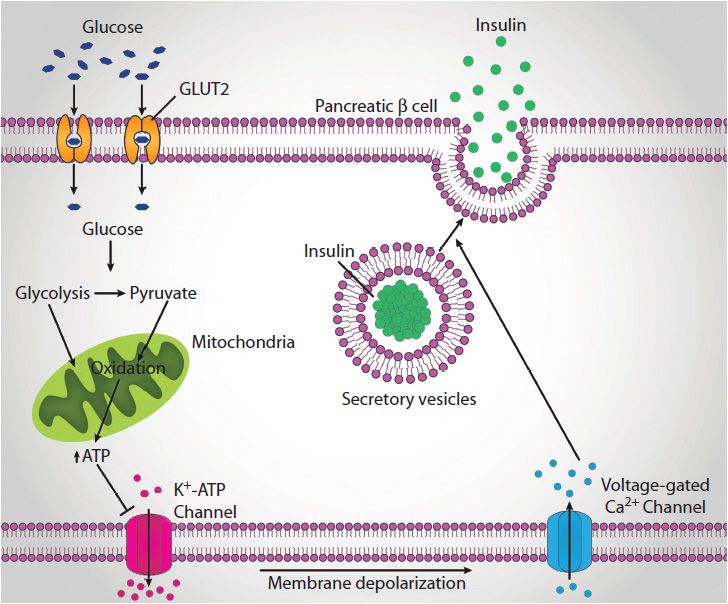
FIGURE 46-4: Glucose-stimulated insulin secretion. Glucose uptake into the β-cell is oxidized which generates ATP via mitochondrial oxidative phosphorylation. The increased ATP levels inhibit the KATP channel which leads to membrane depolarization and the opening of calcium channels. The influx of calcium triggers the fusion of insulin-containing secretory vesicles with the plasma membrane and the release of insulin to the circulation. Reproduced with permission of themedicalbiochemistrypage, LLC.
High-Yield Concept
As opposed to the positive role of pancreatic glucose metabolism on insulin secretion, pancreatic fatty acid uptake inhibits GSIS. Increased intracellular fatty acids interfere with the nuclear localization of 2 transcription factors, FOXA2 and HNF1α, that are involved in the transcription of the glycosyltransferase GnT-4a (α-1,3-mannosyl-glycoprotein β-1,4-N-acetylglucosaminyltransferase, isozyme A) gene. GnT-4a, encoded by the MGAT4A gene, is involved in generating the core GlcNAc linkage in N-glycosylated proteins (see Chapter 38). N-glycosylation of pancreatic GLUT2 is critical for its correct membrane localization, without which there can be no glucose uptake and thus no GSIS. Of significance to diabetes is the fact that defects in the HNF1A gene are associated with MODY3. In addition, the transcription factor HNF1α (encoded by the HNF1A gene) is involved in the regulated expression of the HNF4A, GLUT2, and LPK genes and mutations in the HNF4A gene or defects in HNF4α function result in MODY1.
Nutrient Intake and Hormonal Control of Insulin Release
Of the many gastrointestinal hormones (see Chapter 44), 2 have significant effects on insulin secretion and glucose regulation. These hormones are GLP-1 and GIP. These 2 hormones constitute the class of molecules referred to as the incretins.
Details of the actions of GLP-1 and GIP are discussed in Chapter 44. Briefly, GLP-1 is derived from the product of the proglucagon gene. This gene encodes a preproprotein that is differentially cleaved dependent upon the tissue in which it is synthesized. Upon nutrient ingestion GLP-1 is secreted from intestinal enteroendocrine L cells that are found predominantly in the ileum and colon with some production from these cell types in the duodenum and jejunum.
Intestinal Wnt Signaling, GLP-1, and Insulin Secretion
There is ample evidence indicating a significant role for Wnt in the control of metabolism. Wnt action has been shown to be involved in metabolic control via its actions in both the gut and pancreas and Wnt signaling interacts with the signal transduction pathways induced by insulin. The Wnt family of growth factors was first identified by their ability to control important processes of embryonic axis determination during early development. Wnts are soluble secreted factors that exert their effects by binding to the frizzled receptors which are members of the G-protein–coupled receptor (GPCR) family. Wnt binding to frizzled results in the stabilization and activation of β-catenin. Stable β-catenin migrates to the nucleus where it activates transcription factors of the T-cell factor (TCF) family.
High-Yield Concept
Incretins are gut hormones associated with food intake-stimulation of insulin secretion from the pancreas.
High-Yield Concept
The primary physiological responses to GLP-1 are GSIS, enhanced insulin secretion, inhibition of glucagon secretion, and inhibition of gastric acid secretion and gastric emptying. The action of GLP-1 at the level of insulin and glucagon secretion results in significant reduction in circulating levels of glucose following nutrient intake. This activity has obvious significance in the context of diabetes, in particular the hyperglycemia associated with poorly controlled T2D. The glucose-lowering activity of GLP-1 is highly transient as the half-life of this hormone in the circulation is less than 2 minutes. Removal of bioactive GLP-1 is a consequence of N-terminal proteolysis catalyzed by dipeptidyl peptidase IV (DPP IV or DPP4).
Wnt signaling is involved in the regulated expression of the proglucagon gene (GCG) in intestinal enteroendocrine L cells. Gut expression of the proglucagon gene results in the production of GLP-1 which then exerts its effects on the gut and the pancreas as described earlier. GLP-1 also exerts central effects within the brain where its actions result in increased satiety and a reduced desire for food intake.
Insulin Regulation of Carbohydrate Homeostasis
One of the major whole-body responses to the release of insulin is the modulation of glucose homeostasis. This includes stimulated uptake of glucose from the blood, primarily by adipose tissue and skeletal muscle, followed by either storage of the glucose as glycogen or the conversion of glucose carbons into fatty acids for storage in triglycerides.
In most nonhepatic tissues, insulin increases glucose uptake by increasing the number of plasma membrane glucose transporters, GLUT4. With respect to regulating the levels of blood glucose, this response to insulin is most significant in adipose tissue and skeletal muscle. In the liver and pancreatic β-cells, glucose uptake is facilitated by GLUT2 which is constitutively present in the plasma membrane.
Increases in the plasma membrane content of GLUT4 stem from an increase in the rate of recruitment of the transporters into the plasma membrane, deriving from a special pool of preformed transporters localized to vesicles in the cytoplasm (see Figure 46-1). Increased glucose uptake by liver, in response to insulin action, results from increased disposal and/or storage.
In addition to the above-described events, diminished cAMP and elevated protein phosphatase activity combine to convert glycogen phosphorylase to its inactive form and glycogen synthase to its active form, with the result that not only is glucose funneled to glycolytic products, but glycogen content is increased as well (Figure 46-5).

FIGURE 46-5: Insulin-mediated regulation of glycogen homeostasis. Following insulin binding to its receptor as signal transduction cascade is activated involving IRS1 and ultimately altering the activities of glycogen phosphorylase and glycogen synthase. PI3K = phosphatidylinositol-3 kinase; PIP2 = phosphatidylinositol-4,5-bisphosphate; PIP3 = phosphatidylinositol-3,4,5-bisphosphate; PDK1 = PIP3-dependent protein kinase; TSC1 and TSC2 = tuberous sclerosis tumor suppressors 1 (hamartin) and 2 (tuberin); Rheb = Ras homolog enriched in brain; mTOR = mammalian target of rapamycin. PKB/Akt = protein kinase B/Akt2; GSK3 = glycogen synthase kinase 3; S6K = 70kDa ribosomal protein S6 kinase, also called p70S6K. Arrows denote either direction of flow or positive effects, T lines represent inhibitory effects. Reproduced with permission of themedicalbiochemistrypage, LLC.
High-Yield Concept
The GCG promoter region contains an enhancer that harbors a canonical Wnt response element that binds the TCF transcription factor, TCF7L2. Genome-wide screens for polymorphisms associated with T2D have shown that 2 single nucleotide polymorphisms (SNPs) in the TCF7L2 gene are the most frequently occurring SNPs associated with this disease.
In the liver, glucose uptake is dramatically increased due to insulin-mediated increases in the activity of the enzymes glucokinase, phosphofructokinase 1 (PFK-1), and liver pyruvate kinase (LPK), the key regulatory enzymes of glycolysis. The latter effects are induced by insulin-dependent activation of phosphodiesterase (PDE) which leads to decreases in cAMP levels. Decreased cAMP results in decreased PKA activity and, as a consequence, diminished phosphorylation of LPK and phosphofructokinase 2, PFK-2. Dephosphorylation of LPK increases its activity while dephosphorylation of PFK-2 renders it active as a kinase. The kinase activity of PFK-2 converts fructose 6-phosphate into fructose 2,6-bisphosphate (F2,6BP). F2,6BP is a potent allosteric activator of the rate-limiting enzyme of glycolysis, PFK-1, and an inhibitor of the gluconeogenic enzyme, fructose-1,6-bisphosphatase (see Chapters 10 and 13). In addition, phosphatases specific for the phosphorylated forms of the glycolytic enzymes increase in activity under the influence of insulin. All these events lead to conversion of the glycolytic enzymes to their active forms and consequently a significant increase in glycolysis. In addition, glucose 6-phosphatase activity is downregulated. The net effect is an increase in the content of hepatocyte glucose and its phosphorylated derivatives, with diminished hepatic output of glucose to the blood.
Insulin Regulation of Lipid Homeostasis
The net effect of insulin on global metabolism is increased storage of carbon for future use as an energy source. This includes the diversion of glucose into glycogen as well as glucose and fatty acid carbons into triglycerides.
The major effects of insulin, at the level of lipid homeostasis, are activation of lipogenesis and inhibition of lipolysis. The majority of these effects are the result of insulin activation of PDE with consequent reductions in PKA-mediated phosphorylation of its substrates. Within adipocytes, decreased PKA-mediated phosphorylation of hormone-sensitive lipase (HSL) leads to reduced release of free fatty acids (FFAs) from triglycerides.
In the liver, adipose tissue, and skeletal muscle, PKA phosphorylates and inhibits the activity of ATP-citrate lyase (ACL) which is the major enzyme involved in the generation of cytoplasmic acetyl-CoA used for fatty acid and cholesterol synthesis. PKA also phosphorylates and inhibits acetyl-CoA carboxylase (ACC) which is the rate-limiting enzyme of fatty acid synthesis (see Chapter 19). Therefore, activation of PDE by insulin results in reduced PKA-mediated inhibition of ACL and ACC. Insulin-mediated activation of PKB/Akt in adipocytes results in phosphorylation and activation of ACL. Taken together, insulin-mediated increases in glycolysis and the increased activities of ACL and ACC ultimately result in increased fatty acid synthesis. Increased fatty acid synthesis leads to increased storage as triglycerides.
Insulin Function as a Growth Factor
As a growth factor, insulin modulates the transcription of numerous genes involved in cell growth and differentiation. Insulin also stimulates DNA synthesis which is required for cell proliferation. Several of the insulin-stimulated genes are involved in restricting the activation and propagation of apoptotic signals allowing for increased cell survival.
The most well-studied growth factor role for insulin is the stimulation of protein synthesis (Figure 46-6). Both translational initiation and elongation are increased in response to insulin via a cascade leading to the activation of the kinase, mammalian target of rapamycin (mTOR). Rapamycin is an immunosuppressant that gets its name from the fact that the compound was isolated from the bacterium Streptomyces hygroscopicus discovered on Easter Island (Rapa Nui).

FIGURE 46-6: Insulin-mediated cascade leading to enhanced translation (not intended to be a complete description of all of the targets of insulin action that affect translation rates). Also shown is the effect of an increase in the AMP to ATP ratio which activates AMP-activated kinase, AMPK. STK11-LKB1-PJS = serine-threonine kinase 11, Peutz-Jeghers syndrome gene. IRS1 = insulin receptor substrate 1; PI3K = phosphatidylinositol-3 kinase; PIP2 = phosphatidylinositol-4,5-bisphosphate; PTEN = phosphatase and tensin homolog deleted on chromosome 10; PDK1 = PIP3-dependent protein kinase; TSC1 and TSC2 = tuberous sclerosis tumor suppressors 1 (hamartin) and 2 (tuberin); Rheb = Ras homolog enriched in brain; mTOR = mammalian target of rapamycin. PKB/Akt = protein kinase B; GSK3 = glycogen synthase kinase 3; 4EBP1 = eIF-4E binding protein; p70S6K = 70kDa ribosomal protein S6 kinase, also called S6K. The role of AMPK in metabolism is discussed in detail in Chapter 34. Reproduced with permission of themedicalbiochemistrypage, LLC.
mTOR is actually a component of 2 distinct multiprotein complexes termed mTORC1 and mTORC2 (mTOR complex 1 and mTOR complex 2). Activation and/or regulation of mTORC1 is involved in the control of cell proliferation, survival, metabolism, and stress responses. These events can be triggered by nutrient availability, glucose, oxygen, and numerous different types of cell surface receptor activation including insulin.
As indicated earlier, insulin action leads to an increase in the activity of PI3K which in turn phosphorylates membrane phospholipids generating PIP3 which then activates the PDK1 which in turn phosphorylates and activates PKB/Akt. Activated PKB/Akt will phosphorylate TSC2 (tuberin) of the TSC1/TSC2 complex resulting in altered activity of the complex. The TSC1/TSC2 complex functions as a GTPase-activating protein (GAP) which increases GTP hydrolyzing activity of Rheb. The faster the GTPase action of Rheb the faster will be the reduction in Rheb activation of mTOR. When TSC1/TSC2 is phosphorylated by PKB it is less effective at stimulating the GTPase activity of Rheb and, therefore Rheb activation of mTOR will remain high in response to insulin action. In the context of protein synthesis, the activation of mTOR leads to phosphorylation and activation of p70S6K.
Both mTOR and p70S6K have been shown to phosphorylate the regulator of translation initiation, eIF-4E binding protein, 4EBP1. Phosphorylation of 4EBP1 prevents it from binding to eIF-4E. Binding of 4EBP1 to eIF-4E prevents eIF-4E from interaction with the cap structure of mRNAs which is necessary for translational initiation. Thus, the consequences of 4EBP1:eIF-4E interaction is a reduction in translation initiation. As a consequence of the concerted actions of mTOR and p70S6K, insulin results in increased initiation of protein synthesis.
Insulin also activates the kinase, PKB. Activated PKB phosphorylates and inhibits glycogen synthase kinase 3 (GSK3). One of the targets of GSK3, relative to translation, is eIF-2B. Phosphorylation of eIF-2B prevents it from performing its guanine nucleotide exchange function (GEF) in association with eIF-2. Decreased GTP for GDP exchange in eIF-2 results in reduced translational initiation. When GSK3 is inhibited in response to insulin-mediated activation of PKB, eIF-2B GEF activity remains high. High eIF-2B GEF activity means the rate of translational initiation by eIF-2 remains high so protein synthesis will be favored.
Active p70S6K also phosphorylates eEF-2 kinase (EEF2K). As the name implies, EEF2K phosphorylates eEF-2 leading to a decrease in its role in translation elongation. When phosphorylated by p70S6K, EEF2K is less active, thus eEF-2 is much more active as a consequence of insulin action. In addition, insulin action leads to a rapid dephosphorylation of eEF-2 via activation of protein phosphatase 2A (PP2A). Taken together, reduced EEF2K-mediated phosphorylation and increased eEF-2 dephosphorylation lead to increased protein synthesis.
In contrast, epinephrine diminishes insulin secretion by a cAMP-coupled regulatory path. In addition, epinephrine counters the effect of insulin in liver and peripheral tissue, where it binds to β-adrenergic receptors, induces adenylate cycles activity, increases cAMP, and activates PKA similarly to that of glucagon. The latter events induce glycogenolysis and gluconeogenesis, both of which are hyperglycemic and which thus counter insulin’s effect on blood glucose levels. In addition, epinephrine influences glucose homeostasis through interaction with α-adrenergic receptors.
Lipemia in Obesity and Insulin Resistance
Obesity is of epidemic proportions in the United States and one of the most serious consequences of this disorder is the development of type 2 diabetes. Associated with obesity, and contributing to worsening of type 2 diabetes is insulin resistance (IR).


