CHAPTER 22 Ventilation ( ), Perfusion (
 ), and
  /
/ Relationships
Ventilation and pulmonary blood flow (perfusion) are important components of gas exchange in the lung. However, the major determinant of normal gas exchange and thus the level of PO2 and PCO2 in blood is the relationship between ventilation and perfusion. This relationship is called the  /
/ ratio.
VENTILATION
where f is the frequency or number of breaths per minute and TV, also known as VT, is the tidal volume, or volume of air inspired (or exhaled) per breath. Tidal volume varies with age, gender, body position, and metabolic activity. In an average-sized adult at rest, tidal volume is 500 mL. In children, it is 3 to 5 mL/kg.
ALVEOLAR VENTILATION
Composition of Air
As inspiration begins, the ambient air is brought into the airways, where it becomes warmed to body temperature and humidified. Inspired gases become saturated with water vapor, which exerts a partial pressure and dilutes the total pressure of the other gases. Water vapor pressure at body temperature is 47 mm Hg. To calculate the partial pressure of a gas in a humidified mixture, the water vapor partial pressure must be subtracted from the total barometric pressure. Thus, in the conducting airways the partial pressure of O2 is
and the partial pressure of N2 is
Alveolar Gas Composition
When the inspired gas reaches the alveolus, O2 is transported across the alveolar membrane, and CO2 moves from the capillary bed into the alveolus. The process by which this occurs is described in Chapter 23. At the end of inspiration and with the glottis open, the total pressure in the alveolus is atmospheric; thus, the partial pressures of the gases in the alveolus must equal the total pressure, which in this case is atmospheric. The composition of the gas mixture, however, is changed and can be described as
where PIO2 is the inspired partial pressure of O2, which is equal to the fraction (F) of inspired O2 (FIO2) times barometric pressure (Pb) minus water vapor pressure (PH2O). PACO2 is the CO2 tension of alveolar gas, and R is the respiratory exchange ratio or respiratory quotient. The respiratory quotient is the ratio of CO2 excreted ( CO2) to the O2 taken up (
 O2) by the lungs. This quotient is the amount of CO2 produced relative to the amount of O2 consumed by metabolism and is dependent on caloric intake. The respiratory quotient varies between 0.7 and 1.0 and is 0.7 in states of exclusive fatty acid metabolism and 1.0 in states of exclusive carbohydrate metabolism. Under normal dietary conditions, the respiratory quotient is assumed to be 0.8. Thus, the quantity of O2 taken up exceeds the quantity of CO2 that is released in the alveoli.
The partial pressures of O2, CO2, and N2 from ambient air to the alveolus are shown in Table 22-1.
Table 22-1 Total and Partial Pressures of Respiratory Gases in Ideal Alveolar Gas and Blood at Sea Level (760 mmHg)

where  CO2 is the rate of CO2 production by the body,
  A is alveolar ventilation, and FACO2 is the fraction of CO2 in dry alveolar gas. This relationship demonstrates that the rate of elimination of CO2 from the alveolus is related to alveolar ventilation and to the fraction of CO2 in the alveolus. Alveolar PACO2 is defined by the following:
Hence, we can substitute in the previous equation and demonstrate the following relationship:
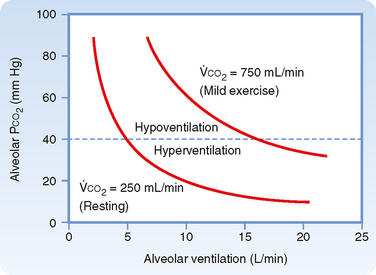
This equation demonstrates several important relationships. First, there is an inverse relationship between the partial pressure of CO2 in the alveolus (PACO2) and alveolar ventilation ( A), irrespective of the exhaled CO2. Specifically, if ventilation is doubled, PACO2 will decrease by 50%. Conversely, if ventilation is decreased by half, the partial pressure of CO2 in the alveolus will double. Second, at a constant alveolar ventilation (
 A), doubling of the metabolic production of CO2 (
 CO2) will double the partial pressure of CO2 in the alveolus. The relationship between alveolar ventilation and alveolar PCO2 is shown in Figure 22-1.
Arterial Gas Composition
In normal individuals, arterial PCO2 is tightly regulated and maintained at about 40 mm Hg. Increases or decreases in arterial PCO2, particularly when associated with changes in arterial pH, have profound effects on cell function, including enzyme and transport protein activity. Specialized chemoreceptors monitor PCO2 in arterial blood and in the brainstem (Chapter 24), and minute ventilation varies in accordance with the level of PCO2.
Distribution of Ventilation
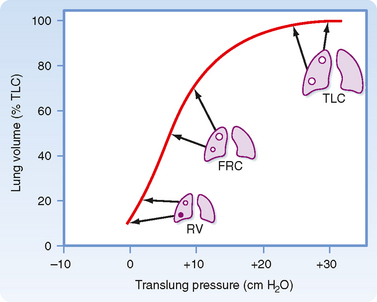
Ventilation is not uniformly distributed in the lung, in large part because of the effects of gravity. In the upright position, alveoli near the apex of the lung are more expanded than alveoli at the base. Gravity pulls the lung downward and away from the chest wall. As a result, pleural pressure is less at the apex than at the base of the lung, and static translung pressure (PL = PA − Ppl) is increased; this results in an increase in alveolar volume at the apex. Because of the difference in alveolar volume at the apex and at the base of the lung (Fig. 22-2), alveoli at the lung base are located along the steep portion of the pressure-volume curve, and they receive more of the ventilation (i.e., they have greater compliance). In contrast, the alveoli at the apex are closer to the top of the pressure-volume curve. They have lower compliance and thus receive proportionately less of the tidal volume. The effect of gravity is less pronounced when one is supine rather than upright, and it is less when one is supine rather than prone. This is because the diaphragm is pushed cephalad when one is supine, and it affects the size of all of the alveoli.
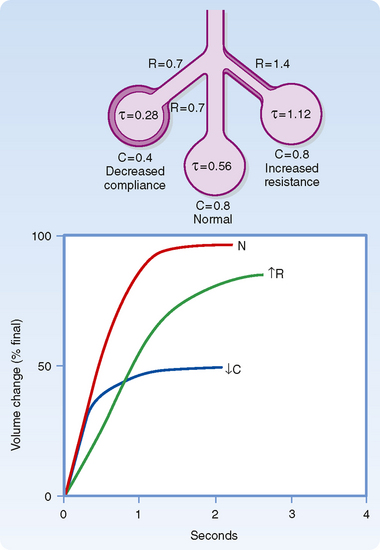
Alveolar units with long time constants fill and empty slowly. Thus, an alveolar unit with increased airway resistance or increased compliance will take longer to fill and longer to empty. In normal adults, the respiratory rate is about 12 breaths per minute, the inspiratory time is about 2 seconds, and the expiratory time is about 3 seconds. In normal individuals this time is sufficient to approach equilibrium (Fig. 22-3). In the presence of increased resistance or increased compliance, however, equilibrium is not reached.
Single-Breath Nitrogen Test
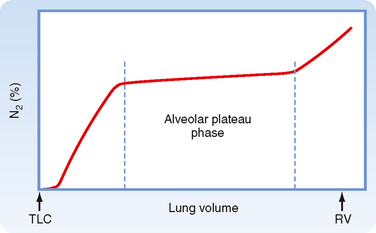
The single-breath N2 test can be used to assess the uniformity of ventilation. The subject takes a single maximal inspiration of 100% O2. During the subsequent exhalation, [N2] in the exhaled air is measured. Air (100% O2, 0% N2) initially exits from the conducting airways; then [N2] begins to rise as alveolar emptying occurs. Finally, there is a plateau [N2] as only the alveoli that contain N2 empty (Fig. 22-4).
DEAD SPACE
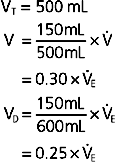
where V refers to volume and the subscripts T, D, and A refer to tidal, dead space, and alveolar. A “dot” above V denotes a volume per unit of time (n). Thus,
or
where  E is the exhaled minute volume,
  D is the dead space per minute, and
  A is alveolar ventilation per minute.
PERFUSION
The Pulmonary Circulation
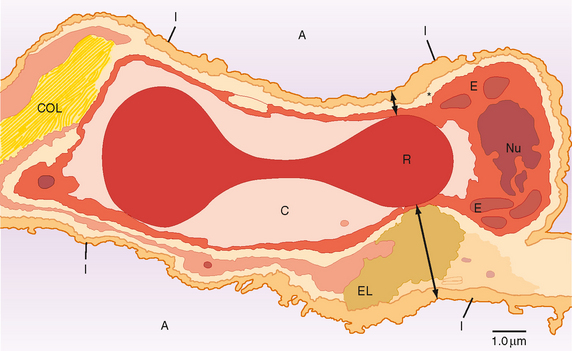
The pulmonary circulation begins with the right atrium. Deoxygenated blood from the right atrium enters the right ventricle via the tricuspid valve, and it is then pumped under low pressure (9 to 24 mm Hg) into the pulmonary artery through the pulmonic valve. The pulmonary artery (pulmonary trunk), which is about 3 cm in diameter, branches quickly (5 cm from the right ventricle) into the right and left main pulmonary arteries, which supply blood to the right and left lungs, respectively. The arteries of the pulmonary circulation are the only arteries in the body that carry deoxygenated blood. The deoxygenated blood in the pulmonary arteries passes through a progressively smaller series of branching vessels (vessel diameters: arteries, >500 μm; arterioles, 10 to 200 μm; capillaries, <10 μm) that end in a complex meshlike network of capillaries (see Chapter 20, Fig. 20-7). The sequential branching pattern of the pulmonary arteries follows the pattern of airway branching. The functions of the pulmonary circulatory system are to (1) reoxygenate the blood and dispense with CO2, (2) aid in fluid balance in the lung, and (3) distribute metabolic products to and from the lung. Oxygenation of red blood cells occurs in the capillaries that surround the alveoli, where the pulmonary capillary bed and the alveoli come together in the alveolar wall in a unique configuration for optimal gas exchange (Fig. 22-5). Gas exchange occurs through this alveolar-capillary network.
< div class='tao-gold-member'>
Stay updated, free articles. Join our Telegram channel

Full access? Get Clinical Tree


 E) is the volume of air that enters or leaves the lung per minute and it is described by



 /
/ . The well-ventilated units (short time constant) empty faster than less well ventilated units (long time constant). The portion of the curve up to the first vertical dashed line represents the washout of dead space air mixed with alveolar gas. The long alveolar plateau rises slowly (<2%) if the distribution of ventilation is relatively uniform, as shown here. The final phase, after the second vertical line, shows very late, slowly emptying alveoli. This phase is accentuated with age.


 E) in the following way:
