Objectives
- Predicts the consequences of mismatched ventilation and perfusion.
- Describes the methods used to assess the matching of ventilation and perfusion.
- Describes the methods used to determine the uniformity of the distribution of the inspired gas and pulmonary blood flow.
- Explains the regional differences in the matching of ventilation and perfusion of the normal upright lung.
- Predicts the consequences of the regional differences in the ventilation and perfusion of the normal upright lung.
Ventilation-Perfusion Relationships: Introduction
Gas exchange between the alveoli and the pulmonary capillary blood occurs by diffusion, as will be discussed in the next chapter. Diffusion of oxygen and carbon dioxide occurs passively, according to their concentration differences across the alveolar-capillary barrier. These concentration differences must be maintained by ventilation of the alveoli and perfusion of the pulmonary capillaries.
The Concept of Matching Ventilation and Perfusion
Alveolar ventilation brings oxygen into the lung and removes carbon dioxide from it. Similarly, the mixed venous blood brings carbon dioxide into the lung and takes up alveolar oxygen. The alveolar  and
and  are thus determined by the relationship between alveolar ventilation and pulmonary capillary perfusion. Alterations in the ratio of ventilation to perfusion, called the
  , will result in changes in the alveolar
  and
and  , as well as in gas delivery to or removal from the lung.
Alveolar ventilation is normally about 4 to 6 L/min and pulmonary blood flow (which is equal to cardiac output) has a similar range, and so the  for the whole lung is in the range of 0.8 to 1.2.
  However, ventilation and perfusion must be matched on the alveolar-capillary level, and the
  for the whole lung is really of interest only as an approximation of the situation in all the alveolar-capillary units of the lung. For instance, suppose that all 5 L/min of the cardiac output went to the left lung and all 5 L/min of alveolar ventilation went to the right lung. The whole lung
  would be 1.0, but there would be no gas exchange because there could be no gas diffusion between the ventilated alveoli and the perfused pulmonary capillaries.
Consequences of High and Low Ventilation-Perfusion Ratio
Oxygen is delivered to the alveolus by alveolar ventilation, is removed from the alveolus as it diffuses into the pulmonary capillary blood, and is carried away by blood flow. Similarly, carbon dioxide is delivered to the alveolus in the mixed venous blood and diffuses into the alveolus in the pulmonary capillary. The carbon dioxide is removed from the alveolus by alveolar ventilation. As will be discussed in Chapter 6, at resting cardiac outputs the diffusion of both oxygen and carbon dioxide is normally limited by pulmonary perfusion. Thus, the alveolar partial pressures of both oxygen and carbon dioxide are determined by the  .
.  If the
  in an alveolar-capillary unit increases, the delivery of oxygen relative to its removal will increase, as will the removal of carbon dioxide relative to its delivery. Alveolar
  will therefore rise, and alveolar
  will fall. If the
  in an alveolar-capillary unit decreases, the removal of oxygen relative to its delivery will increase and the delivery of carbon dioxide relative to its removal will increase. Alveolar
  will therefore fall, and alveolar
  will rise.
Figure 5–1 shows the consequences of alterations in the relationship of ventilation and perfusion on hypothetical alveolar-capillary units. Unit A has a normal  . Inspired air enters the alveolus with a
  of about 150 mm Hg and a
  of nearly 0 mm Hg. Mixed venous blood enters the pulmonary capillary with a
  of about 40 mm Hg and a
  of about 45 mm Hg. This results in an alveolar
  of about 100 mm Hg and an alveolar
  of 40 mm Hg (see Chapter 3). The partial pressure difference for oxygen diffusion from alveolus to pulmonary capillary is thus about 100 to 40 mm Hg, or 60 mm Hg; the partial pressure gradient for CO2 diffusion from pulmonary capillary to alveolus is only about 45 to 40, or 5 mm Hg.
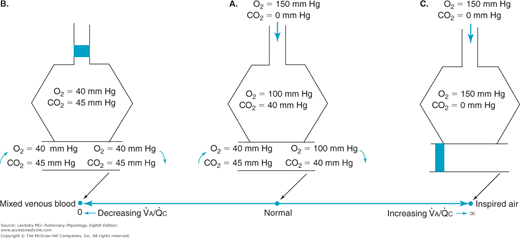


The airway supplying unit B has become completely occluded. Its  is zero. As time goes on, the air trapped in the alveolus equilibrates by diffusion with the gas dissolved in the mixed venous blood entering the alveolar-capillary unit. (If the occlusion persists, the alveolus is likely to collapse.) No gas exchange can occur, and any blood perfusing this alveolus will leave it exactly as it entered it. Unit B is therefore acting as a right-to-left shunt.
The blood flow to unit C is blocked by a pulmonary embolus, and unit C is therefore completely unperfused. It has an infinite  . Because no oxygen can diffuse from the alveolus into pulmonary capillary blood and because no carbon dioxide can enter the alveolus from the blood, the
  of the alveolus is approximately 150 mm Hg and its
  is approximately zero. That is, the gas composition of this unperfused alveolus is the same as that of inspired air. Unit C is alveolar dead space. If unit C were unperfused because its alveolar pressure exceeded its pre-capillary pressure (rather than because of an embolus), then it would also correspond to part of zone 1.
Units B and C represent the 2 extremes of a continuum of ventilation-perfusion ratios. The  ratio of a particular alveolar-capillary unit can fall anywhere along this continuum, as shown at the bottom of Figure 5–1. The alveolar
  and
and  of such units will therefore fall between the two extremes shown in the figure: Units with low
  ratios will have relatively low
  and high
  ; units with high
  ratios will have relatively high
  and low
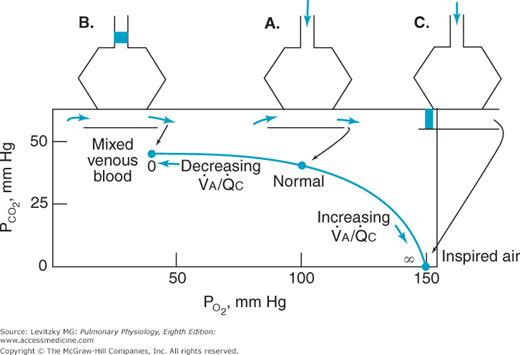
  . This is demonstrated graphically in an O2-CO2 diagram such as that seen in Figure 5–2.
  The diagram shows the results of mathematical calculations of alveolar
  and
and  for
for  ratios between zero (for mixed venous blood) and infinity (for inspired air). The resulting curve is known as the ventilation-perfusion ratio line. This simple O2-CO2 diagram can be modified to include correction lines for other factors, such as the respiratory exchange ratios of the alveoli and the blood or the dead space. The position of the
  ratio line is altered if the partial pressures of the inspired gas or mixed venous blood are altered.


Testing for Nonuniform Distribution of Inspired Gas and Pulmonary Blood Flow
Nonuniform ventilation of the alveoli can be caused by uneven resistance to airflow or nonuniform compliance in different parts of the lung. Uneven resistance to airflow may be a result of collapse of airways, as seen in emphysema; bronchoconstriction, as in asthma; decreased lumen diameter due to inflammation, as in bronchitis; obstruction by mucus, as in asthma or chronic bronchitis; or compression by tumors or edema. Uneven compliance may be a result of fibrosis, regional variations in surfactant production, pulmonary vascular congestion or edema, emphysema, diffuse or regional atelectasis, pneumothorax, or compression by tumors or cysts.
Nonuniform perfusion of the lung can be caused by embolization or thrombosis; compression of pulmonary vessels by high alveolar pressures, tumors, exudates, edema, pneumothorax, or hydrothorax; destruction or occlusion of pulmonary vessels by various disease processes; pulmonary vascular hypotension; or collapse or overexpansion of alveoli.
As already noted in Chapters 3 and 4, gravity, local factors, and regional differences in intrapleural pressure cause a degree of nonuniformity in the distribution of ventilation and perfusion in normal lungs. This will be discussed in detail later in this chapter.
The methods used for testing for nonuniform ventilation, nonuniform perfusion, and ventilation-perfusion mismatch are summarized in Table 5–1.
 Mismatch
  Mismatch
|


Several methods can be used to demonstrate an abnormal distribution of ventilation in a patient.
A rising expired nitrogen concentration in phase III (the “alveolar plateau”) of the single-breath-of-oxygen test shown in Figure 3–14 indicates the possibility of a maldistribution of ventilation (see “The Closing Volume” section of Chapter 3).
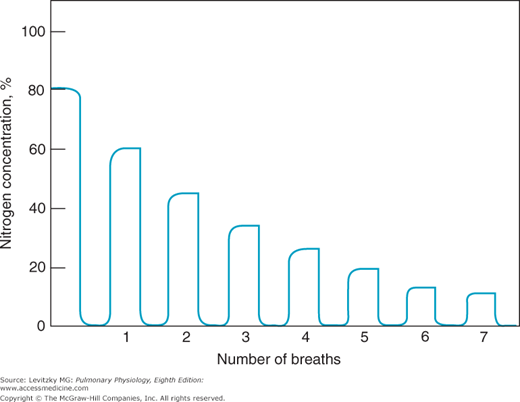
The same equipment used in the single-breath-of-oxygen test mentioned above can be used in another test for nonuniform ventilation of the lungs. In this test, the subject breathes normally through a 1-way valve from a bag of 100% oxygen, and the expired nitrogen concentration is monitored over a number of breaths. With each successive inspiration of 100% oxygen and subsequent expiration, the expired end-tidal nitrogen concentration falls as nitrogen is washed out of the lung (Figure 5–3).
Stay updated, free articles. Join our Telegram channel

Full access? Get Clinical Tree


